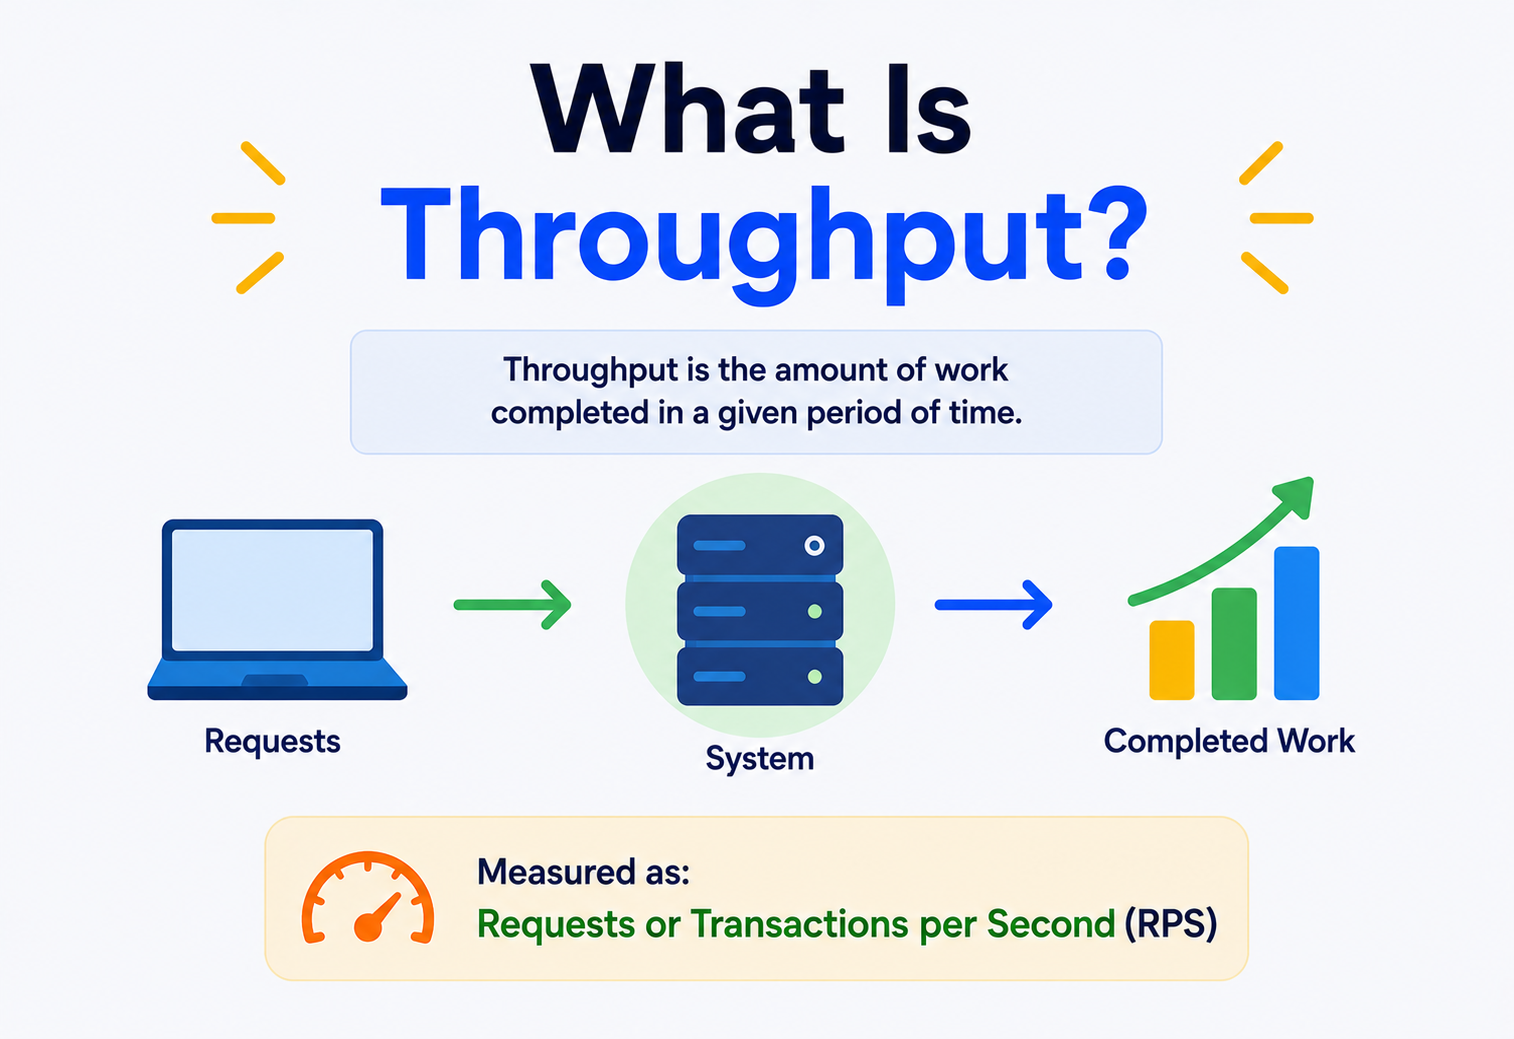
What Is Throughput?
Whether it’s cars rolling off a factory line, data streaming across the internet, or tasks getting checked off a team’s board, one simple question keeps coming up: how much actually gets done in a given stretch of time? That question has a name — throughput — and it turns out to be one of the most useful numbers in all of engineering and work management.
The Big Idea, In One Breath
Throughput is the honest, grounded answer to a deceptively simple question: how much real work did a system actually finish, over a real stretch of time?
Picture a car wash at the end of a busy street. One single lane, one crew, washing cars one at a time. On a quiet Tuesday morning, they might wash eight cars an hour. On a sunny Saturday, with the same crew working just as hard, they still only manage roughly the same eight cars an hour, because that’s simply how many cars can move through that one lane, start to finish, in that stretch of time.
That number — eight cars an hour — is the car wash’s throughput. It doesn’t describe how fast any single car gets washed. It describes how many complete washes actually come out the other end, counted over a fixed period of time. Speed up one car’s wash and you might bump the number up a little. Add a second lane, and you could genuinely double it. But the number itself is always about total output over time, not about any one individual car’s journey.
This exact idea — total output over a fixed stretch of time — shows up constantly across very different worlds: how much data actually flows across a network connection, how many packages a warehouse ships in a day, how many customer tickets a support team resolves in a week, how many tasks a software team finishes in a sprint. Different units, different contexts, but the very same underlying question every single time: how much real work got done, in this amount of time?
Everyday analogy
Think about a school cafeteria line at lunchtime. The line might move students through at a steady rate of one student served every four seconds. Over a fifteen‑minute lunch period, that adds up to a fixed number of students actually fed — that number, not the speed of any single lunch tray, is the cafeteria’s throughput.
Keep that car wash and that cafeteria line in mind as you read on, because nearly every idea in this guide — from computer networks to project management boards — comes back to that same simple measurement: real, completed output, counted over real time.
What makes throughput such a valuable idea is how honestly it cuts through wishful thinking. It’s tempting to describe a system as “fast” or a team as “productive” based on impressions and busy‑looking activity, but throughput refuses to accept vague descriptions — it insists on an actual number, counted over an actual stretch of time, that either holds up to scrutiny or doesn’t.
A Short History of Throughput
The word didn’t start out in computing at all. Its roots go back to the factory floor, and the same underlying question has quietly followed the same word from steel presses to fiber optics to modern software teams.
The word “throughput” didn’t start out in computing at all — it has roots in manufacturing and industrial engineering, stretching back to the early twentieth century, when factories were racing to figure out how many finished goods a production line could actually turn out in a day. Early industrial engineers needed a clean, honest way to measure whether a factory floor was genuinely productive, separate from how busy individual machines or workers looked.
As telecommunications and computer networks developed through the mid‑twentieth century, engineers borrowed the same basic idea to describe something remarkably similar: how much actual data successfully traveled across a communication line in a given stretch of time. Early telephone and telegraph engineers cared enormously about this number, since it directly determined how many messages a line could realistically carry.
The rise of computer networking in the 1970s and 1980s brought throughput fully into the language of engineers building the earliest versions of what would become the internet. As networks grew more complex, with multiple devices sharing limited connections, understanding actual throughput — as opposed to a connection’s theoretical maximum capacity — became essential for diagnosing why a network sometimes felt slow even when nothing appeared to be technically broken.
More recently, the same underlying concept has been enthusiastically adopted by the world of knowledge work and software development, particularly through methodologies like Kanban, where teams track how many tasks or features they actually complete over a given stretch of time, using throughput as a grounded, honest measure of real progress rather than relying purely on estimates or plans.
In plain words
Throughput began as a factory‑floor question — how much did we actually make today? — and has since traveled through telephone lines, computer networks, and software team dashboards, always asking some version of that very same question.
It’s worth appreciating just how consistently useful this one idea has proven across nearly a century of very different technologies. Whether the “thing” moving through a system is a physical part on an assembly line, an electrical signal down a copper wire, a packet of data across a fiber optic cable, or a completed task on a digital board, the underlying question engineers keep asking never really changes. That durability is a strong hint the concept captures something genuinely fundamental about how systems of any kind actually perform.
What Throughput Really Is
A single, careful sentence carries almost the whole idea — and one word inside that sentence does most of the work.
Throughput is a measurement of how much work, data, or output a system actually produces or delivers within a specific period of time. It’s always expressed as a rate — some amount of “stuff” divided by some amount of time — whether that’s bits per second, cars per hour, or tasks completed per week.
The single word that matters most in that definition is actually. Throughput isn’t about theoretical maximum capacity, and it isn’t about how fast any one individual item moves. It’s about real, completed, measured output — what genuinely came out the other end, counted honestly, over a real stretch of time.
It’s worth being precise about what throughput is not. It’s not the same as speed, which describes how quickly one single item moves. It’s not the same as capacity, which describes the maximum a system could theoretically handle under ideal conditions. And it’s not the same as efficiency, which describes how well resources are being used. Throughput sits quietly alongside all of these related ideas, answering its own specific question: how much actually got delivered, in this amount of time?
In plain words
If someone says “our throughput is forty units an hour,” they mean this: over the last hour, forty complete units genuinely came out the other end — not that any single unit took exactly ninety seconds, and not that the system could theoretically do more under perfect conditions.
Two ideas are worth carrying with you through the rest of this guide, because they explain almost every decision engineers and teams make around throughput:
- Throughput measures reality, not potential. It counts what actually happened, which makes it an honest, grounded number rather than an optimistic estimate.
- The whole system matters, not just its fastest part. Throughput is shaped by whichever part of a system is slowest, not by how fast the quickest part could theoretically go.
There’s a helpful way to picture throughput’s relationship to time: it’s always a rate, never a raw count on its own. Saying “we finished 200 tasks” tells you very little without knowing the time period involved — 200 tasks in a day is a very different story from 200 tasks in a year. Throughput always comes paired with its time window, which is exactly what makes it comparable and genuinely meaningful from one measurement to the next.
Throughput In Networking
In computer networks, throughput has a very specific, measurable meaning — and it’s almost always a bit less than the advertised number, for good reasons.
In the world of computer networks, throughput specifically measures how much data successfully travels across a network connection within a given period of time, usually expressed in bits per second, or larger units like megabits or gigabits per second for busier connections.
Engineers often calculate this with a simple formula: divide the total amount of data transferred by the time it took to transfer it, then convert to bits if needed. Sending 10,000 bytes in 10 seconds, for example, works out to 8,000 bits per second, once the standard conversion of eight bits per byte is applied.
This number gets measured differently depending on context. For very short, fast‑moving systems, engineers often look at throughput over tiny slices of time — counting packets received per second, for instance — rather than waiting a full hour to get a meaningful reading, since network conditions can shift dramatically within just a few seconds.
Good to know
Real‑world network throughput is almost always somewhat lower than a connection’s advertised maximum, because real data transfer involves overhead, occasional errors, and other traffic competing for the same shared resources.
It’s worth knowing that throughput can be measured at several different points within the same network journey too. The throughput leaving a sender’s device might differ from the throughput arriving at a receiver’s device, particularly if something along the path — a congested router, a weak wireless signal, an overloaded server — is quietly limiting the flow somewhere in between. Skilled network engineers often measure throughput at multiple points specifically to isolate exactly where a slowdown is actually happening, rather than assuming the whole path behaves uniformly.
Throughput vs Bandwidth
These two words get confused constantly, even by people who work with networks regularly. Getting the distinction crisp is one of the most useful mental upgrades in this whole topic.
Bandwidth describes a connection’s theoretical maximum capacity — the widest the road could ever be, under perfect conditions. Throughput describes what’s actually happening on that road right now — the real traffic genuinely flowing through it, which is almost always somewhat less than the road’s full theoretical width, due to congestion, overhead, and real‑world imperfections.
| Question | Bandwidth | Throughput |
|---|---|---|
| What it measures | Maximum theoretical capacity | Actual data delivered |
| Changes often? | Fixed by the connection itself | Varies with real conditions |
| Analogy | Width of a highway | Actual cars driving on it |
| Typical unit | Bits per second (rated) | Bits per second (measured) |
A useful comparison, borrowed from the world of air travel: bandwidth is like the maximum number of passengers an airport could theoretically process in an hour if every gate, security lane, and staff member operated at peak efficiency simultaneously. Throughput is the actual number of passengers who genuinely passed through during that hour, accounting for real queues, delays, and everyday friction.
Don’t mix up the words
A connection advertised as having enormous bandwidth can still deliver disappointing throughput if something along the way — congestion, a weak signal, a slow device — is holding actual performance back.
This distinction matters enormously in everyday life, not just in technical documentation. Someone paying for an internet plan advertising a large maximum speed might still experience a frustratingly slow video call, precisely because that advertised number describes bandwidth — the theoretical ceiling — while their actual, lived experience depends on throughput, which can be dragged down by dozens of everyday factors the advertised number never accounted for.
Throughput vs Latency
Latency measures something genuinely different, even though the two often get discussed side by side when a system feels slow. A single system can have great throughput and poor latency at the same time — or the exact reverse.
How much, over time
The total volume of work or data completed within a given stretch of time — a measure of quantity.
How long, for one thing
The delay between asking for something and getting the very first response — a measure of waiting time.
A system can have excellent throughput and poor latency at the same time, or the reverse. A cargo ship carrying an enormous number of containers across an ocean has fantastic throughput — huge volume delivered — but genuinely terrible latency, since any single container takes weeks to arrive. An overnight courier delivering one small envelope has wonderful latency — fast delivery for that one item — but comparatively modest throughput, since it can’t move nearly as much total volume.
Everyday analogy
Ordering food for a big party: a caterer bringing one enormous truckload of food, arriving a bit later, might have terrific throughput but middling latency. A fleet of delivery bikes bringing small individual meals almost instantly has fantastic latency but has to make many, many trips to match the same total volume.
Well‑designed systems usually pay attention to both numbers together, because a system that’s excellent at one and poor at the other still leaves users unhappy in a very specific, predictable way.
Video calling offers a particularly relatable example of why both matter simultaneously. A video call needs decent throughput to carry a smooth, high‑quality video stream without pixelation, but it also desperately needs low latency, since a delay of even half a second between people speaking creates that familiar, awkward feeling of talking over each other. Neither number alone tells the whole story of why a call feels good or bad — both have to be reasonably healthy at the same time.
What Affects Throughput
Several real‑world factors can push throughput up or drag it down. Recognising them is the first step toward improving actual performance instead of chasing advertised numbers.
Too much traffic at once
When many users or devices compete for the same limited resource simultaneously, everyone’s share of actual throughput shrinks.
Redoing lost work
Lost data packets or failed transmissions have to be resent, quietly eating into the time available for genuinely new work.
A narrow starting point
A connection or system with a low maximum capacity puts a hard ceiling on how high throughput could ever climb.
Time spent managing, not doing
Effort spent scheduling, checking, or coordinating work reduces the time actually available for producing real output.
In networking specifically, intentional restrictions also play a real role — internet providers sometimes deliberately cap throughput on cheaper service plans, or organizations may prioritize certain types of traffic over others, reserving higher performance for the applications that need it most and accepting lower throughput elsewhere as a deliberate trade‑off.
The specific protocol a system uses to transmit data can shape throughput significantly too. Some protocols include careful mechanisms for managing data flow and avoiding congestion gracefully, sacrificing a little raw speed in exchange for steadier, more reliable delivery. Others are built for simplicity and speed at the cost of that careful management, trading some reliability for potentially higher raw throughput under ideal conditions. Neither approach is universally better — the right choice depends entirely on what a particular application actually needs.
Good to know
Improving throughput almost never means simply “working faster” everywhere at once — it usually means finding and fixing the one specific factor that’s currently holding the whole system back.
The specific transmission medium matters too, and it’s worth knowing at a basic level. A wired connection, like ethernet cable, tends to offer more consistent, predictable throughput than a wireless connection, which is more vulnerable to interference from walls, distance, and competing signals sharing the same airwaves. This is part of why a device plugged directly into a router often experiences noticeably steadier throughput than the same device connecting wirelessly from across the room.
Jitter — small, unpredictable variations in how quickly data arrives — also quietly erodes throughput, even when average conditions look fine on paper. A connection that delivers data in uneven bursts, with unpredictable gaps in between, ends up completing less real work over time than a connection delivering the same average amount steadily and predictably, since systems often have to wait out those gaps rather than making productive use of them.
Throughput In Project Management
Beyond networks and factories, throughput has become a genuinely central concept in modern project management, particularly within Kanban and other flow‑based approaches to organising work.
In this context, throughput simply means the number of work items — tasks, stories, tickets, features, however a team defines them — genuinely finished within a chosen stretch of time. It’s an exact count, not an estimate or an average, and it answers one very clear question: how many things did this team actually complete?
Define “item”
A team needs shared clarity on what counts as one unit of work — a story, a bug fix, a feature.
Define “done”
Work only counts toward throughput once it’s crossed a clearly agreed finish line, not when it merely looks nearly complete.
Pick a window
A week, a sprint, a month — any consistent stretch of time the team agrees to measure against.
Count and track
Tally how many items crossed the finish line within that window, and repeat regularly to spot trends.
This measurement matters for reasons beyond simple bookkeeping. Throughput is one of several core flow metrics teams use to understand how smoothly work genuinely moves through their process, alongside related ideas like how many items are in progress at once and how long each one typically takes from start to finish. Together, these numbers paint a far more honest picture of a team’s real capacity than optimistic planning estimates alone ever could.
In plain words
Throughput in project management answers a refreshingly simple question: not “what did we plan to do,” and not “how busy did we look,” but “how many things did we actually finish?”
This grounded honesty is exactly why throughput has become such a trusted tool for forecasting. Rather than asking a team to guess how long a large batch of upcoming work might take — a notoriously unreliable exercise — a team can instead look at its own recent, real throughput and use it to build a statistically grounded estimate, sometimes running many simulated scenarios to produce a realistic range of likely completion dates rather than a single, falsely precise guess.
It’s also worth noting that throughput data becomes more trustworthy the more consistently it’s collected. A team measuring throughput sporadically, with gaps and inconsistent definitions, ends up with a noisy, unreliable picture. A team measuring it the same careful way, week after week, builds a genuinely useful historical record that gets more valuable the longer it’s maintained.
Throughput vs Velocity
Within agile and Kanban circles specifically, throughput often gets compared — and sometimes confused — with a related but genuinely different measurement called velocity.
| Question | Throughput | Velocity |
|---|---|---|
| What it counts | Number of finished work items | Sum of estimated “points” completed |
| Based on estimates? | No — a simple, exact count | Yes — relies on point estimates |
| Comparable across teams? | Reasonably, with shared definitions | Rarely — point scales differ by team |
| Complexity to calculate | Very simple | Requires an estimation process |
Velocity depends on story points — a team’s own internal, often inconsistent estimate of how much effort a task involves — which makes it notoriously difficult to compare fairly between different teams, or even to trust completely within one team over time, since estimation habits can quietly drift. Throughput sidesteps that whole problem by counting something concrete and unambiguous: how many items actually got finished, full stop.
Worth remembering
Throughput counts finished things. Velocity counts estimated effort. They can tell surprisingly different stories about the very same team, which is exactly why many modern flow‑based approaches favor throughput as the more grounded, honest measurement.
It’s worth understanding why this distinction actually matters in practice, not just in theory. A team’s velocity can rise simply because they’ve started estimating tasks more generously, even if their true output hasn’t changed at all — a subtle, easy‑to‑miss distortion that can quietly mislead planning. Throughput doesn’t have this vulnerability, since a finished task is a finished task, regardless of how anyone estimated its size beforehand.
None of this means velocity is worthless — it can still offer a useful internal signal for a single team tracking its own trends over time. The caution is mainly about comparing velocity across different teams, or treating it as an objective, universal measure of productivity, when it’s really a somewhat subjective, team‑specific number shaped by that team’s own estimation habits.
Where Throughput Actually Shows Up
This single idea quietly threads through an enormous range of everyday systems, far beyond the obvious cases of networks and software teams.
Smooth playback for millions
How many simultaneous video streams a platform’s infrastructure can actually deliver without buffering or quality drops.
Units off the line
How many finished products a factory line genuinely produces per hour or per shift.
Calls actually resolved
How many customer calls a support team genuinely completes and resolves within a working day.
Transactions processed
How many financial transactions a payment system can genuinely process per second, especially during peak shopping moments.
Airports offer a particularly vivid, familiar example. A busy airport’s throughput might be measured in passengers processed through security per hour — a number shaped by staffing, equipment, and how smoothly the whole system coordinates, quite separate from how fast any single traveler personally moves through the line.
Hospitals track a version of this too, watching how many patients a particular department can genuinely treat and discharge within a day — a number with real consequences for care quality, especially during unusually busy periods when demand surges unpredictably.
Public transportation systems think about throughput constantly, even if they rarely use that exact word. A subway line’s real value isn’t just how fast one single train moves — it’s how many passengers the whole system can genuinely move through a station during a busy morning rush, which depends on train frequency, platform design, and how smoothly boarding and alighting actually happen in practice.
Even something as ordinary as a coffee shop during a morning rush is a throughput story in miniature. A shop might brew coffee quickly for any single customer, but its real throughput — how many customers actually get served across a busy hour — depends just as much on how efficiently the whole line moves, how orders get taken, and how quickly payment happens, not merely on how fast the espresso machine itself runs.
Real Systems, Real Choices
It helps to see throughput playing out in systems people actually rely on, rather than staying purely theoretical.
Large streaming platforms obsess over throughput at a genuinely massive scale, since delivering smooth video to millions of simultaneous viewers depends entirely on sustaining enormous, steady throughput across a sprawling, globally distributed infrastructure. A brief dip in throughput during a hugely popular live event can mean millions of viewers simultaneously experiencing buffering, which is exactly why these platforms invest so heavily in monitoring and improving this one specific number.
E‑commerce platforms track transaction throughput especially closely around major sales events, when the number of purchases attempted per second can spike dramatically beyond an ordinary day. A payment system that can’t sustain enough throughput during that spike risks failed transactions at the exact moment a retailer most needs everything to work flawlessly.
Software teams practicing Kanban lean on throughput data to make genuinely useful forecasts, using historical completion rates to answer questions like “roughly when might this batch of work realistically finish?” with actual statistical grounding, rather than relying purely on hopeful guesses made at the start of a project.
Good to know
Whether it’s data packets or finished tasks, organisations that track throughput consistently over time tend to make noticeably better predictions about their own future capacity than those that don’t.
Ride‑sharing and delivery platforms depend on a particularly dynamic version of throughput thinking, since demand for rides or deliveries can swing dramatically within just a few minutes — a sudden rainstorm, a major event letting out, a holiday rush. These platforms constantly monitor real throughput against real demand, adjusting incentives and matching algorithms on the fly to keep the two as closely balanced as possible.
Manufacturing companies producing physical goods track throughput at nearly every stage of their production process, often displaying real‑time counts on factory floor screens. This isn’t just a curiosity — a sudden, unexplained dip in throughput on a production line is often the very first, earliest sign that something has gone subtly wrong with a machine, a material supply, or a process step, long before the problem becomes obvious in any other way.
Why Measuring Throughput Matters
Tracking throughput carefully pays off in ways that go well beyond simply having an interesting number to look at.
What it reveals
- An honest, grounded picture of real capacity, not optimistic estimates
- Where bottlenecks are quietly limiting overall performance
- Whether a system is keeping pace with incoming demand
- Meaningful trends over time that raw daily numbers can hide
- A fair, comparable baseline for judging genuine improvement
What it enables
- Realistic forecasting, grounded in actual historical performance
- Smarter capacity planning, sized to real demand rather than guesses
- Early warning when a system is falling behind its workload
- Fairer conversations about capacity, based on shared facts
- Confident decisions about where to invest improvement effort
That last point deserves real attention. Without a clear throughput number, conversations about performance or capacity tend to rely on gut feelings and impressions, which are notoriously unreliable. A concrete, consistently measured throughput figure turns vague impressions into an actual, shared fact everyone can reason about together.
There’s a quieter benefit worth naming too: throughput data, tracked honestly over time, tends to build genuine trust between teams and the people relying on their output. A team that can point to a consistent, well‑understood throughput history has a far easier time having honest, grounded conversations about realistic timelines than a team relying purely on optimistic promises made under pressure.
The Trade-offs And Risks
Throughput isn’t a perfect, risk‑free metric, and treating it as the only thing that matters can lead a team or system astray.
The honest downsides
- Chasing throughput alone can quietly encourage cutting corners on quality
- A single average number can hide painful variability underneath it
- Optimizing one part of a system can simply shift the bottleneck elsewhere
- Comparing throughput across very different teams or systems can mislead
Risks to watch for
- Treating throughput as a target can distort genuine behavior around it
- High throughput doesn’t automatically mean the right things are being delivered
- Focusing purely on volume can crowd out attention to actual outcomes
- Short measurement windows can produce noisy, misleading swings
A common misunderstanding
Higher throughput isn’t automatically better. A team rushing to finish more items, or a network pushing more raw data through, can quietly sacrifice quality or correctness in the process — throughput measures quantity, not whether that quantity was actually worth producing.
This connects to a well‑known caution in measurement generally: once a number becomes a target people are judged against, there’s a real risk people start optimizing for the number itself rather than for the genuine value it was originally meant to represent. Throughput is a wonderful diagnostic tool precisely because it’s honest — but that honesty can be undermined the moment it becomes a pressure tactic rather than a source of insight.
Variability is another subtle risk worth naming. Two systems can report the exact same average throughput while behaving completely differently underneath — one delivering a steady, predictable stream of output, the other lurching between bursts of activity and long stretches of nothing. An average alone can’t distinguish between these two very different realities, which is why experienced engineers and managers often look at the full spread of data, not just the single averaged number, before drawing conclusions.
Throughput In The Cloud
Modern cloud infrastructure has made monitoring and improving throughput dramatically more accessible than it once was, with dashboards, alerts, and automated scaling tools built specifically around this one measurement.
Load balancers — the traffic directors sitting in front of many cloud applications — actively work to maximize throughput by spreading incoming requests evenly across multiple servers, preventing any single machine from becoming a bottleneck that drags the whole system’s numbers down. Auto‑scaling tools take this further, automatically adding more capacity the moment demand threatens to outpace current throughput, and quietly removing that extra capacity again once demand settles back down.
1. Monitor real throughput
Dashboards track actual requests or data processed per second, not just theoretical system capacity.
2. Spot the bottleneck
Engineers identify exactly which part of the system is currently limiting overall throughput.
3. Scale or optimise
Additional capacity is added, or the specific bottleneck is directly addressed and improved.
4. Confirm the improvement
Fresh throughput measurements confirm whether the change actually raised real, sustained output.
Techniques like compression and connection reuse also play a real role here, letting systems accomplish more genuine work within the same available capacity, effectively squeezing more real throughput out of an unchanged underlying connection.
Everyday analogy
Auto‑scaling for throughput is a bit like a restaurant calling in extra staff the moment a dinner rush begins, then sending people home again once the crowd thins out — matching real capacity to real, current demand rather than staffing for one fixed level all day long.
Cloud monitoring tools have also made it far easier to spot throughput problems before they become genuine emergencies. Rather than waiting for customers to complain about a slow application, modern dashboards can alert an engineering team the moment throughput starts trending in the wrong direction, giving them a chance to investigate and respond while the problem is still small and manageable.
The Cost And Performance Picture
Improving throughput almost always involves some kind of trade‑off. Being honest about the costs involved leads to far smarter decisions than chasing bigger numbers blindly.
| Approach | What it buys | What it costs |
|---|---|---|
| Add more capacity | Higher ceiling for throughput | More infrastructure spend |
| Remove a bottleneck | Better use of existing capacity | Engineering time to diagnose and fix |
| Reduce overhead | More real work per unit of capacity | Sometimes added complexity |
| Simply demand more output | A short‑term bump, if any | Real risk to quality and sustainability |
That last row deserves particular attention, since it’s the trap many teams and systems fall into. Simply demanding higher throughput — pushing more data through a strained connection, or pressuring a team to finish more tasks without changing anything structural — rarely produces genuine, lasting improvement. Real throughput gains almost always come from addressing an actual limiting factor, not from wishing the number were higher.
In plain words
You can’t simply ask a system to have higher throughput any more than you can ask a single‑lane car wash to suddenly wash twice as many cars — something structural has to change first, whether that’s more capacity, less waste, or a genuinely faster process.
It’s worth being realistic about diminishing returns too. The first improvements to a genuinely constrained system often produce dramatic gains, since a badly bottlenecked system usually has an obvious, easy‑to‑fix constraint sitting right at the front. Later improvements tend to yield smaller and smaller gains, as the easy wins get used up and each further increase in throughput requires proportionally more investment to achieve — a pattern worth expecting rather than being surprised by.
The Bottleneck Problem
Perhaps the single most important idea connected to throughput: a system’s overall throughput is always limited by its slowest, most constrained part — never by its fastest one.
This principle is sometimes called the theory of constraints, and it explains why throughput improvements so often disappoint when they target the wrong piece of a system.
Picture a three‑stage process where the first stage can handle 100 items an hour, the middle stage can only manage 20, and the final stage could handle 150. No matter how fast the first and last stages are, the entire system’s real throughput is stuck at 20 items an hour, because everything has to pass through that middle bottleneck. Speeding up the already‑fast stages accomplishes nothing for overall throughput; only fixing the bottleneck itself moves the needle.
This principle applies just as cleanly to a software team’s workflow as it does to a factory line or a computer network. A team that writes code quickly but has a slow, backed‑up review process isn’t limited by how fast anyone writes code — their real throughput is limited by how quickly reviews get done, no matter how impressively fast everything else moves.
There’s a genuinely counterintuitive lesson buried in this idea, one worth sitting with: sometimes deliberately slowing down a non‑bottleneck part of a system can actually help overall throughput, by preventing unfinished work from piling up faster than the bottleneck can absorb it. A fast first stage that constantly overwhelms a slow middle stage with more half‑finished work than it can handle often creates more chaos and delay than it solves, even though every individual stage looks impressively busy.
Rule of thumb
Before trying to speed anything up, find the actual bottleneck first. Improving a part of the system that isn’t the constraint feels productive but changes nothing about overall throughput.
Choosing The Right Metric
Throughput is a genuinely powerful number, but it isn’t the only measurement that matters. Knowing when to lean on it — versus reaching for a different metric — makes a real difference.
Throughput fits well
When the question is “how much can this system genuinely handle over time,” throughput is exactly the right lens.
Latency fits better
When the question is “how long does one specific request or task take,” latency captures that far more directly.
Utilization fits better
When the question is “how well are we using what we already have,” utilization tells a more relevant story.
Throughput over time fits well
When the question is “are we genuinely improving,” a consistent throughput trend line is a grounded way to check.
Most healthy systems and teams end up tracking several complementary metrics side by side rather than fixating on just one, since each one illuminates a different part of the same underlying picture.
That guiding sentence captures the discipline worth holding onto: throughput is an excellent diagnostic tool for understanding how a system genuinely performs, but it works best alongside other measures of quality and outcome, not as a lone number pursued at any cost.
A useful habit for any team or engineer is to pair every throughput number with a quick, honest second question: “And is what we’re producing actually good?” Asking both questions together, consistently, is what separates genuinely healthy performance measurement from a narrow obsession with volume alone.
A Worked Example, Start To Finish
Ideas like this are easiest to remember through a story, so imagine a small customer support team at a company called Harborline, handling incoming help tickets. Here’s how throughput thinking might play out for them.
1. A baseline gets measured
Harborline discovers their team resolves roughly 40 tickets a week, consistently, over the past two months.
2. Demand starts outpacing supply
Incoming tickets climb to 55 a week, but throughput stays stuck at 40 — a growing backlog quietly builds up.
3. The bottleneck gets found
Investigation reveals most delay happens waiting for a single specialist to approve refund‑related tickets.
4. The bottleneck gets addressed
A second team member is trained to handle refund approvals, removing the single point of delay.
5. Throughput genuinely rises
Weekly resolved tickets climb to 58, finally keeping pace with incoming demand, and the backlog stops growing.
Notice what Harborline didn’t do: they didn’t simply ask everyone to “work faster” across the board, and they didn’t add headcount randomly. They measured their real throughput, found the actual constraint holding it back, and fixed that specific thing — exactly the disciplined approach that turns a vague sense of being overwhelmed into a targeted, effective fix.
In plain words
The best throughput story is usually a quiet, disciplined one — measure honestly, find the real constraint, fix that specific thing, and confirm the number actually moved.
It’s worth imagining how differently this could have gone with a less disciplined approach. Harborline could easily have responded to the growing backlog by simply asking everyone to “work harder” or by hiring several new general support staff, without ever identifying that one specific approval step as the actual constraint. That kind of response often burns real money and goodwill while barely moving the needle, precisely because it never touches the thing actually holding throughput back.
Common Pitfalls
A handful of familiar traps show up over and over in real teams and real systems — each of them easy to fall into, and each of them worth naming so it can be spotted early.
Chasing the number instead of the goal
Treating throughput as a target to hit, rather than a diagnostic to learn from, can quietly encourage shortcuts that boost the number while hurting genuine quality or value.
Optimizing the wrong part of the system
Speeding up a stage that isn’t the actual bottleneck feels productive but changes nothing about overall throughput.
Measuring over too short a window
Looking at throughput over a single hour or a single day can produce noisy, misleading swings that don’t reflect genuine underlying trends.
Comparing incomparable systems
Comparing raw throughput numbers between very different teams, networks, or systems, without accounting for their different contexts, often leads to unfair or misleading conclusions.
Forgetting to define “done” clearly
In project settings especially, an unclear or inconsistent definition of when work truly counts as finished quietly undermines the reliability of any throughput number built on top of it.
Ignoring variability behind the average
Reporting a single average throughput number, without looking at how much it actually swings week to week, can hide real instability that a steady‑looking average quietly papers over.
Watch out for
A team or system proudly reporting rising throughput, with nobody asking whether quality, correctness, or genuine value rose alongside it. A bigger number isn’t automatically a better one.
Best Practices For Working With Throughput
Good throughput practice tends to follow a consistent handful of habits, regardless of whether the context is networking, manufacturing, or project management.
1. Define terms clearly before measuring
Agree exactly what’s being counted, and exactly when something counts as finished.
2. Measure consistently over a sensible window
Avoid drawing conclusions from single, noisy snapshots of a much longer trend.
3. Find the real bottleneck before optimizing
Improving the wrong part of a system wastes effort without moving the actual number.
4. Pair throughput with a quality check
Track a complementary measure of correctness or satisfaction alongside raw volume.
5. Use it to inform, not to pressure
Treat throughput as a source of honest insight, not a stick used to demand more output.
6. Revisit definitions as things evolve
What counted as “done” or “delivered” a year ago may deserve a fresh look today.
7. Look at the full spread, not just the average
A single averaged number can hide meaningful swings worth understanding.
8. Share throughput data openly
Transparent, consistently reported numbers build far more trust than numbers revealed only when convenient.
None of these habits require sophisticated tools or a large team — they mostly come down to treating throughput as a genuinely useful lens for understanding a system honestly, rather than a scorecard to be gamed or a number pursued without regard for what it actually represents.
Helpful habit
Before trying to raise throughput anywhere, ask a simple question first: “What specifically is slowing this down right now?” Answering that honestly almost always points straight to the right fix.
Questions People Often Ask
Short answers to the questions engineers, managers, and curious readers ask most often about throughput.
Q1: Is higher throughput always better?
Not automatically — throughput measures quantity, not quality or value, so a rising number is only genuinely good news when what’s being produced is still correct and worthwhile.
Q2: What’s the difference between throughput and productivity?
They’re closely related, but productivity often factors in the resources used to achieve that output, while throughput simply counts the output itself, over time, without weighing the cost involved.
Q3: Can throughput be measured for something like customer support or sales?
Yes — any process with a clear “finished” state can have its throughput measured, whether that’s resolved tickets, closed deals, or shipped orders.
Q4: Why does my internet connection’s throughput vary throughout the day?
Real‑world throughput shifts constantly with network congestion, how many devices are active, and overall demand — it rarely sits still at a connection’s theoretical maximum.
Q5: Is throughput the same thing as speed?
Not quite — speed usually describes how quickly one single item moves, while throughput describes the total volume completed over time, which depends on the whole system, not just one item’s journey.
Q6: How often should a team or system measure throughput?
Regularly and consistently — a steady weekly or monthly rhythm tends to reveal genuine trends far better than occasional, one‑off snapshots.
Q7: Can two systems with identical average throughput actually perform very differently?
Yes — one might deliver output steadily and predictably, while another swings wildly between bursts and lulls, even though their averages look identical on paper.
Q8: Does raising throughput always require adding more resources?
Not necessarily — sometimes removing a specific bottleneck, reducing wasted overhead, or fixing a slow step accomplishes more than simply adding more capacity everywhere.
Key Takeaways
Everything above, distilled — the parts worth remembering after you close this tab.
- Throughput measures how much genuine output a system produces within a specific period of time.
- It’s different from bandwidth, which measures theoretical maximum capacity, and different from latency, which measures delay for a single item.
- A system’s throughput is always limited by its slowest bottleneck, never by its fastest part.
- In project management, throughput counts genuinely finished work items, offering a more grounded measure than estimate‑based metrics like velocity.
- Higher throughput isn’t automatically better — it should be paired with attention to quality and genuine value, not chased blindly.
- Improving throughput almost always means finding and fixing a real constraint, not simply demanding more output from an unchanged system.
- Throughput lives in the ratio of real output to real time — without the time window, the raw count means very little.
- The same word, the same underlying question, quietly links factory floors, fiber optic cables, and modern software teams — a strong hint the concept captures something fundamental about how systems perform.
Final thought
Throughput is a lens, not a scoreboard. Used honestly, it turns vague impressions of “fast” or “slow” into a shared, grounded fact you can actually reason about. Used carelessly, it becomes just another number to game. Which of the two it becomes depends entirely on the discipline of the team using it.