Load Testing vs Stress Testing
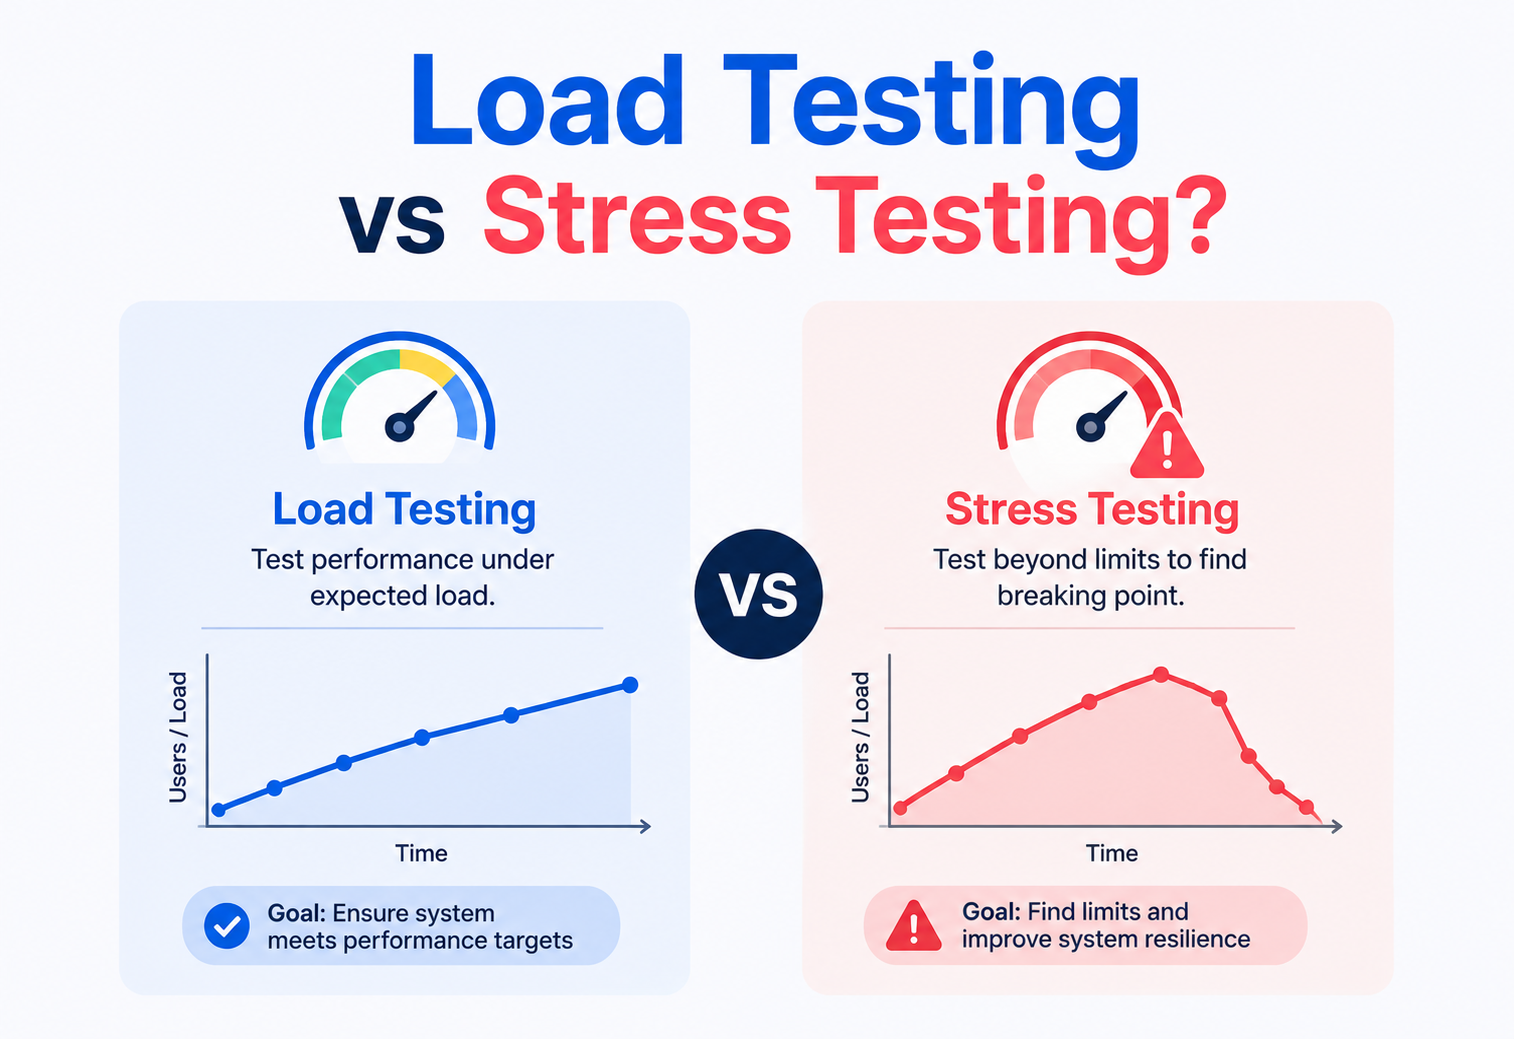
Two dials on the same instrument panel. One tells you how your system behaves under the traffic you actually expect. The other tells you what happens when you push past every limit you ever planned for. This guide walks through both — from first principles all the way to production-grade practice used at Netflix, Amazon, Uber and Google.
Introduction & History
Every serious piece of software eventually meets real traffic. The only question is whether you meet that traffic on your own terms — deliberately, in a test environment — or on the traffic’s terms, in production, in front of your users. Load and stress testing are how you meet it deliberately.
Imagine you have just built a bridge. Before you let a single car drive across it, there are two very different questions you would want to answer. The first is: “If 500 cars cross this bridge every hour, exactly like the traffic engineers predicted, will the bridge hold up comfortably, and will cars flow smoothly or crawl in a jam?” That is a load testing question. The second is: “What if, on some freak day, 5,000 cars try to cross at once? Where does the bridge start to crack, and when it finally does give way, does it fail gently — with warning groans and a slow sag — or does it collapse instantly without warning?” That is a stress testing question.
Software systems are no different from bridges in this respect. Every application — a shopping website, a banking API, a chat service, a video-streaming platform — is built to handle a certain amount of traffic. But nobody actually knows how it behaves under that traffic, or beyond it, until they test it deliberately. That is the entire reason performance testing exists as a discipline in software engineering, rather than just a nice-to-have.
1.1 A Short History
Performance testing is almost as old as multi-user computing itself. In the 1960s and 1970s, when mainframe computers first started serving many users at once through time-sharing systems, engineers needed a way to simulate many terminals typing commands simultaneously, so they could be sure the mainframe would not grind to a halt when everyone logged in for the morning shift. Early tools were often custom-written scripts that literally played back keystrokes, one after another, at the rate a real operator would type them.
As client-server computing and then the web took over in the 1990s, tools like LoadRunner (from Mercury Interactive, later acquired by HP) became the industry standard for simulating thousands of virtual users hitting a web server. The web’s explosive growth made this urgent: a single Black Friday sale, a single viral news article, or a single ticket-sale launch could bring an unprepared server to its knees, and companies had learned this the hard way — in public, in front of customers, sometimes in front of national news cameras.
Through the 2000s and 2010s, open-source tools such as Apache JMeter (started in 1998 but heavily matured through the 2000s) and later Gatling and k6 democratised performance testing. What used to require an expensive enterprise licence became something any developer could run from a laptop, often for free. At the same time, the rise of cloud computing and microservices completely changed what “the system” even meant — instead of one server, you now had dozens or hundreds of independently deployed services calling each other, each with its own capacity limits, each capable of failing separately.
Today, load testing and stress testing are treated as first-class citizens in software delivery. They are often automated as part of continuous integration and continuous delivery (CI/CD) pipelines, and closely tied to disciplines like Site Reliability Engineering (SRE) and chaos engineering — both of which we will touch on later in this guide.

Think of a restaurant kitchen. Load testing is like the head chef asking, “On a normal Friday night with 80 reservations, can my kitchen cook and serve every dish within 20 minutes?” Stress testing is like asking, “What happens if 300 people walk in without reservations because a food blogger just posted about us? Does the kitchen slow down gracefully — putting people on a waiting list and cooking simpler dishes — or does it catch fire?” Same kitchen, same chef, radically different questions.
Both tests use the same tools, the same virtual users, and often the same scripts. The only thing that really changes between them is the load profile — the shape of traffic you feed into the system — and the question you are trying to answer. That is why beginners often use “load testing” as an umbrella term for both, and why practitioners keep having to remind each other of the distinction.
Problem & Motivation
Why do we even need these two distinct kinds of testing? Because software behaves in ways that are very hard to predict just by reading the code — and the wrong time to find that out is on launch day.
A system might work perfectly when one person uses it, but slow to a crawl — or crash entirely — when a thousand people use it at the same time. This happens because of things that only appear under concurrency: shared resources getting locked, memory filling up, network connections queuing behind each other, databases getting overwhelmed with simultaneous queries, thread pools running dry. None of these show up in a happy-path unit test. All of them show up in production.
Without load and stress testing, teams find out about these problems in the worst possible way: in production, in front of real users, often at the worst possible moment (a big sale, a product launch, a viral moment). This has happened to extremely well-funded, extremely well-engineered companies:
- Government health-insurance sign-up websites have crashed on launch day because nobody had simulated the real number of simultaneous sign-ups.
- Ticket-selling websites have gone down within minutes of tickets for a popular concert going on sale.
- E-commerce sites have slowed to a crawl or shown errors during flash sales like Black Friday, costing millions in lost revenue per hour of degraded service.
The motivation for load testing is confidence — confidence that the system will behave correctly and quickly enough under the traffic you actually expect. The motivation for stress testing is awareness — awareness of where your system’s breaking point is, and whether it fails in a controlled, recoverable way (like a circuit breaker tripping and shedding low-priority requests) or in an uncontrolled, catastrophic way (like a cascading crash that pulls down other systems around it).
Load testing prevents embarrassment on a normal busy day. Stress testing prevents disaster on an abnormal, unexpected day. Both are forms of insurance — you hope you never need what they tell you, but when you do, the answer is the difference between a graceful slowdown and a front-page outage.
Core Concepts
Before comparing the two testing types head-to-head, we need a shared vocabulary. Many beginners get confused about load and stress testing simply because they do not yet know the underlying terms. Let us build them up one at a time, in plain English, so nothing later in the guide feels magical.
3.1 Virtual Users (VUs)
What: A virtual user is a simulated person using your system. It is not a real human — it is a small program (often just a thread or a lightweight coroutine) that sends the same kinds of requests a real user would send: log in, browse a product, add to cart, check out.
Why: You cannot hire 10,000 real people to click around your website at 2 a.m. just to test capacity. Virtual users let you simulate that scale cheaply, repeatably, and at any time of day.
Analogy: Think of crash-test dummies. Car manufacturers do not crash real people into walls — they use dummies that behave like people (in terms of weight and movement) to measure what happens. Virtual users are the crash-test dummies of your software.
3.2 Throughput
What: The number of requests (or transactions) your system successfully processes per unit of time, usually measured in requests per second (RPS) or transactions per second (TPS).
Why: It is the most direct measure of “how much work is getting done.” A checkout service that processes 200 orders per second has double the throughput of one that processes 100 per second.
Analogy: Throughput is like the number of cars that cross a toll booth per minute. It does not matter how fast any one individual car drives if the booth itself can only process a certain number of cars per minute.

3.3 Latency (Response Time)
What: The time between when a request is sent and when the response is received, for a single request.
Why: Users do not feel throughput directly — they feel latency. A page that takes 8 seconds to load feels broken, even if the server behind it is technically handling enormous throughput.
Analogy: Latency is how long any one specific car waits at the toll booth, from arrival to leaving with a ticket. Throughput describes the booth. Latency describes each driver’s personal experience of it.
3.4 Percentiles (p50, p95, p99, p999)
What: Instead of looking at the average response time, engineers look at percentiles. p50 (the median) means 50% of requests were faster than this value. p99 means 99% of requests were faster than this value — in other words, only 1% of requests were slower.
Why: Averages hide outliers. If 99 requests take 100 ms and 1 request takes 10 seconds, the average looks fine, but that one unlucky user had a terrible experience. p99 and p999 (the 99.9th percentile) are how you expose these “tail latency” problems that averages cheerfully paper over.
Analogy: Imagine a school reports that the “average” wait time to see the nurse is 5 minutes, but forgets to mention that 1 in 100 kids waited 2 hours because the nurse was overwhelmed. Percentiles are how you catch that hidden 1-in-100 kid.
3.5 Ramp-up Period
What: The time over which virtual users are gradually added to the test, rather than all appearing at once.
Why: Real traffic rarely appears instantly (except in true spike scenarios, like a flash sale opening). Ramping up mimics how users trickle in over minutes, and it also lets you observe the system’s behaviour at each intermediate load level, not just the final one.
3.6 Saturation Point / Breaking Point
What: The load level at which the system stops improving throughput even as more load is added, and/or starts producing errors or unacceptable latency.
Why: This is exactly the number stress testing is hunting for. Beyond this point, adding more users does not get more work done — it just makes everything slower or makes requests outright fail.
3.7 Load Testing — Formal Definition
Load testing is the practice of simulating an expected (or slightly-above-expected) number of concurrent users or requests against a system, in order to measure its performance — throughput, latency, error rate, resource usage — under realistic, anticipated conditions. The goal is validation: does the system meet its performance requirements under normal and peak-expected load?
3.8 Stress Testing — Formal Definition
Stress testing is the practice of deliberately pushing a system beyond its expected capacity — often well beyond it, sometimes until it breaks — in order to discover its upper limits, observe its failure behaviour, and verify that it degrades or fails safely (rather than catastrophically) when overwhelmed. The goal is discovery: where does the system break, and what happens when it does?
“Does my system meet its performance goals under the traffic I expect?”
Validation against realistic expectations. Repeatable, relatively safe to run, and cheap to act on the findings.
“Where does my system break, and does it break safely?”
Discovery of the failure point. Riskier to run, but the only way to know your true upper limit and how the system behaves at the edge.
3.9 Related but Distinct Testing Types (So You Do Not Confuse Them)
| Test type | What it checks | Typical load pattern |
|---|---|---|
| Load testing | Performance under expected/peak-expected traffic | Steady, at or near expected peak |
| Stress testing | Breaking point and failure behaviour | Increasing beyond expected peak, until failure |
| Spike testing | Behaviour under a sudden, short burst of traffic | Sharp, brief spike, then drop |
| Soak / endurance testing | Behaviour over long sustained duration (memory leaks, slow degradation) | Moderate load sustained for hours or days |
| Scalability testing | How performance changes as you add more resources (scale-out / scale-up) | Increasing load matched with increasing capacity |
| Volume testing | Behaviour with a large volume of data, not necessarily users | Large datasets, not necessarily concurrency |
People often use “load testing” as an umbrella term for all performance testing, and “stress testing” specifically for the “break it” test. That is roughly correct as a mental shortcut, but as the table above shows, spike testing, soak testing, and scalability testing are their own distinct disciplines that frequently get bundled under the “stress” label in casual conversation. This guide focuses specifically on load versus stress.
Architecture & Components
Whether you are running a load test or a stress test, the underlying architecture of the test setup is almost identical. Only the load profile you feed into it differs. Let us break down the pieces one by one.
4.1 Test Script / Scenario Definition
This defines what a virtual user actually does: log in, search for a product, view a product page, add to cart, check out. It is written in a tool-specific format — JMeter uses XML-based test plans (usually built with a GUI), Gatling and k6 use code (Scala and JavaScript respectively), and custom Java-based frameworks can use plain code, as we will demonstrate later in this guide.
4.2 Load Generator / Controller
This is the engine that actually spawns virtual users and executes the script repeatedly, according to a load profile — a plan describing how many virtual users are active at each point in time. For load testing, the profile targets your expected peak. For stress testing, the profile keeps climbing past that peak until something interesting happens.
4.3 System Under Test (SUT)
This is your actual application — web servers, application servers, APIs, and everything behind them. In modern architectures this is rarely a single server; it is a whole constellation of microservices, load balancers, databases, and caches, each with its own capacity limits.
4.4 Supporting Infrastructure: Databases, Caching, Load Balancing
These are the pieces most likely to become the bottleneck under load. A database might handle 50 queries per second happily but fall over at 500 due to lock contention. A cache (like Redis or Memcached) exists specifically to reduce load on the database by serving frequently-requested data from memory. A load balancer distributes incoming requests across multiple server instances so no single instance gets overwhelmed. Load and stress tests are precisely how you discover the real limits of each of these components — not their theoretical, marketing-brochure limits.
4.5 Metrics Collector
Throughout the test, a metrics collector (built into the tool, or an external system like Prometheus / Grafana) gathers throughput, latency percentiles, error rates, and often infrastructure metrics like CPU, memory, disk I/O, and network usage from the system under test.
4.6 Dashboard / Report
At the end (and often in real time), the results are visualised: response-time graphs, error rate over time, throughput curves. This is what engineers actually look at to make decisions — often live, deciding on the spot whether to stop a stress test before something bad happens.
Suppose you run an online bookstore. For a load test, you might simulate 2,000 concurrent shoppers browsing and buying books — roughly what you expect on a normal busy Saturday. For a stress test, you would keep the exact same script but ramp virtual users up to 4,000, then 8,000, then 16,000, watching at each step whether response times stay acceptable, whether errors start appearing, and eventually seeing at what number the system starts failing outright. Same architecture. Same script. Very different questions.
Internal Working
How does a load-testing tool actually simulate thousands of users from, say, a single laptop or a small cluster of test machines? This is a question many beginners never get an answer to, so let us open the hood.
5.1 Threads vs. Asynchronous / Event-Driven Virtual Users
Older tools like JMeter historically simulated each virtual user with an operating-system thread. A thread is a unit of execution that the operating system schedules on a CPU core. The problem: threads are relatively expensive in memory (often 0.5–1 MB of stack space each) and in context-switching overhead. This means simulating, say, 50,000 concurrent virtual users with one thread each can itself exhaust the load generator’s own memory and CPU before it ever gets close to stressing the actual target system.
Newer tools like Gatling and k6 use an event-driven / asynchronous model, similar to how Node.js or Netty work. Instead of one OS thread per virtual user, a small pool of threads (often equal to the number of CPU cores) handles many thousands of virtual users cooperatively, using non-blocking I/O. When a virtual user is “waiting” for a network response, it does not block a thread — it registers a callback and the thread moves on to serve other virtual users. This lets a single load-generator machine simulate far more concurrent users with far less overhead.
5.2 Distributed Load Generation
Even an efficient event-driven tool has limits on a single machine (CPU, network-card bandwidth, open file descriptors, socket count). To simulate truly massive load — say, hundreds of thousands of concurrent users — testing tools distribute the work across many load-generator machines, often in the cloud, all coordinated by a central controller and all reporting metrics back to one place. This is exactly the same “scale-out” principle used by the systems being tested.
5.3 How the Tool Decides “How Much Load” — The Load-Profile Engine
Internally, the tool runs a scheduler that decides, at each moment in time, how many virtual users should be active, based on the load profile you configured (ramp-up shape, steady-state duration, ramp-down). For a load test, this profile is usually a trapezoid: ramp up to target, hold steady, ramp down. For a stress test, it is a staircase or ramp that never plateaus — it keeps climbing (say, adding 100 more virtual users every 30 seconds) until you tell it to stop or until the system fails so badly the test cannot continue meaningfully.
5.4 A Minimal Java Example: Simulating Virtual Users with a Thread Pool
The snippet below is intentionally simplified, but it contains the real ingredients of every professional load-testing tool: a pool of concurrent workers acting as virtual users, latency measured per request, results aggregated, and percentiles calculated at the end. To turn this into a stress test, you would simply keep increasing virtualUsers in stages — 200, then 500, then 1000, then 2000 — and watch at which stage the error rate and p99 latency start climbing sharply.
import java.net.URI;
import java.net.http.HttpClient;
import java.net.http.HttpRequest;
import java.net.http.HttpResponse;
import java.util.concurrent.*;
import java.util.concurrent.atomic.*;

public class LoadTestEngine {

    // Records one request's outcome: latency in ms, and whether it succeeded.
    record RequestResult(long latencyMs, boolean success) {}

    public static void main(String[] args) throws InterruptedException {
        int virtualUsers    = 200;   // how many concurrent "users" to simulate
        int requestsPerUser = 20;    // each virtual user fires this many requests
        String targetUrl    = "https://example.com/api/products";

        ExecutorService pool = Executors.newFixedThreadPool(virtualUsers);
        ConcurrentLinkedQueue<RequestResult> results = new ConcurrentLinkedQueue<>();
        HttpClient client = HttpClient.newHttpClient();
        CountDownLatch latch = new CountDownLatch(virtualUsers);

        long testStart = System.nanoTime();

        for (int u = 0; u < virtualUsers; u++) {
            pool.submit(() -> {
                try {
                    for (int r = 0; r < requestsPerUser; r++) {
                        long start = System.nanoTime();
                        boolean ok;
                        try {
                            HttpRequest request = HttpRequest.newBuilder()
                                    .uri(URI.create(targetUrl))
                                    .timeout(java.time.Duration.ofSeconds(5))
                                    .GET()
                                    .build();
                            HttpResponse<String> response =
                                    client.send(request, HttpResponse.BodyHandlers.ofString());
                            ok = response.statusCode() < 400;
                        } catch (Exception e) {
                            ok = false; // timeout, connection refused, etc.
                        }
                        long latencyMs = (System.nanoTime() - start) / 1_000_000;
                        results.add(new RequestResult(latencyMs, ok));
                    }
                } finally {
                    latch.countDown();
                }
            });
        }

        latch.await();          // wait for all virtual users to finish
        pool.shutdown();

        double testDurationSec = (System.nanoTime() - testStart) / 1_000_000_000.0;
        printReport(results, testDurationSec);
    }

    private static void printReport(ConcurrentLinkedQueue<RequestResult> results, double durationSec) {
        long total  = results.size();
        long errors = results.stream().filter(r -> !r.success()).count();
        double throughput = total / durationSec;

        long[] latencies = results.stream().mapToLong(RequestResult::latencyMs).sorted().toArray();
        long p50 = percentile(latencies, 50);
        long p95 = percentile(latencies, 95);
        long p99 = percentile(latencies, 99);

        System.out.printf("Total requests : %d%n", total);
        System.out.printf("Errors         : %d (%.2f%%)%n", errors, 100.0 * errors / total);
        System.out.printf("Throughput     : %.2f req/sec%n", throughput);
        System.out.printf("Latency p50    : %d ms%n", p50);
        System.out.printf("Latency p95    : %d ms%n", p95);
        System.out.printf("Latency p99    : %d ms%n", p99);
    }

    private static long percentile(long[] sortedLatencies, int percentile) {
        int index = (int) Math.ceil(percentile / 100.0 * sortedLatencies.length) - 1;
        return sortedLatencies[Math.max(index, 0)];
    }
}Data Flow & Lifecycle
Both load testing and stress testing follow a similar overall lifecycle, but the mindset and stopping conditions at each stage differ. Let us walk through the phases.
6.1 Phase 1 — Planning
For load testing, planning means answering: what is our expected peak traffic? (Often derived from analytics: “last Black Friday we saw 5,000 concurrent users, we expect 20% growth this year, so plan for 6,000.”) For stress testing, planning means deciding the ceiling to test toward, and — critically — deciding where to run it. Stress tests that intentionally break a system should almost never be run against production without very strong safety nets (feature flags, isolated environments, rate limiters that can be disabled quickly).
6.2 Phase 2 — Scripting
Engineers write or record the scenario: the sequence of actions a virtual user performs. Good scripts mimic real user behaviour, including “think time” — the pause between actions, like a human reading a page before clicking — because zero-think-time hammer scripts produce artificially extreme concurrency that does not represent real traffic.

6.3 Phase 3 — Ramp-up
Virtual users are gradually introduced. For a load test, ramp-up typically ends once you reach your target concurrency, which is then held steady (“steady-state”) for enough time to get stable measurements. For a stress test, ramp-up does not really end — it keeps escalating in stages.
6.4 Phase 4 — Execution / Steady-state or Escalation
In a load test, this is where you collect the bulk of your measurements — throughput, latency percentiles, error rate — under the sustained expected load. In a stress test, this is where you watch for the first signs of degradation: rising p99 latency, rising error rate, resource exhaustion (CPU pegged at 100%, memory climbing toward the limit, connection pools exhausted).
6.5 Phase 5 — Ramp-down / Recovery Observation
For load tests, ramp-down just confirms the system returns to a quiet baseline cleanly. For stress tests, this phase is arguably as important as the escalation itself: after you stop hammering the system, does it recover on its own, or does it stay unhealthy (a “long-tail failure” where connections remain exhausted, caches remain cold, or the process needs a manual restart)?
6.6 Phase 6 — Analysis & Reporting
Data is aggregated into percentiles, graphs, and error breakdowns. For load tests, the key question is: did we meet our Service Level Objectives (SLOs) — e.g., “p95 latency under 300 ms at 5,000 concurrent users”? For stress tests, the key question is: what was the breaking point, what broke first (the database? the app server? a downstream dependency?), and did the failure mode look like graceful degradation or a catastrophic crash?
6.7 Phase 7 — Remediation & Retest
Bottlenecks found are fixed — maybe a missing database index, a connection pool that was sized too small, a lack of caching — and the test is run again to confirm improvement. This loop (test → find bottleneck → fix → retest) is the actual value-generating cycle of performance testing; the first test run is rarely the last one.
Advantages, Disadvantages & Trade-offs
Every test type has strengths and blind spots. Choosing the right one, or the right blend, is a judgment call informed by risk, budget, and how mature the team’s observability already is.
7.1 Load Testing
| Advantages | Disadvantages / Limitations |
|---|---|
|
|
7.2 Stress Testing
| Advantages | Disadvantages / Limitations |
|---|---|
|
|
Load testing trades comprehensiveness for safety and speed. Stress testing trades safety and speed for deeper insight into worst-case behaviour. Mature engineering organisations do both, on a schedule, rather than picking one and hoping the other never matters.
Performance & Scalability
The whole point of both test types is to reason about performance and scalability, so let us go one level deeper into what “good performance” actually means and how scalability is measured.
8.1 The Throughput vs. Latency Curve
As you add more concurrent users, throughput typically rises, plateaus, and then falls, while latency stays flat for a while and then rises sharply. The point where latency starts rising sharply while throughput plateaus is the system’s saturation point — exactly what stress testing is designed to find.
8.2 Vertical vs. Horizontal Scalability
Vertical scaling means making a single machine more powerful (more CPU cores, more RAM). Horizontal scaling means adding more machines and distributing load across them (using a load balancer). Load and stress testing both feed directly into scalability decisions: if a stress test shows the database is the first thing to fall over, you might scale it vertically (bigger instance) or consider read replicas / sharding (horizontal). If the stress test shows the application servers fall over first while the database is fine, adding more application-server instances behind the load balancer (horizontal scaling) is the natural fix.
8.3 Amdahl’s Law — A Useful Mental Model
Amdahl’s Law says that the speed-up you get from adding more parallel resources is limited by the portion of the work that cannot be parallelised. In practical terms: if your checkout process spends 80% of its time in parallelisable work (handling independent requests) but 20% of its time contending for a single shared resource (like one database write lock), then no matter how many application servers you add, that 20% eventually becomes your bottleneck. Stress testing is often how teams discover exactly which 20% that is.
8.4 Capacity Planning
Load testing tells you “we are fine at our expected peak of 5,000 users.” Stress testing tells you “but we start failing at 9,000, and it gets ugly past 11,000.” Combined, these numbers feed capacity planning: how much headroom do we actually have, and when do we need to invest in scaling before we hit that ceiling for real?
High Availability & Reliability
High Availability (HA) refers to designing systems that stay up and serving traffic even when individual components fail. Load and stress testing are two of the main tools engineers use to validate HA claims rather than just trust the architecture diagram.
9.1 Does the System Fail Gracefully or Catastrophically?
This is the single most important question a stress test answers. A well-designed system, when pushed past capacity, should exhibit graceful degradation: it might start rejecting some requests with a clear “please retry later” (HTTP 503) response, shed lower-priority work, or slow down predictably — while continuing to serve the requests it can handle. A poorly designed system might instead exhibit cascading failure: one overwhelmed component causes timeouts in the services calling it, those timeouts pile up and exhaust connection pools in the callers, and the failure spreads outward until the whole system is down — even the parts that individually had spare capacity.
9.2 Patterns That Improve HA Under Stress
- Circuit breakers: after a downstream service starts failing repeatedly, the caller “opens the circuit” and stops sending it requests for a while, giving it time to recover instead of piling on more load.
- Bulkheads: isolating resources (thread pools, connection pools) per dependency so that one overwhelmed dependency cannot exhaust resources needed by unrelated parts of the system — named after the watertight compartments in a ship’s hull.
- Rate limiting & throttling: deliberately rejecting excess requests before they can overwhelm internal resources.
- Backpressure: signalling upstream callers to slow down rather than silently queueing unlimited work.
- Auto-scaling: automatically adding more instances when load crosses a threshold — but auto-scaling has a ramp-up delay, and stress testing is exactly how you discover whether that delay is short enough to matter.
Stress testing is the only reliable way to verify these mechanisms actually work as designed, rather than just existing on paper. Many teams discover, only under real stress testing, that their circuit breaker’s timeout was misconfigured, or that their “isolated” bulkheads actually shared an underlying connection pool.

Security Angle
Load and stress testing sit right next to an important security concept: Denial of Service (DoS). A DoS attack is when someone deliberately overwhelms a system with traffic (or malformed / expensive requests) so that legitimate users cannot be served. This is, in a sense, an unauthorised and malicious stress test performed by an attacker instead of your own team.
Stress testing is a controlled, authorised, and safety-netted process you run on your own systems to learn their limits. A DoS attack is the same underlying idea (overwhelming a system’s capacity) performed by an adversary, without consent, specifically to cause harm. Understanding your stress-test results is one of your best defences against real DoS attacks, because you already know your breaking points and can put safeguards (rate limiting, CDNs, Web Application Firewalls) in place before an attacker finds them for you.
10.1 What Stress Testing Teaches You About Security
- Resource-exhaustion vectors: stress tests often reveal which specific operation is cheapest for an attacker to abuse — e.g., an unauthenticated “search” endpoint that triggers an expensive, unindexed database query is a much easier DoS target than a well-cached homepage.
- Rate-limiting validation: if you have rate limiting in place, a stress test is exactly how you confirm it actually kicks in at the threshold you configured, rather than just assuming it does.
- Graceful degradation as a security property: a system that degrades gracefully under extreme load is inherently more resistant to accidental traffic spikes AND to unsophisticated DoS attempts, because it sheds load instead of falling over entirely.
It is worth noting: neither load nor stress testing, as covered in this article, are a substitute for dedicated security testing or penetration testing, which examine deliberate exploitation of vulnerabilities rather than sheer traffic volume. They are complementary disciplines — you need both.
Monitoring, Logging & Metrics
A load or stress test without proper monitoring is nearly useless — you would know the front door slammed shut, but not why. Good performance testing always pairs the test tool’s own metrics (from the load generator’s point of view) with deep observability into the system under test itself.
11.1 The Four Categories of Metrics to Watch
| Category | Examples | Why it matters |
|---|---|---|
| Client-side (from the test tool) | Throughput, latency percentiles, error rate | What the “user” actually experienced |
| Application-level | Request queue length, thread-pool utilisation, GC pause times, active DB connections | Where inside the app work is piling up |
| Infrastructure-level | CPU %, memory %, disk I/O, network bandwidth | Whether you are hitting a hardware ceiling |
| Dependency-level | Database query latency, cache hit rate, downstream API latency | Whether the bottleneck is actually somewhere else entirely |
11.2 The USE Method and the RED Method
Two popular mental frameworks help structure what to monitor:
- USE (Utilisation, Saturation, Errors): for every resource (CPU, memory, disk, network, thread pool), ask: how utilised is it, is it saturated (queue building up), and is it producing errors?
- RED (Rate, Errors, Duration): for every service, ask: what is the request rate, what is the error rate, and what is the duration (latency) of requests?
11.3 Why Real-Time Dashboards Matter During the Test Itself
For stress testing especially, you want to watch metrics live, not just after the test finishes, because you often need to make a judgement call about when to stop the test (e.g., the moment error rates cross an unacceptable threshold, or the moment you see signs the system might not recover on its own). Tools like Grafana, paired with Prometheus for metrics collection, are extremely common in this role, alongside the load-testing tool’s own built-in reporting (JMeter’s dashboard report, Gatling’s HTML report, k6’s cloud output, etc.).
11.4 Logging Considerations
Under heavy load, logging itself can become a bottleneck if done carelessly — synchronous, unbuffered logging to disk can add latency to every single request and, in extreme cases, become the actual cause of the system slowing down (rather than a neutral observer of it). This is why production systems favour asynchronous, buffered logging, and why during stress tests specifically, engineers watch whether the logging pipeline itself is falling behind or dropping log lines under pressure.
Deployment & Cloud
Where you run your load or stress tests, and where the system under test lives, matters enormously for how trustworthy the results are. Ignoring environment realism is the single most common way a load test lies to you.
12.1 Environment Parity
The golden rule: your test environment should be as close to production as realistically possible — same instance types, same database size and indexes, same network topology, same caching configuration. A load test run against a tiny staging environment with a nearly-empty database will produce numbers that are, at best, misleading, and at worst, dangerously optimistic.
12.2 Cloud-Based Distributed Load Generation
Because generating truly massive load from a single machine (or even a single location) is impractical, modern load-testing platforms (like k6 Cloud, Gatling Enterprise, BlazeMeter, or custom setups using AWS / GCP / Azure instances) spin up load-generator instances across multiple geographic regions. This serves two purposes: it distributes the raw compute needed to generate huge load, and it also simulates realistic geographic distribution of real users (someone in Tokyo experiences different network latency than someone in Ohio).
12.3 Testing in Production (“TiP”) — With Safety Nets
Some organisations, especially those with mature observability and feature-flagging, deliberately run controlled load tests against production during low-traffic windows, using synthetic traffic that is clearly tagged and easily filtered out of real analytics, with the ability to instantly kill the test. This is higher-risk but gives the most realistic possible results, since staging environments can never perfectly replicate production’s real data volume, real network conditions, and real caching behaviour. Stress testing directly in production is considerably riskier still and is usually reserved for organisations with strong chaos-engineering practices (see below) and robust rollback mechanisms.
12.4 CI/CD Integration
Modern practice increasingly bakes lightweight load tests directly into CI/CD pipelines — for example, running a scaled-down load test automatically against every pull request that touches a performance-sensitive service, failing the build if p95 latency regresses beyond a threshold. Full-scale stress tests are typically run less frequently (weekly, before major releases, or before predictable high-traffic events) because of their cost and risk, rather than on every commit.
APIs & Microservices
In a monolithic application, load testing is comparatively simple: you point traffic at one system and watch it. Microservices architectures make this considerably more interesting, because a single user-facing request might fan out into calls across a dozen independent services, each with its own capacity limits, and each potentially owned by a different team.
13.1 The Fan-out Problem
Consider an e-commerce “product page” API. Loading one page might call a product-catalogue service, a pricing service, an inventory service, a recommendations service, and a reviews service — all in parallel or in sequence. Under normal load, all five might comfortably keep up. Under stress, if the recommendations service (perhaps the least critical, but also the least optimised) becomes the bottleneck, and the product-catalogue service is configured to wait indefinitely for it, the entire page can become slow or fail — even though the actually important data (price, availability) was ready instantly. This is why timeout configuration and graceful fallback (“just hide the recommendations section if it is slow, do not block the whole page”) are directly informed by stress-testing findings.
13.2 Testing Individual Services vs. Testing End-to-End
Mature teams do both:

- Service-level (component) load / stress testing: testing one microservice in isolation, often with its dependencies mocked or stubbed, to find that specific service’s own capacity limits.
- End-to-end (system-level) load / stress testing: testing the full user journey across all real services, to find emergent bottlenecks and cascading failure patterns that only appear when everything is wired together for real.
13.3 API-Specific Considerations
When load / stress testing APIs specifically (REST, GraphQL, gRPC), a few extra dimensions matter beyond a typical webpage test:
- Authentication overhead: generating and validating auth tokens (JWTs, OAuth) for thousands of virtual users adds real load of its own; tests need to account for this rather than testing with a single shared, cached token that does not represent reality.
- Payload size variation: a GraphQL API in particular can let a single request request wildly different amounts of data — testing should include both “cheap” and “expensive” query shapes.
- Connection reuse: whether virtual users reuse HTTP connections (keep-alive) or open new ones per request drastically changes the load profile on the server’s connection-handling layer; tests should mimic how real client libraries actually behave.
- Rate-limit headers and back-off: well-behaved API clients respect rate-limit response headers and back off; test scripts should simulate this rather than hammering blindly — unless the specific goal is to test the rate limiter itself.
Design Patterns & Anti-patterns
A short list of the habits that consistently make performance tests trustworthy — and the mirror-image mistakes that turn them into false confidence at best, or dangerous confidence at worst.
14.1 Good Patterns
- Baseline-first testing: always run a load test with a single virtual user first, to get a clean latency baseline before adding concurrency — this separates “the code is just slow” problems from “the code does not handle concurrency well” problems.
- Incremental staircase load (for stress tests): increasing load in clear, well-labelled stages (e.g., 1k, 2k, 4k, 8k users) rather than one smooth ramp, makes it much easier to correlate exactly which load level triggered which symptom.
- Realistic think-time and user-behaviour modelling: real users pause, read, and make mistakes. Scripts that fire requests back-to-back with zero pauses create artificially extreme concurrency that does not represent real traffic (unless that is specifically the point, e.g., simulating a bot attack).
- Isolate the system under test: run tests in an environment where you control (and can hold constant) all the variables, so that a result change can be attributed to your code change and not, say, a noisy neighbour on shared cloud infrastructure.
- Automatic test-data cleanup: especially for stress tests that create thousands of fake orders / accounts, having automated teardown prevents test data from polluting production-like environments or skewing future test results.
14.2 Anti-patterns
- Testing with unrealistic data: running a load test against an empty or tiny database, then being surprised when production (with millions of rows and different query plans) behaves completely differently.
- Ignoring “think time”: simulating 1,000 virtual users all firing requests with zero delay is not the same as 1,000 real users — it often represents far more aggressive concurrency than reality, producing overly pessimistic (or simply wrong) results.
- Only testing the “happy path”: real traffic includes failed logins, retried payments, malformed requests, and abandoned carts. Testing only the smoothest possible user journey misses realistic load patterns.
- Running stress tests against shared production infrastructure without warning anyone: this can trigger real pages for on-call engineers, real customer-facing outages, and real financial transactions (if payment systems are not properly sandboxed) — a classic, career-limiting mistake.
- Trusting a single test run: performance results, especially near a system’s breaking point, can be noisy. A one-off stress test result should be treated as a hypothesis, not a fact, until reproduced.
- Confusing “the load generator is maxed out” with “the system under test is maxed out”: if your test client machine’s own CPU or network is saturated, you are measuring the limits of your test tool, not your actual system. Always monitor the load generator itself, not just the target.
Best Practices & Common Mistakes
A tighter, more prescriptive playbook — the stuff you can pin above your desk and check against every quarter. Doing these consistently prevents more incidents than any single clever architectural choice ever will.
15.1 Best Practices
- Define clear, measurable goals before testing. “Fast enough” is not a goal. “p95 latency under 250 ms at 5,000 concurrent users, with error rate under 0.1%” is a goal.
- Test early and often, not just before launch. Performance regressions are far cheaper to fix when caught in a small pull request than when discovered the week before a major launch.
- Match test data volume to production reality. Query performance, index effectiveness, and cache hit rates all change dramatically with data volume.
- Warm up caches before measuring steady-state. A cold cache produces artificially slow initial results that do not represent normal operation.
- Always monitor the load generator’s own resource usage, so you know whether you are measuring the target system or your own test tooling.
- Communicate before running stress tests near production, including notifying on-call teams and, where relevant, customer-facing teams.
- Automate performance testing into CI/CD for lightweight load checks, reserving full stress tests for scheduled, deliberate exercises.
- Document and share results widely, including the breaking point found in stress tests, so capacity-planning and on-call teams know what to expect during real traffic spikes.
15.2 Common Mistakes
- Averaging instead of using percentiles — hiding the painful tail latency experienced by a meaningful fraction of real users.
- Testing a different environment configuration than production (different instance sizes, different feature flags, different cache warm state).
- Stopping analysis at “it broke at X users” without digging into why — was it CPU, memory, a specific slow query, a connection pool limit, a downstream dependency?
- Not testing failure recovery, only the escalation phase — leaving teams unaware that the system does not self-heal after an overload event ends.
- Treating a single test run as gospel rather than running multiple times to confirm consistency, especially results near the breaking point, which can be noisy.
- Neglecting geographic / network realism by always testing from a load generator sitting right next to the system under test, when real users are scattered globally with real network latency.
Real-World / Industry Examples
Theory becomes concrete when you see how the biggest companies in the world actually apply it. The examples below range from “chaos-engineering-first” culture to the most public reminders of what happens when a launch skips load testing entirely.
Netflix
Netflix is widely known for pioneering chaos engineering with tools historically associated with their “Simian Army” concept, deliberately injecting failures and load into production-like environments to verify their systems degrade gracefully rather than cascading into outages, especially important given how much traffic they serve during peak evening hours and big releases.
Amazon
Amazon’s retail platform is famously built around the assumption that any individual service will fail or slow down under load at some point, and the architecture (heavy use of caching, circuit breakers, and independent, loosely-coupled services) is specifically designed so a slow “recommendations” widget never takes down checkout. Their annual events like Prime Day and Black Friday are preceded by extensive, deliberate load and stress testing against expected (and beyond-expected) traffic multiples.
Uber
Uber’s architecture involves an enormous number of interdependent microservices (dispatch, pricing, mapping, payments) that must all perform well simultaneously, especially during high-demand events (concerts letting out, New Year’s Eve). Uber has publicly discussed extensive load testing of their dispatch systems to ensure driver matching remains fast even during massive coordinated demand spikes.
Google’s Site Reliability Engineering (SRE) discipline, which Google itself popularised and documented extensively, treats load testing and capacity planning as continuous, ongoing practices tied directly to SLOs (Service Level Objectives) and error budgets, rather than one-off pre-launch checks. Their internal load-testing infrastructure is deeply integrated with automated capacity planning across their global data centres.
16.1 A Cautionary Public Example: Government Website Launches
Several high-profile government service launches around the world (health-insurance marketplaces, tax-filing portals, benefit-application sites) have suffered severe, publicly visible outages on their very first day, in situations widely attributed afterward to insufficient load testing against realistic Day-1 traffic volumes. These incidents are frequently cited in the industry precisely because they illustrate, in the most public way possible, the real-world cost of skipping this discipline.
The organisations that publicly avoid these outages are precisely the ones that treat load and stress testing not as a pre-launch checkbox but as a continuous, budgeted discipline — with dashboards, on-call rotations and post-mortems all wired into the same feedback loop. The ones that make headlines for outages are almost always the ones where testing was the first item cut when timelines got tight.
FAQ
Short answers to the questions that come up in almost every performance-testing kick-off meeting, in nearly every architecture-review interview, and in most incident retros where the phrase “we never load-tested that” ends up written down.
Is stress testing just a more extreme version of load testing?
In terms of mechanics (tooling, virtual users, scripts), yes — they often use the exact same tools and scripts. The difference is intent and load profile: load testing targets your expected / peak-expected traffic to validate performance goals, while stress testing deliberately exceeds that traffic to find the breaking point and observe failure behaviour.
Do I need both load testing and stress testing, or is one enough?
Most mature engineering teams do both, because they answer different questions. Load testing alone cannot tell you if you are one unexpected traffic spike away from a cascading outage. Stress testing alone does not confirm you are meeting your everyday performance goals.
How is spike testing different from stress testing?
Spike testing simulates a sudden, short burst of traffic (like a flash sale opening or a link going viral), then a return to normal — testing how quickly the system reacts and recovers from a sharp, brief surge. Stress testing is usually a sustained, gradual (or staged) climb well past expected capacity, focused on finding the absolute breaking point rather than reaction speed to a brief burst.
What tools are commonly used for load and stress testing?
Popular open-source options include Apache JMeter, Gatling, k6, and Locust. Commercial / cloud platforms include BlazeMeter, LoadRunner, and Gatling Enterprise. The same tool is typically used for both load and stress testing — you simply configure a different load profile.
Can I run stress tests directly on production?
It is possible but higher-risk, and generally only recommended for organisations with mature observability, feature flags, rapid rollback capability, and clear communication with on-call and customer-facing teams. Most teams run stress tests in a production-like staging environment instead, reserving true production testing for controlled, well-announced exercises.
What is a good breaking point to aim for?
There is no universal number — it depends entirely on your expected peak traffic and desired safety margin. A common rule of thumb some teams use is to aim for at least 2–3× expected peak traffic as headroom before the system shows serious degradation, but the right multiple depends on your traffic’s unpredictability (a ticket-sale site with wildly spiky demand needs a bigger safety margin than a stable internal enterprise tool).
Does passing a load test guarantee good production performance?
No. A load test is only as good as how closely its environment, data volume, and scenario scripts mirror real production conditions. Passing a load test against a small, cache-warmed staging environment with idealised “happy path” scripts does not guarantee the same result against real production data, real network conditions, and the messier variety of real user behaviour.
Summary & Key Takeaways
If you carry only a handful of ideas away from this guide, make it these. They are the sentences most likely to come back and help you in an interview room, in a design review, or at 3 a.m. during a live incident.
Key Takeaways
- Load testing validates the expected. It simulates realistic, anticipated traffic to confirm the system meets its performance goals (throughput, latency, error rate) under normal and peak-expected conditions.
- Stress testing discovers the unexpected. It deliberately pushes traffic beyond expected capacity to find the system’s true breaking point and observe whether it fails gracefully or catastrophically.
- They share the same underlying architecture — virtual users, a load generator, the system under test, and a metrics / reporting layer — differing mainly in the load profile applied and the questions being asked.
- Percentiles (p95, p99) matter far more than averages, because averages hide the painful tail latency experienced by a meaningful slice of real users.
- Modern event-driven testing tools (Gatling, k6) can simulate vastly more concurrent virtual users per machine than older thread-per-user tools (classic JMeter), by using non-blocking I/O.
- Microservices architectures add a fan-out dimension: a single user request can depend on many independent services, each with its own limits, and stress testing is how cascading-failure risks between them are uncovered.
- Resilience patterns — circuit breakers, bulkheads, rate limiting, backpressure — are only proven to work through real stress testing, not just by existing in an architecture diagram.
- Stress testing and Denial-of-Service attacks are conceptually related — one is authorised self-discovery, the other is malicious and unauthorised — and understanding your own breaking points is a genuine security asset.
- Environment parity is everything. Tests run against unrealistic data volumes, cold caches, or mismatched infrastructure produce misleading confidence in either direction.
- Both disciplines are continuous practices, not one-time pre-launch checklists — mature organisations bake lightweight load checks into CI/CD and run periodic, deliberate stress tests ahead of predictable high-traffic events.
Load testing tells you that the bridge holds up under the traffic you promised your city planner. Stress testing tells you where the bridge actually cracks — and whether it gives you a warning groan first, or collapses without one. Every serious engineering organisation eventually needs answers to both questions. Once you understand the shared architecture underneath them, running either one is mostly a matter of choosing the right load profile and paying close attention to what the numbers are telling you.

