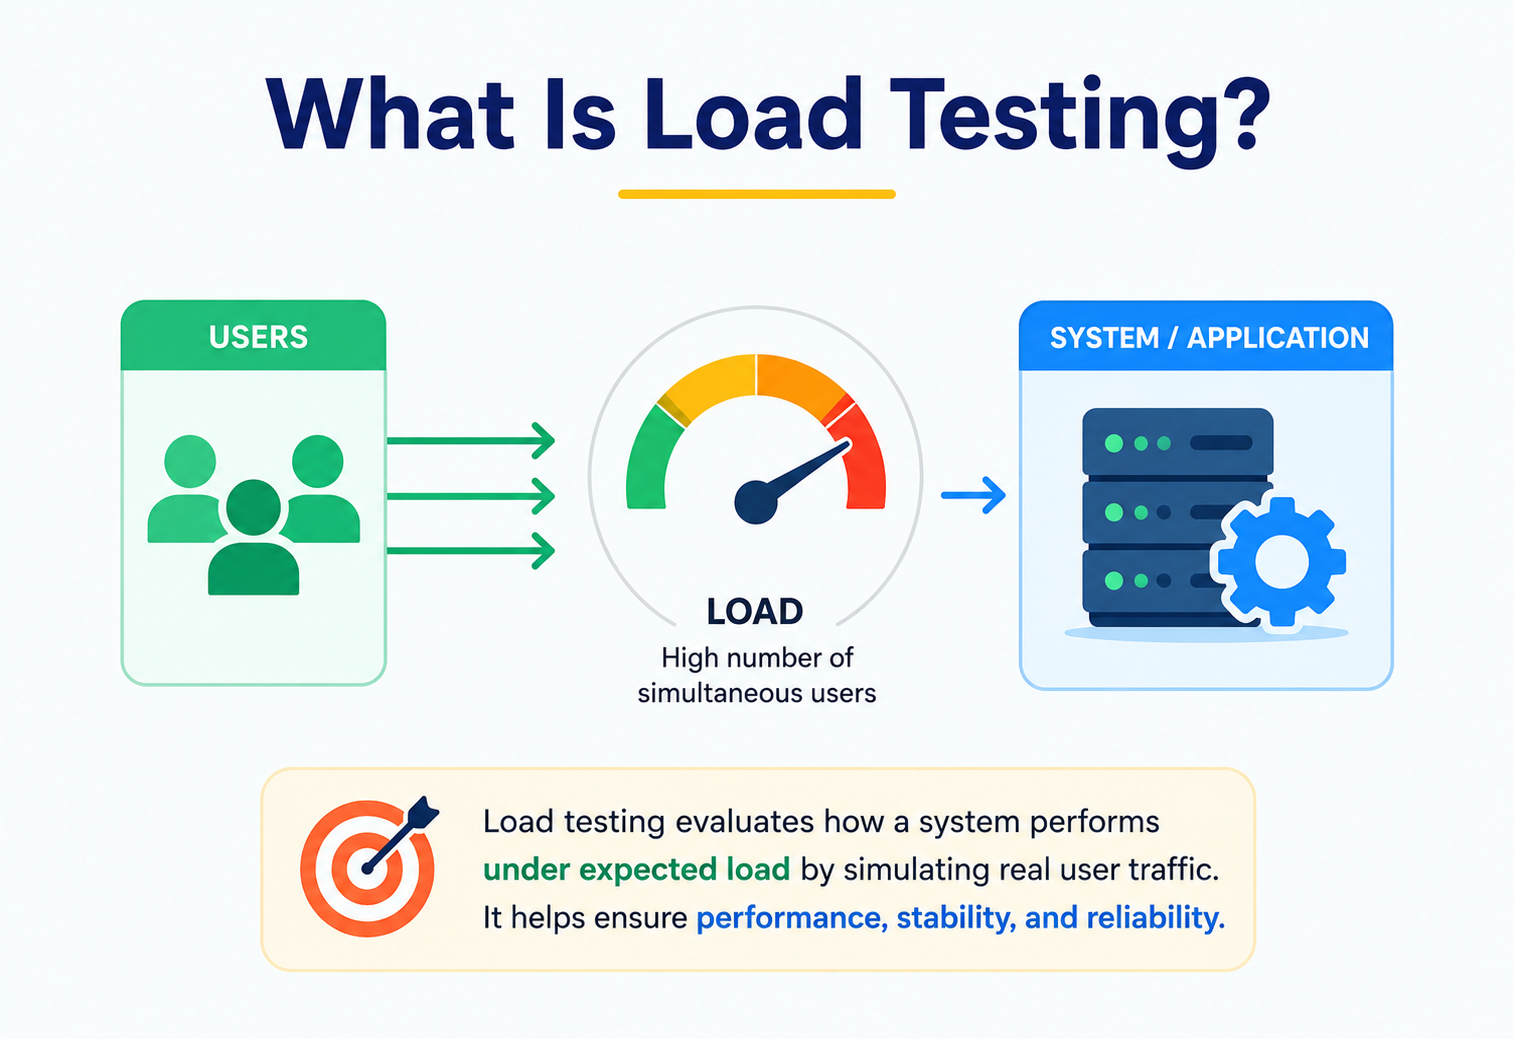
What Is Load Testing?
Why we do it, how it works internally, and how the world’s biggest systems use it to survive Black Friday, World Cup finals, and viral moments — explained from first principles with analogies, diagrams, and real code.
What Is Load Testing?
Imagine a small backyard bridge that easily holds you alone. What happens when 500 people cross it at once during a village fair — does it bend, creak, or collapse? Load testing is how you answer that question for software before real users find out the hard way.
Imagine you built a small bridge over a stream in your backyard. It easily holds your weight when you walk across it. But what happens when 500 people try to cross it at once during a village fair? Does it bend? Does it creak? Does it collapse? You would never find out just by walking across it alone — you would need to test it under a crowd. That, in one sentence, is what load testing is for software: finding out how a system behaves when many people use it at the same time, before real users discover the answer the hard way.
Load testing is the process of simulating real-world usage — many users, many requests, many transactions — against a software system to observe how it performs under that pressure. It answers questions like: “Can our website handle 10,000 people checking out at once?”, “How many orders per second can our payment service process before it slows down?”, and “At what point does our database start choking?”
1.1 A Short History
In the earliest days of computing (1960s–1980s), software mostly ran on single mainframes serving a known, limited number of terminals. Capacity planning was simple: you knew exactly how many terminals were plugged in, so you could size the mainframe accordingly. There wasn’t much need for “load testing” as we know it today because the audience was fixed and small.
Everything changed with the rise of the internet in the 1990s. Suddenly, a website could be visited by 10 people or 10 million people, and nobody could predict which in advance. The dot-com era brought famous public failures — websites crashing during product launches, ticket sales, and news events — because nobody had tested what would happen when thousands of people arrived within the same minute. This gave birth to a whole discipline of performance engineering, and tools like Mercury LoadRunner (1990s), and later open-source tools like Apache JMeter (1998) and Gatling (2011), were built specifically to simulate large numbers of virtual users hitting a system.
Today, in the era of cloud computing, microservices, and global scale (Netflix, Amazon, Uber, Google), load testing has evolved from a “nice to check before launch” activity into a continuous, automated part of the software delivery pipeline — often called performance engineering as code or continuous load testing.

1960s–1980s — Mainframe Era
Fixed number of terminals feeding a single mainframe. Capacity planning was manual and largely deterministic — no unpredictable public traffic to simulate.
1990s — Rise of the Internet
Public failures during peak traffic. Mercury LoadRunner is introduced, formally kicking off the load-testing tool market.
1998–2011 — Open-Source Era
Apache JMeter (1998) makes load testing accessible to every team; Gatling (2011) introduces a modern, high-concurrency async engine.
2010s — Cloud Computing
Elastic infrastructure means load testing can spin up thousands of virtual generators on-demand from multiple regions worldwide.
2020s — DevOps & CI/CD
Continuous performance testing embedded in the delivery pipeline. Load tests run automatically on every meaningful code change.
Think of a restaurant that has only ever served 10 customers a night comfortably. One day, a food blogger writes a glowing review, and 200 people show up on Saturday night. If the restaurant never tested “what if 200 people show up at once,” the kitchen runs out of ingredients, the one waiter gets overwhelmed, and customers wait two hours for food. Load testing is the practice of simulating that Saturday-night rush before it actually happens, so the restaurant can prepare more staff, more stock, and a better process.
The Problem & Motivation
Software that works perfectly for one user can fail catastrophically for a thousand — not because the code has a “bug” in the traditional sense, but because of how it behaves under concurrency and resource contention.
Why do we even need load testing? Because software that works perfectly for one user can fail catastrophically for a thousand users — not because the code has a “bug” in the traditional sense, but because of how it behaves under concurrency (many things happening at once) and resource contention (multiple users fighting over the same limited resources like CPU, memory, database connections, or network bandwidth).
2.1 The Core Problem
When you test an application manually by clicking around it, you are testing functional correctness — does the “Add to Cart” button add the item to the cart? Load testing asks a completely different question: does the “Add to Cart” button still work correctly and quickly when 50,000 people click it in the same second?
Without load testing, teams discover their system’s real capacity limits during a real event — a product launch, a holiday sale, a viral social media post, or a major sporting event — which is exactly the worst possible time to find out. This has real financial and reputational cost. A retailer that crashes on Black Friday can lose millions of dollars in sales within minutes, and the negative press and lost customer trust can last much longer than the outage itself.
Imagine a simple to-do list app you built for yourself. It works instantly when you add a task. Now imagine 1,000 people try to use your to-do list app on the same server at the same time. Suddenly, adding a task takes 8 seconds instead of instantly, and sometimes it fails entirely. The code didn’t change — but the load did, and that changed everything.
2.2 Why Functional Testing Isn’t Enough
| Aspect | Functional Testing | Load Testing |
|---|---|---|
| Question asked | Does it work? | Does it work fast and reliably under many users? |
| Number of users simulated | 1 (the tester) | Hundreds to millions |
| Focus | Correctness of logic | Speed, stability, resource usage |
| Typical tools | JUnit, Selenium | JMeter, Gatling, k6, Locust |
| Failure symptom | Wrong output | Slow response, timeouts, crashes |
2.3 Business Motivation
- Revenue protection: E-commerce sites lose direct sales every second they are slow or down during peak events.
- Reputation: Users rarely forgive an app that crashes during an important moment (e.g., a ticket-booking app crashing during a concert sale).
- Cost efficiency: Load testing tells you exactly how much server capacity you actually need — so you don’t overpay for unused infrastructure “just in case,” nor underpay and risk an outage.
- Regulatory and SLA compliance: Many businesses sign Service Level Agreements (SLAs) promising a certain response time or uptime; load testing verifies you can actually meet those promises.
Before the 2014 FIFA World Cup, streaming platforms load-tested their video delivery systems by simulating millions of concurrent viewers watching the same live match, because a real-world failure during a global final would have been front-page news everywhere.
Core Concepts & Vocabulary
Every term below is explained in plain English, with an analogy and an example — because these words will be used constantly for the rest of the guide.
3.1 Virtual User (VU)
What: A “virtual user” is a simulated person or program that behaves like a real user — it sends requests (like loading a page, or submitting a form) to your system.
Why: We can’t hire 10,000 real people to click on a website at the exact same moment for a test. Instead, load testing tools generate software “robots” that mimic real user actions at scale.
Think of virtual users as cardboard cutouts of people that a load testing tool “drives” through your website exactly like a real visitor would — clicking, typing, and waiting, just automated and multiplied by the thousands.
3.2 Throughput
What: Throughput is the number of requests (or transactions) a system successfully processes per unit of time, usually measured as requests per second (RPS) or transactions per second (TPS).
Throughput is like how many cars per minute can pass through a highway toll booth. A busy toll booth might handle 30 cars/minute; a jammed one might handle only 5.
3.3 Latency & Response Time
What: Latency (often used interchangeably with response time) is the time it takes for the system to respond to a single request, usually measured in milliseconds (ms).
If throughput is “how many cars pass per minute,” latency is “how long it takes one specific car to get from the toll gate to being waved through.”
3.4 Concurrency
What: Concurrency is the number of users or requests being actively processed by the system at the same instant.
A cashier can only ring up one customer at a time, but a supermarket with 10 cashiers can serve 10 customers concurrently.
3.5 Ramp-up and Ramp-down
What: Ramp-up is the gradual increase of virtual users over time (instead of throwing all users at the system instantly). Ramp-down is the gradual decrease at the end of a test.
A test might ramp up from 0 to 1,000 users over 5 minutes, hold steady at 1,000 users for 20 minutes, then ramp down to 0 over 5 minutes — mimicking how a real crowd builds up and disperses rather than appearing all at once.
3.6 Think Time
What: Think time is the pause a simulated user takes between actions, mimicking the natural delay of a human reading a page or deciding what to click next. Without think time, virtual users would fire requests unrealistically fast — and the results would badly overstate real-world load.
3.7 Percentiles (p50, p90, p99)
What: A percentile tells you the response time below which a given percentage of requests fall. p99 = 500ms means 99% of requests were faster than 500ms, and only 1% were slower.
If 100 runners finish a race, the “p90 finish time” is the time by which 90 of them have crossed the finish line — ignoring the slowest 10 stragglers. Averages can hide those stragglers; percentiles reveal them.
An average response time of 200ms can hide the fact that 1% of your users are waiting 10 full seconds. In production, engineers care deeply about p95 and p99 because those “tail” users are often your most valuable or most vocal customers.
3.8 Types of Performance Testing (the Load Testing Family)
| Type | What It Checks | Analogy |
|---|---|---|
| Load Testing | Behavior under expected normal-to-peak load | Testing the bridge with the number of people it was designed for |
| Stress Testing | Behavior beyond normal capacity, until it breaks | Adding people to the bridge until it actually collapses, to learn its true limit |
| Spike Testing | Sudden, sharp increase in traffic | A flash mob suddenly rushing onto the bridge |
| Soak / Endurance Testing | Sustained load over a long period (hours/days) | Leaving normal daily traffic on the bridge for a full month to see if it wears out slowly |
| Scalability Testing | How performance changes as you add more resources | Adding a second bridge lane and seeing if traffic truly doubles |
| Volume Testing | Behavior with large volumes of data (not necessarily users) | Testing the bridge’s foundation with a huge pile of stored cargo, not moving people |
Load Testing
Expected traffic. Verifies the system meets its stated performance targets under normal-to-peak conditions.
Stress Testing
Beyond normal traffic. Deliberately pushes until things break, to discover the true breaking point.
Spike Testing
Sudden bursts. Simulates a viral moment or an announcement-driven wave of users arriving in seconds.
Soak Testing
Time under load. Catches slow-burn issues like memory leaks or connection pool leaks that only appear over hours.
Scalability Testing
Adds capacity and re-measures. Answers “does doubling servers actually double throughput?”
Volume Testing
Data at scale. Verifies the system copes with very large datasets, even without unusually high user counts.
Architecture & Components
A load-testing setup is itself a small distributed system — a controller, a fleet of load generators, the system under test, and a monitoring layer, all working in coordinated tempo.
4.1 Test Controller / Master Node
What: The brain of the operation — it reads the test plan/script, decides how many virtual users to create, coordinates the timing (ramp-up, steady state, ramp-down), and collects results from all load generators.

4.2 Load Generators (Workers/Agents)
What: These are the machines (or containers) that actually generate the traffic. A single machine can typically simulate only so many virtual users before running out of CPU, memory, or network sockets — so for very large tests, multiple load generator machines work together, each contributing a slice of the total virtual users.
If the controller is a stadium’s event manager coordinating a flash mob, the load generators are the individual mob “captains,” each bringing their own group of 100 people to descend on the target at the right moment.
4.3 System Under Test (SUT)
What: The actual application, service, or API being tested. This includes everything behind it — the application servers, databases, caches, load balancers, and third-party integrations.
4.4 Test Scripts / Scenarios
What: Scripts describe exactly what each virtual user does — e.g., “log in, browse 3 products, add one to cart, checkout” — along with think time between steps and data variation (different usernames, product IDs, etc.) so the test doesn’t just hammer the exact same request repeatedly (which would be unrealistic and might get cached, hiding real performance).
4.5 Monitoring & Metrics Collector
What: A separate system (like Prometheus, Grafana, Datadog, or New Relic) that watches the System Under Test’s internal health — CPU usage, memory, garbage collection pauses, database query times, thread pool saturation — while the load test runs, so engineers can correlate “traffic went up” with “database CPU spiked” and pinpoint bottlenecks.
4.6 Reporting Layer
What: Aggregates results (response times, error rates, throughput) into readable reports and dashboards — usually with graphs showing response time vs. time, error rate vs. time, and throughput vs. time.
Controller
Reads the plan; schedules ramp-up, steady state, and ramp-down; collates results from every generator.
Load Generators
Actually produce traffic. Multiple machines/containers cooperate for very high concurrency tests.
System Under Test
The real app, plus everything behind it: servers, DBs, caches, load balancers, third-party APIs.
Test Scripts
What each virtual user does, with realistic variation in data and pacing between actions.
Monitoring
Prometheus/Grafana/Datadog watching the SUT’s internal metrics during the run.
Reporting
Aggregates response time, throughput, and error rate into human-readable dashboards and reports.
Internal Working — How “10,000 Users” Are Faked
Real humans use browsers, but load-testing tools don’t open 10,000 browser windows. They simulate the network-level effect of many users at protocol level, using either thread pools or event loops to hold thousands of virtual users on a single machine.
Let’s go one level deeper: how does a load testing tool actually generate “10,000 concurrent users” from a handful of physical machines? Real humans use browsers, but load testing tools don’t literally open 10,000 browser windows (that would be far too resource-heavy). Instead, they simulate the network-level effect of many users.
5.1 Protocol-Level Simulation
Most load testing tools work at the protocol level (HTTP, HTTPS, WebSocket, gRPC, JDBC, etc.) rather than the browser level. Instead of rendering a webpage with images, CSS, and JavaScript like a real browser, the tool directly sends the same HTTP requests a browser would send, and reads the raw responses. This is dramatically lighter on memory and CPU, allowing one machine to simulate thousands of “users” by managing thousands of lightweight threads or event-loop connections rather than thousands of full browser instances.
5.2 Threads vs. Event Loops
There are two dominant internal models for how a load generator creates concurrency:
- Thread-per-user model (e.g., classic JMeter): Each virtual user is backed by an operating system thread. Simple to reason about, but threads are relatively heavy (each consumes memory for its stack), so this model runs out of steam at high concurrency (tens of thousands of users) on a single machine.
- Event-loop / async model (e.g., Gatling, k6): A small number of threads handle many virtual users using non-blocking I/O — when a virtual user is “waiting” for a network response, the thread is freed to serve other virtual users in the meantime. This allows a single machine to simulate far more concurrent users with the same hardware.
Thread-Per-User Model
- One OS thread per virtual user — conceptually simple
- Blocking code is easy to write and read
- Ceiling: threads are memory-heavy; tens of thousands of them exhaust a single machine
- Classic JMeter’s original engine works this way
Event-Loop / Async Model
- Small pool of threads, many virtual users multiplexed over non-blocking I/O
- Freed to serve other VUs while any one waits for a response
- Can simulate hundreds of thousands of users per machine
- Gatling and k6 are canonical examples of this design
5.3 A Minimal Java Load Generator (Simplified)
To understand internal working concretely, let’s build a very small, simplified load generator in Java that simulates concurrent virtual users hitting an endpoint using a thread pool, and measures response times. This is a teaching example — real tools like JMeter and Gatling are far more sophisticated (with ramp-up curves, assertions, correlation, and distributed coordination), but the core idea is the same.
import java.net.http.HttpClient;
import java.net.http.HttpRequest;
import java.net.http.HttpResponse;
import java.net.URI;
import java.util.concurrent.*;
import java.util.concurrent.atomic.AtomicLong;
import java.util.List;
import java.util.ArrayList;

public class SimpleLoadGenerator {

    // Number of virtual users (concurrent threads) to simulate
    static final int VIRTUAL_USERS = 100;
    // Number of requests each virtual user will send
    static final int REQUESTS_PER_USER = 20;
    // Target URL under test
    static final String TARGET_URL = "https://example.com/api/products";

    public static void main(String[] args) throws InterruptedException {
        HttpClient client = HttpClient.newHttpClient();

        // Thread pool simulates concurrent virtual users
        ExecutorService executor = Executors.newFixedThreadPool(VIRTUAL_USERS);

        // Thread-safe counters for aggregate metrics
        AtomicLong totalRequests = new AtomicLong();
        AtomicLong totalErrors = new AtomicLong();
        AtomicLong totalLatencyMs = new AtomicLong();

        List<Future<?>> futures = new ArrayList<>();

        for (int user = 0; user < VIRTUAL_USERS; user++) {
            futures.add(executor.submit(() -> {
                for (int i = 0; i < REQUESTS_PER_USER; i++) {
                    long start = System.currentTimeMillis();
                    try {
                        HttpRequest request = HttpRequest.newBuilder()
                                .uri(URI.create(TARGET_URL))
                                .GET()
                                .build();
                        HttpResponse<String> response =
                                client.send(request, HttpResponse.BodyHandlers.ofString());

                        long latency = System.currentTimeMillis() - start;
                        totalLatencyMs.addAndGet(latency);
                        totalRequests.incrementAndGet();

                        if (response.statusCode() >= 400) {
                            totalErrors.incrementAndGet();
                        }
                    } catch (Exception e) {
                        totalErrors.incrementAndGet();
                    }
                    // "Think time" - simulate a real user pausing between actions
                    try { Thread.sleep(200); } catch (InterruptedException ignored) {}
                }
            }));
        }

        // Wait for all virtual users to finish
        for (Future<?> f : futures) {
            try { f.get(); } catch (ExecutionException ignored) {}
        }
        executor.shutdown();

        // Print aggregate report
        long total = totalRequests.get();
        double avgLatency = total == 0 ? 0 : (double) totalLatencyMs.get() / total;
        double errorRate = total == 0 ? 0 : (100.0 * totalErrors.get() / total);

        System.out.println("Total requests sent : " + total);
        System.out.println("Average latency (ms): " + avgLatency);
        System.out.println("Error rate (%)       : " + errorRate);
    }
}
What this code does, in plain English: It creates a pool of 100 “worker threads,” each acting as one virtual user. Each virtual user sends 20 requests to the target URL, waits 200ms between requests (simulating think time), and records how long each request took and whether it failed. At the end, it prints simple aggregate metrics — total requests, average latency, and error rate. This is the conceptual seed from which industrial load testing tools grow, adding features like ramp-up scheduling, percentile calculations, distributed load generators, and rich reporting dashboards.
5.4 How Percentiles Are Actually Calculated Internally
Internally, tools record every response’s latency into a data structure (often a sorted array, a histogram, or an approximation algorithm like t-digest or HdrHistogram for very high-volume tests, since storing millions of raw numbers in memory would be wasteful). To find p99, the tool effectively sorts all recorded latencies and picks the value at the 99th percentile position.
import java.util.Arrays;

public class PercentileCalculator {
    public static double percentile(long[] latenciesMs, double percentile) {
        long[] sorted = latenciesMs.clone();
        Arrays.sort(sorted);
        int index = (int) Math.ceil((percentile / 100.0) * sorted.length) - 1;
        index = Math.max(0, Math.min(index, sorted.length - 1));
        return sorted[index];
    }

    public static void main(String[] args) {
        long[] samples = {120, 135, 98, 400, 150, 110, 5000, 145, 130, 125};
        System.out.println("p50: " + percentile(samples, 50));
        System.out.println("p90: " + percentile(samples, 90));
        System.out.println("p99: " + percentile(samples, 99));
    }
}
Notice how the single outlier of 5000ms barely affects p50 (median) but heavily influences p90 and p99 — this is exactly why percentiles are so valuable: they reveal the experience of the unluckiest users, which averages hide.
Data Flow & Lifecycle of a Load Test
A single test moves through six stages — planning, scripting, execution, monitoring, analysis, and action — and each stage feeds the next. Most teams run this loop repeatedly, not just once.
6.1 Stage 1: Planning
Engineers define the goal (e.g., “Verify the checkout API can handle 2,000 orders/minute with p99 < 800ms”), identify realistic user scenarios, and decide on data (test accounts, product catalogs) that mimics production without touching real customer data.
6.2 Stage 2: Scripting
Engineers translate scenarios into executable scripts — sequences of HTTP calls, form submissions, or API calls, with parameterized data and realistic think time between actions.

6.3 Stage 3: Execution
The test controller schedules virtual users according to the ramp-up plan. Traffic flows from load generators to the system under test, passing through the same load balancers, gateways, and services real users would hit.
6.4 Stage 4: Monitoring
While the test runs, engineers (or automated systems) watch dashboards showing response times, throughput, error rates, and backend resource usage in real time, so they can stop early if something goes badly wrong (a “kill switch” to avoid damaging a shared staging environment).
6.5 Stage 5: Analysis
After the test completes, engineers examine graphs to find the point where response time or error rate started degrading — this is often called the breaking point or knee point — and correlate it with backend metrics (e.g., “response time spiked exactly when database connection pool hit 100% utilization”).
6.6 Stage 6: Reporting & Action
Findings are documented, bottlenecks are fixed (code optimization, added caching, more servers, database indexing), and the test is re-run to confirm improvement — this loop repeats until the system meets its performance goals.
Planning
Set the goal in numbers: users, throughput, response time, error rate. Ambiguous goals produce ambiguous results.
Scripting
Encode realistic user journeys with parameterized data and think time between actions.
Execution
Controller schedules VUs; traffic hits the SUT via the same real path as production users.
Monitoring
Live dashboards watch response times, throughput, errors, and backend resource pressure. Kill switch ready.
Analysis
Find the knee point; correlate it with backend metrics to pinpoint the specific bottleneck.
Reporting & Action
Fix the bottleneck — more caching, better indexes, more servers — then re-run to verify. Repeat.
Advantages, Disadvantages & Trade-offs
Load testing costs money and time, can never perfectly replicate reality, and can even become dangerous if misused — but the alternative is finding your limits live, in front of real customers.
7.1 Advantages
- Prevents costly outages by catching capacity limits before real users do.
- Informs capacity planning — tells you exactly how many servers, database replicas, or cache nodes you need for expected traffic.
- Validates architecture decisions — proves (or disproves) that a new caching layer or database sharding strategy actually improves performance.
- Builds confidence before major events (product launches, marketing campaigns, holiday sales).
- Surfaces hidden bugs that only appear under concurrency, such as race conditions or connection pool leaks.
7.2 Disadvantages & Limitations
- Cost and complexity: Running large-scale load tests, especially against production-like environments, can itself be expensive (cloud compute costs for generating millions of requests).
- Never a perfect replica of reality: Simulated user behavior is always an approximation; real users are unpredictable in ways scripts can’t fully capture.
- Risk to shared environments: A poorly controlled load test against a staging environment shared by other teams can disrupt their work, or if accidentally pointed at production, could cause a real outage.
- Maintenance burden: Test scripts need to be updated whenever the application’s flows change, or they become stale and misleading.
- False confidence: Passing a load test doesn’t guarantee production safety if the test didn’t account for a real-world factor (e.g., third-party API slowness, or a marketing email blast driving unusually clustered traffic).
Advantages
- Prevents multi-million-dollar peak-event outages
- Right-sizes infrastructure spend
- Validates caching, sharding, and scaling choices with real numbers
- Uncovers concurrency-only bugs (races, pool leaks) before production
- Builds shared team confidence before major launches
Costs & Limitations
- Non-trivial engineering + cloud spend
- Can never perfectly reproduce real users’ randomness
- Poorly aimed tests can disrupt shared environments
- Scripts rot as the app changes — ongoing maintenance
- Passing does not guarantee immunity in production
7.3 Trade-off Table
| Decision | Option A | Option B | Trade-off |
|---|---|---|---|
| Test environment | Dedicated performance environment | Production (with safeguards) | Dedicated env is safer but may not match production exactly; production testing is realistic but riskier |
| Load generation location | On-premises hardware | Cloud-based generators | On-prem gives control; cloud gives elasticity and geographic distribution but costs money per test |
| Test frequency | Occasional (before major releases) | Continuous (every deploy) | Occasional is cheaper but misses regressions; continuous catches regressions early but needs automation investment |
Performance & Scalability
Load tests exist to find bottlenecks. Little’s Law tells you what to expect; the “knee point” tells you when to stop. Beyond that point, the system doesn’t just get slower — it can actively get worse.
8.1 Vertical vs. Horizontal Scaling
When a load test reveals a bottleneck, teams generally scale in one of two ways:
- Vertical scaling (scale up): Give the existing server more CPU, memory, or faster disks. Simple, but has a ceiling — eventually you run out of bigger machines to buy, and a single machine remains a single point of failure.
- Horizontal scaling (scale out): Add more machines/instances and distribute load across them (typically via a load balancer). This is how most modern large-scale systems (Netflix, Amazon) scale, because it has no hard ceiling and improves fault tolerance.
Vertical scaling is like replacing one small cash register with a giant one that scans items faster. Horizontal scaling is like opening five more checkout lanes so multiple customers are served simultaneously.
8.2 Little’s Law
A foundational formula in performance engineering, Little’s Law, states:
L = λ × W

L = average number of concurrent requests in the system
λ = average arrival rate (requests per second)
W = average time a request spends in the system (response time)
This means if your system currently handles 100 requests/sec with an average response time of 0.5 seconds, on average there are 50 requests “in flight” inside the system at any given moment. Load testing lets you measure λ and W directly, and Little’s Law helps predict how increasing λ (more traffic) will affect L (how much concurrent work your system needs to juggle) — which drives decisions about thread pool sizes, connection pool sizes, and server counts.
8.3 Identifying Bottlenecks
During a load test, as concurrency increases, response times typically follow this pattern:
The goal of performance engineers is to find the “knee point” — the load level right before performance starts degrading sharply — and either push that point higher (through optimization/scaling) or ensure production traffic never exceeds it (through rate limiting, autoscaling, or queueing).
8.4 Common Bottleneck Sources
| Bottleneck | Symptom Under Load | Typical Fix |
|---|---|---|
| Database connection pool exhaustion | Requests queue up waiting for a free DB connection | Increase pool size, add read replicas, add caching |
| Thread pool exhaustion | Requests queue up in the application server | Tune thread pool size, use async/non-blocking I/O |
| Garbage collection pauses (Java/JVM) | Periodic latency spikes (“GC pauses”) | Tune JVM heap/GC settings, reduce object churn |
| Slow third-party API calls | Requests hang waiting on an external dependency | Add timeouts, circuit breakers, caching, async calls |
| Insufficient network bandwidth | Increased latency and packet loss at high throughput | Upgrade network capacity, use CDN for static assets |
High Availability & Reliability
Load testing isn’t just about speed — it’s a key tool for validating reliability under stress. Systems that appear healthy under light load can reveal fragile failure modes only when pushed hard.
9.1 Testing Failover Under Load
A mature load testing practice includes chaos-style tests combined with load: while thousands of virtual users hit the system, engineers intentionally kill a server instance or a database replica to verify the system fails over gracefully (traffic reroutes to healthy instances) without dropping requests or corrupting data.
9.2 Graceful Degradation
What: Graceful degradation means that when a system is overloaded, instead of crashing entirely, it sheds lower-priority work while continuing to serve critical functions.
During extreme traffic, an e-commerce site might disable personalized recommendations (a “nice to have”) while keeping checkout (a “must have”) fully functional. Load testing at extreme scale is how teams discover and validate that this kind of prioritization actually works.
9.3 Redundancy Validation
Load tests confirm that redundant components (multiple app servers, database replicas, multiple availability zones) actually share load as designed, rather than one component silently taking all the traffic while others sit idle — a subtle bug that only load reveals.
Failover Under Load
Kill an instance mid-test. A healthy system reroutes without dropped requests. Load tests verify this on purpose.
Graceful Degradation
Shed optional work (recommendations, previews) to protect the critical path (checkout, payments) at peak.
Redundancy Validation
Prove every replica actually takes its share of traffic — silent hot spots hide behind “green” health checks.
Cascading-Failure Guardrails
Circuit breakers, timeouts, and bulkheads exercised at load to prove they trip early enough to protect callers.
Security
A load test in the wrong hands can look identical to a denial-of-service attack. Testing must always be authorized, controlled, and used to validate the very defenses that separate legitimate spikes from abuse.

10.1 Load Testing and Denial-of-Service Awareness
Load testing tools, in the wrong hands or misconfigured, can effectively behave like a self-inflicted Denial-of-Service (DoS) attack. Because of this, load tests must always be run with explicit authorization, from controlled IP ranges, and ideally against non-production or clearly designated performance environments — never against a third party’s system without written permission (doing so may be illegal in many jurisdictions).
10.2 Rate Limiting and Throttling Validation
What: Rate limiting restricts how many requests a single client (or overall system) can make in a time window, to protect backend resources from being overwhelmed — whether by legitimate traffic spikes or malicious actors.
Load testing is exactly how teams validate that rate limiting rules work as intended: does the system correctly reject the 1,001st request per minute from a single client with a clean “429 Too Many Requests” response, rather than crashing?
// A minimal token-bucket rate limiter in Java, the kind of logic
// load tests are used to validate under real concurrency
import java.util.concurrent.atomic.AtomicInteger;
import java.util.concurrent.ScheduledExecutorService;
import java.util.concurrent.Executors;
import java.util.concurrent.TimeUnit;

public class TokenBucketRateLimiter {
    private final int capacity;
    private final AtomicInteger tokens;

    public TokenBucketRateLimiter(int capacity, int refillPerSecond) {
        this.capacity = capacity;
        this.tokens = new AtomicInteger(capacity);
        ScheduledExecutorService scheduler = Executors.newScheduledThreadPool(1);
        scheduler.scheduleAtFixedRate(() -> {
            tokens.updateAndGet(t -> Math.min(capacity, t + refillPerSecond));
        }, 1, 1, TimeUnit.SECONDS);
    }

    // Returns true if the request is allowed, false if it should be rejected (429)
    public boolean tryAcquire() {
        int current;
        do {
            current = tokens.get();
            if (current <= 0) return false;
        } while (!tokens.compareAndSet(current, current - 1));
        return true;
    }
}
10.3 Data Privacy During Testing
Test scripts should use synthetic or anonymized data rather than real customer information, and test environments should have the same access controls as production to avoid accidentally exposing sensitive data through logs or dashboards generated during the test.
10.4 Credential and Secrets Handling
Load testing tools often need API keys or authentication tokens to simulate logged-in users; these must be stored securely (secrets managers, environment variables) rather than hardcoded into scripts that might be committed to source control.
Never point a load test at a system you do not own or do not have written permission to test. What looks to you like a “test” can look to the target — and to law enforcement — like an attack.
Monitoring, Logging & Metrics
Metrics tell you what’s happening. Logs tell you why. Traces tell you where. The real magic of monitoring during a load test is correlation — matching a latency spike to the exact backend resource that ran out of headroom.
11.1 The Three Pillars During a Load Test
- Metrics: Numeric time-series data — CPU%, memory usage, request rate, error rate, response time percentiles. Tools: Prometheus, Grafana, Datadog, CloudWatch.
- Logs: Detailed event records that help explain why an error occurred (e.g., a stack trace for a failed request). Tools: ELK stack (Elasticsearch, Logstash, Kibana), Splunk.
- Traces: End-to-end records of a single request’s journey across multiple microservices, showing exactly which downstream service added the most latency. Tools: Jaeger, Zipkin, OpenTelemetry.
11.2 Key Metrics to Watch During a Load Test
| Metric | What It Tells You |
|---|---|
| Response time (p50/p90/p99) | Speed experienced by typical and worst-case users |
| Throughput (RPS/TPS) | How much work the system is completing per second |
| Error rate | Percentage of requests failing (timeouts, 5xx errors) |
| CPU utilization | Whether compute is the bottleneck |
| Memory usage / GC pauses | Whether memory pressure is causing slowdowns |
| Database query latency | Whether the database is the bottleneck |
| Connection pool utilization | Whether requests are queueing for limited connections |
11.3 Correlating Load Test Results with System Metrics
The real value of monitoring during load tests comes from correlation: seeing that response time degraded at exactly 8:42 AM, and cross-referencing that timestamp with backend dashboards to discover the database CPU hit 100% at 8:41 AM — one minute before customers started noticing slowness. This turns “the app got slow” into a precise, actionable finding: “the database needs a read replica or better indexing.”
Deployment & Cloud
Modern load testing runs from the cloud, across regions, and inside CI/CD. Every meaningful code change gets a lightweight performance check — and no engineer manually spins up a test rig anymore.
12.1 Where Load Tests Run
- Dedicated performance environment: A copy of production infrastructure used solely for performance testing, isolated so tests don’t interfere with real users.
- Cloud-based, on-demand environments: Spun up just for the duration of the test using Infrastructure as Code (Terraform, CloudFormation), then torn down afterward to save cost.
- Production testing (careful, controlled): Some companies (notably large e-commerce and streaming platforms) run controlled load tests directly in production during low-traffic hours, because only production has the exact scale, configuration, and data patterns of real usage.
12.2 Cloud-Native Load Generation
Cloud providers let teams spin up dozens of load generator instances across multiple geographic regions, simulating realistic global traffic patterns (e.g., testing how requests from Asia, Europe, and North America simultaneously affect a globally distributed application) — something that would be very hard to replicate with on-premises hardware in a single data center.
12.3 Load Testing in CI/CD Pipelines
Modern teams embed lightweight load tests into their continuous integration/continuous deployment pipelines — automatically running a smaller-scale load test against every significant code change, so performance regressions are caught within minutes of being introduced, rather than weeks later during a dedicated pre-release testing phase.
Code Commit
Developer pushes to Git; the change triggers the pipeline.
Build & Unit Tests
Static checks and unit tests must pass before the pipeline proceeds.
Deploy to Staging
The candidate build is deployed to an isolated performance-capable environment.
Automated Load Test
A short scripted load test runs with defined pass/fail thresholds (e.g., p95 < 500ms, error < 0.1%).
Pass or Block
Pass: deploy to production. Fail: block deployment and page the responsible team automatically.
Databases, Caching & Load Balancing
Application servers are easy to add. Databases are hard. Load testing very often ends with one conclusion: the DB is the bottleneck, and the fix is more caching, more replicas, or smarter sharding.
13.1 Why Databases Are Often the First Bottleneck
Application servers are usually easy to scale horizontally (just add more instances), but databases are harder — especially relational databases that guarantee strong consistency, since multiple writers coordinating on the same data introduce contention. Load testing very often reveals that the database, not the application code, is the true limiting factor.
13.2 Caching as a Load Testing Discovery
What: Caching stores frequently requested data in fast memory (like Redis or Memcached) so repeated requests don’t need to hit the slower database every time.
A cache is like keeping the ten most popular library books at the front desk instead of walking to the back shelves every time someone asks for them.
Load tests often show a dramatic before/after difference: without caching, throughput might plateau at 500 requests/sec with database CPU at 100%; with caching for read-heavy endpoints, throughput might jump to 5,000 requests/sec with database CPU barely used, because most reads are now served from memory.
13.3 Load Balancing
What: A load balancer distributes incoming requests across multiple backend servers so no single server is overwhelmed.
Load testing verifies that the load balancer’s distribution algorithm (round-robin, least-connections, or weighted) actually spreads traffic evenly, and that “sticky sessions” (routing a specific user always to the same server) don’t accidentally create hotspots on individual servers.
13.4 Database Read Replicas and Sharding
When a load test reveals the primary database as a bottleneck for read-heavy workloads, teams introduce read replicas (copies of the database that handle read queries, leaving the primary free for writes). For extremely large-scale systems, sharding (splitting data across multiple independent databases, each handling a subset of the data, e.g., by user ID range) allows near-linear scaling of both reads and writes — a technique load testing validates by simulating traffic that spans many shards simultaneously.
If a load test is throttled at low throughput and DB CPU sits at 100%, the answer is almost never “add more app servers.” It’s cache, replicate, index, or shard.
APIs & Microservices
In a microservices world, one slow service is enough to poison the whole chain. Load tests have to exercise realistic call graphs — not just individual endpoints in isolation.
14.1 Load Testing a Single API vs. an End-to-End Journey
Two common load testing strategies exist:
- Component-level (API) load testing: Hammering a single API endpoint in isolation to understand its individual capacity — useful for pinpointing exactly which service is the bottleneck.
- End-to-end (user journey) load testing: Simulating a full realistic flow (browse → add to cart → checkout → payment) across multiple microservices, which better represents real production behavior since services depend on each other.
14.2 The Microservices Challenge: Cascading Failures
In a microservices architecture, one slow downstream service under load can cause a domino effect: if Service A calls Service B, and B slows down under load, A’s threads/connections waiting on B get tied up, and A itself becomes slow or unresponsive to its own callers — even though A’s own code and infrastructure are perfectly healthy. This is why load testing must exercise realistic microservice call chains, not just individual services in isolation.
14.3 Circuit Breakers and Timeouts
What: A circuit breaker is a pattern that detects when a downstream service is failing or slow, and “trips” — temporarily stopping calls to it and returning a fast, predefined fallback response instead of letting requests pile up waiting.
// Simplified circuit breaker concept in Java
public class SimpleCircuitBreaker {
    private int failureCount = 0;
    private final int failureThreshold = 5;
    private boolean open = false;
    private long openedAt;
    private final long resetTimeoutMs = 10_000;

    public boolean allowRequest() {
        if (open && System.currentTimeMillis() - openedAt > resetTimeoutMs) {
            open = false; // try again after cool-down ("half-open" state)
            failureCount = 0;
        }
        return !open;
    }

    public void recordFailure() {
        failureCount++;
        if (failureCount >= failureThreshold) {
            open = true;
            openedAt = System.currentTimeMillis();
        }
    }

    public void recordSuccess() {
        failureCount = 0;
    }
}
Load testing is the primary way teams validate that circuit breakers actually trip at the right threshold, and that fallback responses keep the overall system usable even when one dependency is struggling.
14.4 API Gateways and Rate Limiting Under Load
API gateways sit in front of microservices and often enforce rate limits per client or API key. Load tests validate that the gateway correctly throttles excessive traffic from a single misbehaving client without impacting other well-behaved clients sharing the same infrastructure — a property sometimes called “noisy neighbor” isolation.
Design Patterns & Anti-patterns
Realistic ramp-up, varied data, baseline-then-compare, and shift-left — versus one static test user, no think time, and averages that lie.
15.1 Good Patterns
- Realistic ramp-up: Gradually increasing load rather than an instant “big bang” of all virtual users, matching how real traffic actually builds.
- Data parameterization: Using varied, realistic test data (different user IDs, product IDs) instead of the same static values, to avoid unrealistic caching effects that hide real performance.
- Baseline-then-compare: Always running a baseline test on the current version before testing a new change, so improvements or regressions can be measured precisely.
- Shift-left performance testing: Running smaller load tests early and often during development (in CI/CD), rather than only right before a big release.
- Production-like environments: Testing against infrastructure that mirrors production configuration (same instance types, same database size) as closely as possible.
15.2 Anti-patterns (Common Mistakes)
- Testing with a single, static test user/data: Everyone logging in as the same account or requesting the same product ID triggers unrealistic caching that hides true database load.
- Ignoring think time: Firing requests back-to-back without any pause, unrealistically compressing load far beyond what real users would generate.
- Only measuring averages: Reporting “average response time was 200ms” while ignoring that 5% of users experienced 8-second delays.
- Testing only the happy path: Never simulating errors, retries, or edge cases (like an expired session) under load, which are common in real traffic.
- One-time testing: Running a load test once before a big launch and never again, missing regressions introduced by later code changes.
- Testing in isolation from real dependencies: Mocking out all downstream services (payment gateway, third-party APIs) so completely that the test never reveals cascading failure risks.
Good Patterns
- Realistic ramp-up curves that mimic real traffic build
- Parameterized, varied test data
- Baseline first; compare against it
- Shift-left: small tests early and often
- Production-like environments and configurations
Anti-patterns
- One static test user — hides caching effects
- No think time — unrealistic compression
- Averages only — hide the tail
- Only the happy path tested
- “Run it once before launch, then never again”
- All dependencies mocked out — no cascade risk visible
Best Practices & Common Mistakes (Deeper Dive)
The disciplines that turn ad-hoc “let’s see what breaks” testing into a repeatable, evidence-based practice you can bet a launch on.
16.1 Define Clear, Measurable Goals Before Testing
Instead of a vague goal like “make sure it’s fast,” define specific, measurable Service Level Objectives (SLOs), such as: “p95 response time under 500ms at 5,000 concurrent users, with an error rate below 0.1%.” Clear goals make pass/fail decisions objective rather than subjective.
16.2 Test Early and Often (Shift-Left)
Waiting until the week before launch to run the first load test is a classic and costly mistake — by then, there’s little time to fix architectural bottlenecks. Modern practice runs smaller load tests continuously throughout development.
16.3 Isolate Variables
Change one thing at a time between test runs (e.g., only the caching configuration) so you can clearly attribute performance changes to a specific cause, rather than changing five things at once and guessing which one mattered.
16.4 Warm Up the System
Many systems perform poorly for the first few seconds/minutes after startup (JIT compilation warming up in Java, caches being cold, connection pools not yet established). A good load test includes a warm-up period before measurements begin, so results reflect steady-state performance, not startup artifacts.
16.5 Test at Realistic and Beyond-Realistic Scale
Test at expected peak load (to confirm you can handle it) and beyond expected peak (to know your true breaking point and have confidence in your safety margin).
16.6 Automate and Version-Control Test Scripts
Treat load test scripts like production code: store them in version control, review changes, and run them automatically as part of the deployment pipeline, rather than as ad-hoc manual scripts that live only on one engineer’s laptop.
16.7 Common Mistakes Recap Table
| Mistake | Consequence | Fix |
|---|---|---|
| No clear performance goals | Ambiguous pass/fail, wasted analysis time | Define explicit SLOs before testing |
| Testing too late | No time to fix discovered issues before launch | Shift testing earlier in development |
| Ignoring warm-up period | Misleading “cold start” results skew analysis | Discard or separate warm-up data from steady-state data |
| Unrealistic test data | Hidden database/cache bottlenecks | Use varied, production-like data |
Real-World Industry Examples
From Netflix pioneering chaos engineering to ticketing platforms surviving the “thundering herd” — concrete examples of what load testing at industrial scale actually looks like.

17.1 Netflix
Netflix pioneered “chaos engineering” combined with performance testing through tools like Chaos Monkey (which randomly terminates servers in production) and various load-testing practices, ensuring their streaming service can handle massive simultaneous viewership (e.g., a hit show’s release night) while remaining resilient to individual server failures. Their architecture assumes failure will happen under load and is designed to degrade gracefully — for instance, serving a slightly lower video bitrate rather than buffering entirely when regional infrastructure is under stress.
17.2 Amazon
Amazon is famous for extensive load testing ahead of major sales events like Prime Day and Black Friday, simulating traffic many times normal peak levels months in advance to validate that their systems — from product search to checkout to payment processing — can absorb the surge, and to fine-tune auto-scaling policies so new server capacity comes online automatically as real traffic climbs.
17.3 Google
Google’s Site Reliability Engineering (SRE) discipline, which they helped pioneer and popularize, treats load testing as an ongoing, continuous practice rather than a one-time event — using techniques like “load shedding” (deliberately rejecting some low-priority requests to protect overall system health) validated extensively through simulated load before being trusted in production.
17.4 Uber
Uber load-tests its dispatch and matching systems to handle massive, geographically concentrated spikes in demand — such as New Year’s Eve in a major city, or severe weather events, where ride requests can spike dramatically within minutes in specific regions, requiring the underlying matching algorithms and databases to be validated at extreme concurrency for specific geographic “hot zones.”
17.5 Ticketing Platforms
Ticketing systems for high-demand events (major concerts, sports finals) are some of the most extreme real-world load testing case studies, since traffic isn’t just high — it arrives in an extremely sharp, synchronized spike the instant tickets go on sale (sometimes called a “thundering herd”). These systems rely heavily on virtual waiting rooms, queueing mechanisms, and aggressive load testing at spike-level concurrency to avoid crashing in the first seconds of a sale.
Netflix
Chaos engineering + load. Degrades gracefully — e.g., lower bitrate — instead of buffering into failure.
Amazon
Simulates many times Prime Day traffic months in advance; tunes autoscaling before real customers arrive.
Continuous, automated load testing. Load-shedding tactics validated at test time before running in production.
Uber
Concentrated regional spikes (NYE, weather) stress the matching engine at the exact geography it will hurt most.
Ticketing Platforms
The classic “thundering herd” — virtual waiting rooms and spike testing keep the on-sale moment intact.
Frequently Asked Questions
Short, direct answers to the questions that come up most when teams start taking load testing seriously.
Q: Is load testing the same as performance testing?
A: Load testing is one type of performance testing. Performance testing is the broader umbrella that also includes stress testing, spike testing, soak testing, and scalability testing, each focused on a different angle of system behavior under demand.
Q: How many virtual users should I simulate?
A: Base it on real data — your actual peak traffic (from analytics or past incident data), plus a safety margin (commonly 1.5x–3x expected peak) to have confidence in headroom for growth or unexpected spikes.
Q: Can I load test in production?
A: Yes, many large companies do, but only with careful safeguards: running during low-traffic windows, having a “kill switch” to instantly stop the test, close monitoring, and clear communication with all teams who might be affected.
Q: What’s the difference between load testing and monitoring/observability?
A: Load testing proactively generates artificial traffic to discover limits before they’re hit; monitoring/observability passively watches real production traffic to detect issues as they happen. They’re complementary — load testing finds problems in a controlled setting, monitoring catches problems (including ones load testing missed) in the real world.
Q: Which tool should I use — JMeter, Gatling, k6, or Locust?
A: It depends on your team’s skills and needs: JMeter has a mature GUI and huge plugin ecosystem; Gatling offers high performance with a Scala-based DSL and detailed HTML reports; k6 is JavaScript-based and integrates well with modern CI/CD and cloud workflows; Locust uses Python and is very flexible for custom scenarios. All can achieve similar goals — the right choice often comes down to your team’s existing programming language expertise.
Q: How do I know if my load test results are trustworthy?
A: Trustworthy results come from realistic scenarios, varied test data, adequate warm-up, and a test environment that closely resembles production. If results seem “too good to be true” (e.g., zero performance degradation at extreme scale), suspect unrealistic test conditions like unintended caching effects.
Summary & Key Takeaways
Load testing is the fire drill for your software. You hope you never need it — but when the crowd shows up, you’ll be very glad you rehearsed for it.
Key Takeaways
- Load testing simulates real-world usage at scale to reveal how a system behaves under many concurrent users, before real users find out the hard way.
- Core concepts to remember: virtual users, throughput, latency, concurrency, ramp-up, think time, and percentiles (p50/p90/p99) — percentiles matter more than averages because they reveal the worst-case user experience.
- A load testing setup is itself a small distributed system: a controller, multiple load generators, the system under test, and a monitoring layer working together.
- Internally, load testing tools simulate concurrency using either thread-per-user or event-loop models, sending raw protocol-level requests (not full browser rendering) to stay lightweight at scale.
- The lifecycle of a load test moves through planning, scripting, execution, monitoring, analysis, and reporting/action — often as a repeating loop, not a one-time event.
- Load testing has real trade-offs: it costs money and time, can never perfectly replicate reality, and carries risk if run carelessly against shared or production environments.
- Bottlenecks commonly hide in databases, thread pools, garbage collection, and third-party dependencies — load testing combined with monitoring is how these are found and fixed.
- In microservices architectures, load testing must consider cascading failures across service chains, validated through patterns like circuit breakers, timeouts, and rate limiting.
- Industry leaders like Netflix, Amazon, Google, and Uber treat load testing as a continuous, automated discipline embedded into their engineering culture, not a pre-launch checkbox.
- Best practice: define clear performance goals, test early and often, use realistic data and think time, and always correlate load test results with backend system metrics to find true root causes.
Load testing is the fire drill for your software — you hope you never need the lessons it teaches in a real emergency, but when the real crowd shows up, you’ll be very glad you rehearsed for it.
19.1 A Simple Mental Checklist Before Any Load Test
If you take away nothing else from this guide, remember this short checklist the next time you plan a load test:
- Know your goal: Write down the exact numbers you are trying to prove (users, throughput, response time, error rate) before writing a single script.
- Know your baseline: Run a small, controlled test first so you have “before” numbers to compare against.
- Make it realistic: Vary your test data, include think time, and cover more than just the happy path.
- Watch the whole stack: Don’t just watch the load testing tool’s dashboard — watch CPU, memory, database, and downstream dependencies at the same time.
- Have a stop button: Know exactly how you will halt the test immediately if something starts going seriously wrong.
- Repeat regularly: Treat load testing as a habit tied to your release cycle, not a one-off event before a big launch.
19.2 Where to Go From Here
Once you’re comfortable with the concepts in this guide, the natural next steps are: picking one open-source tool (JMeter, Gatling, or k6 are excellent starting points) and running your very first small test against a sample application you control; learning to read flame graphs and profiler output to dig even deeper into why a component is slow once load testing tells you where the slowness is; and studying real post-incident reports (often called “postmortems”) published by large tech companies, since many of them describe exactly how a lack of load testing — or a load test that missed a specific scenario — contributed to a real outage. Reading how experienced teams reasoned through those failures is one of the fastest ways to deepen real-world performance engineering intuition beyond what any single guide can cover.

