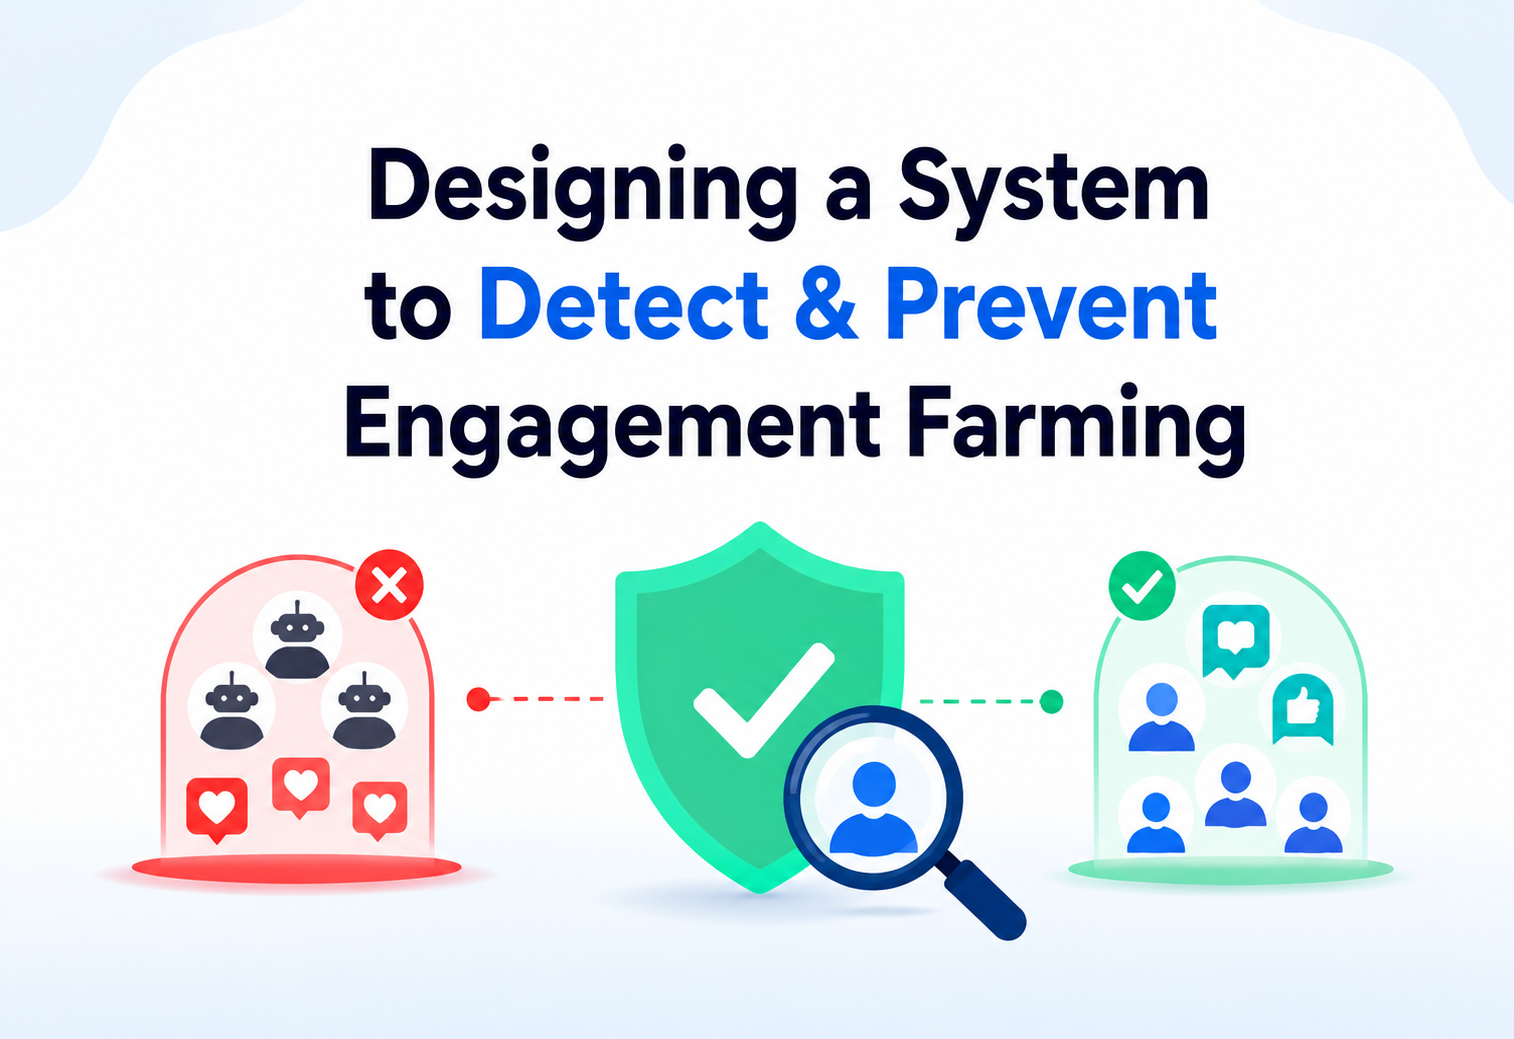
Designing a System to Detect & Prevent Engagement Farming at Platform Scale
A production-grade blueprint for identifying bait tactics, coordinated engagement pods, and bot-driven metric inflation at platform scale — architecture, algorithms, trade-offs, and the questions interviewers actually ask.
Introduction and History
Why “stop the fake likes” turns into one of the most interesting adversarial system design problems on the modern web.
Imagine a school talent show where the winner is decided purely by applause volume. Now imagine one kid bringing along fifty friends who clap wildly for him no matter what he does on stage, while other performers who genuinely earn the crowd’s excitement get drowned out. That, in essence, is engagement farming: artificially manufacturing likes, comments, shares, watch-time, or follows so that a piece of content or an account looks more popular than it actually is — not because people organically love it, but because someone gamed the applause meter.
An engagement farming detection and prevention system is the backstage security team for that talent show. It watches the applause meter itself, figures out which claps are real and which are staged, and quietly turns down the volume on the staged ones before they change who wins.
In the language of software architecture, this is a large-scale trust and safety system that sits alongside a social platform’s core product (the feed, the video player, the comments section) and continuously classifies every unit of “engagement” — a like, a comment, a share, a follow, a view, a click — as authentic, suspicious, or fraudulent, and then takes graduated action: nothing, silent demotion, friction (like a CAPTCHA), warning, or account-level enforcement.
1.1 Why This Problem Exists at All
Every major platform — Facebook, Instagram, X (formerly Twitter), YouTube, TikTok, LinkedIn, Reddit — uses engagement signals (likes, comments, shares, watch time, follows) as a primary input to two things: (1) the recommendation algorithm that decides what to show people, and (2) the currency that determines creator payouts, brand deals, ad rates, and influence. The moment engagement becomes currency, it becomes a target for manipulation — exactly like how a stock price becomes a target for pump-and-dump schemes the moment it determines real wealth.
1.2 A Short History of Engagement Manipulation
2007–2010 — The Early “Like Farms”
As Facebook Pages and early social ad products launched, “like farms” emerged — click-farm workers in low-wage regions paid pennies to like pages en masse. Detection was mostly manual and reactive.
2012–2015 — Bot Networks Go Industrial
Twitter follower markets exploded; automated bot accounts could be purchased in bulk. Platforms began building the first rule-based anti-spam classifiers (velocity checks, IP clustering).
2016–2018 — Coordinated Inauthentic Behavior (CIB)
Election-interference research (Stanford Internet Observatory, Facebook’s own transparency reports) formalised the term “Coordinated Inauthentic Behavior” — groups of accounts working together, often centrally directed, to manipulate public discourse and metrics simultaneously.
2019–2021 — Engagement Bait Policies
Facebook and Instagram explicitly penalised “engagement bait” posts (e.g., “COMMENT ‘YES’ if you agree, SHARE if you don’t”) through NLP-based content classifiers, not just account-level bot detection.
2022–Present — Graph-Native, Real-Time, GenAI-Aware Systems
Modern systems fuse graph neural networks (to catch coordinated clusters), real-time streaming ML (to catch farming within seconds of a post going live), and LLM-based content classifiers (to catch AI-generated bait text and AI-generated fake comments at scale).
Engagement farming detection is a fraud-detection problem wearing a social-media costume. The core techniques — anomaly detection, graph clustering, velocity checks, real-time scoring — are the same techniques a bank uses to catch credit card fraud. The difference is the “currency” being protected is attention, not money — though on ad-supported platforms, attention is money.
“How is engagement-farming detection different from generic spam or bot detection?” A good answer: spam/bot detection is largely account-centric (is this account fake?), while engagement farming detection must also be content-centric (is this specific post’s engagement inflated, even from otherwise real accounts?) and network-centric (are many accounts, real or fake, coordinating around this content?). A single farmed post can come from a completely legitimate account that just joined an engagement pod.
Problem and Motivation
Turning “stop fake engagement” from a mission statement into a concrete, testable specification.
Before designing any system, we need to be precise about what we are solving. “Stop fake engagement” is not a spec — it’s a mission statement. Let’s break it into concrete problems.
2.1 The Business Motivation
Protect the Feed
If farmed content ranks highly, the recommendation system learns the wrong signal, degrading relevance for everyone and creating a vicious cycle where farming becomes the dominant growth strategy.
Protect Ad Spend
Advertisers pay for reach and engagement. Inflated metrics mean advertisers are paying for eyeballs that don’t exist — a form of ad fraud that can trigger lawsuits and regulatory scrutiny (e.g., FTC actions).
Protect Payouts
On platforms with creator monetisation (YouTube Partner Program, TikTok Creator Fund, X’s ad-revenue share), farmed engagement directly steals real money from legitimate creators by diluting the payout pool or gaming eligibility thresholds.
Protect Public Discourse
Coordinated engagement networks are a primary vector for disinformation amplification, election interference, and manufactured consensus — a societal-scale trust problem, not just a metrics problem.
2.2 The Attack Taxonomy — What We’re Actually Detecting
Engagement farming isn’t one thing; it’s a family of tactics. A good system must model each of them, because they leave different fingerprints in the data.
| Tactic | Real-Life Analogy | Description | Primary Signal |
|---|---|---|---|
| Engagement Bait | A street performer shouting “clap if you love pizza!” | Content explicitly instructs users to like/comment/share/tag friends, regardless of genuine interest. | NLP / content classifier |
| Bot Networks | A warehouse of phones auto-tapping a screen | Fully automated fake accounts liking, following, or commenting at machine speed. | Behavioural velocity, device fingerprint |
| Click / Like Farms | A room of underpaid workers manually tapping “like” all day | Human-operated but incentivised accounts performing engagement for pay, often via task marketplaces. | IP / device clustering, session patterns |
| Engagement Pods / Reciprocity Rings | “You clap for my act, I’ll clap for yours” | Groups of real users (often via Telegram/Discord/WhatsApp groups) agreeing to mutually engage with each other’s content within minutes of posting. | Graph community detection, temporal correlation |
| Sybil Attacks | One puppeteer, many puppets | A single actor creates many fake identities to simulate a crowd of independent supporters. | Device / IP graph clustering, creation-time clustering |
| Watch-Time / View Fraud | Playing a song on repeat with no one listening | Bots or scripts that “watch” videos without real attention (autoplay loops, headless browsers). | Player telemetry anomalies, attention signals |
| Follow-for-Follow / Follow Trains | A pyramid scheme of mutual favours | Coordinated mass-following to inflate follower counts, often unfollowing afterward (“follow churn”). | Follow / unfollow velocity graphs |
A simple rule like “flag accounts that like more than 500 posts/hour” is trivially evaded by spreading activity across more accounts, adding randomised delays (jitter), or using residential proxy IPs to look geographically distributed. Real systems must combine many weak signals probabilistically rather than relying on one hard threshold — the same lesson fraud detection learned decades ago.
2.3 Functional Requirements
- Detect farmed engagement on a piece of content within seconds to minutes of it occurring (near real-time), not just in an offline nightly batch.
- Score both content (is this post’s engagement inflated?) and accounts (is this account part of a farming network?).
- Detect coordinated clusters of accounts acting together, even if each individual account looks “clean” in isolation.
- Support graduated enforcement: silent demotion, engagement discounting (not counting fake likes toward public counts), friction challenges, warnings, temporary restrictions, permanent bans.
- Provide an appeals and human-review workflow for edge cases and false positives.
- Expose explainability — why was this account/content flagged — for internal reviewers, and (in aggregate) for transparency reports.
2.4 Non-Functional Requirements
- Scale: billions of engagement events per day (a platform like Instagram or TikTok generates hundreds of thousands of likes/comments per second at peak).
- Latency: streaming detection path should score most events within 100 ms–2 s; deeper graph analysis can run in near-real-time batches (1–15 minutes).
- Low false-positive rate: wrongly penalising real users/creators is a serious trust and revenue problem — precision matters as much as recall.
- Adversarial robustness: the system must assume attackers actively study and adapt to its rules (an arms race, not a static classification task).
- Auditability & explainability: for legal, regulatory (DSA in the EU, FTC in the US), and appeals purposes.
- Global scale & multi-language support: bait content and coordination happen in every language and region.
“How would you define success metrics for this system?” Strong answers go beyond “accuracy” and discuss: precision/recall on labelled farming incidents, false-positive rate on verified legitimate creators, time-to-detection (TTD) for new farming campaigns, percentage of platform-wide engagement estimated to be inauthentic (a north-star trust metric), and downstream impact on recommendation quality (e.g., session duration, user-reported feed quality surveys).
Core Concepts
Shared vocabulary. Every later section refers back to these building blocks.
3.1 Authenticity Score vs Binary Classification
What: Instead of a yes/no “is this fake” label, production systems compute a continuous authenticity score (e.g., 0.0 = certainly farmed, 1.0 = certainly organic) per engagement event, per piece of content, and per account.
Why: Real life is a credit score, not a criminal conviction. A bank doesn’t lock your card after one odd purchase — it adjusts a risk score and applies proportional friction. The same logic prevents a single ambiguous signal from ruining a genuine creator’s reach.
Beginner example: Think of a teacher grading class participation not by “raised hand = yes/no” but by a running sense of how genuine each student’s engagement feels over the semester.
Production example: YouTube’s watch-time algorithms don’t binary-flag a view; they weight it by an estimated “genuine attention” probability derived from scrubbing behaviour, session context, and device signals, then feed that weighted number into recommendation and monetisation pipelines.
3.2 Coordinated Inauthentic Behavior (CIB)
What: A cluster of accounts (which may individually be real people, bots, or a mix) acting in a synchronised way to amplify specific content, well beyond what independent, organic behaviour would produce.
Real-life analogy: One person laughing at a joke is normal. Fifty strangers laughing at the exact same joke, in the exact same rhythm, on cue — that’s a laugh track, not an audience.
Software example: A “graph community detection” job finds 340 accounts that all liked the same 12 posts within 90 seconds of each other, across three unrelated topics — a strong CIB signal regardless of whether any single account looks suspicious alone.
3.3 Engagement Bait (Content-Level Signal)
What: Content that explicitly manipulates users into engaging (“Tag 5 friends,” “Type AMEN,” “Share if you agree”) rather than earning engagement through genuine value.
Why it matters architecturally: This requires an NLP / content classifier path, separate from the account-behaviour path, because the fraud signal lives in the text/image/video itself, not in account behaviour patterns.
3.4 Velocity and Burstiness
What: How fast and how “clumped in time” engagement arrives. Organic engagement on most content follows a predictable decay curve (a spike right after posting to your existing followers, then a long tail). Farmed engagement often produces unnatural bursts — hundreds of likes in the first 30 seconds from accounts with no prior relationship to the poster.
Analogy: Real applause swells and fades organically. A recorded laugh-track cue is a sudden, uniform spike — you can hear the seam.
3.5 Graph-Native Signals (Sybil Detection)
What: Treating accounts and their interactions as a graph (nodes = accounts/content, edges = follows/likes/comments/shares) and using graph algorithms — community detection, PageRank-style trust propagation, graph neural networks (GNNs) — to spot suspicious structures: tightly-knit clusters with few connections to the rest of the platform, star-shaped “hub and spoke” following patterns, or near-duplicate account creation fingerprints.
Production example: Meta’s whitepapers describe “SybilRank”-style algorithms that propagate trust scores from a small set of known-trusted “seed” accounts outward through the social graph — accounts that are only reachable through long, thin paths from trusted seeds are treated as low-trust, exactly like a credit score built on your network of vouchers.
3.6 Device and Identity Fingerprinting
What: Building a fingerprint from device attributes, IP ranges, browser/app telemetry, and behavioural biometrics (typing cadence, tap pressure/timing patterns) to detect when many “different” accounts are actually operated from the same physical device farm or automation script.
3.7 Feature Store and Online/Offline Feature Parity
What: A centralised system that computes and serves the same ML features consistently for both real-time scoring (online) and historical model training (offline), avoiding “training-serving skew” — a classic ML systems bug where the model performs well in training but poorly in production because features were computed differently in each environment.
“Why not just use a single supervised ML model on account-level features?” Because farming evolves faster than a single model can be retrained, and because coordination signals are fundamentally graph-shaped, not row-shaped — you cannot see a “pod” by looking at one account’s feature vector in isolation. A layered system (rules + supervised ML + graph analysis + content NLP) is more robust to adversarial adaptation than any single model.
3.8 Shadow Metrics vs Public Metrics
What: Mature platforms maintain two parallel sets of engagement numbers: a shadow metric (the internal, fraud-adjusted count used for ranking, payouts, and analytics) and a public metric (the number shown on-screen to users). These two numbers are allowed to diverge, and usually do, by a small but meaningful margin.
Why: Imagine a grocery store scale that both displays a weight to the customer and separately records a corrected weight, accounting for the tare of the packaging, for billing. The customer-facing number optimises for simplicity and consistency; the internal number optimises for accuracy. Trying to force one number to serve both purposes creates either a confusing, constantly-fluctuating public display or an internally inaccurate business signal, neither of which is acceptable.
Production example: A post might publicly show “12,400 likes” while the shadow metric used for ranking and ad billing internally reflects “9,800 likes” after fraud discounting. The platform never publicly “corrects” the visible number downward, since that would look broken to users, but the ranking algorithm and any advertiser billing always uses the shadow number instead.
3.9 Trust Tiers and Progressive Trust
What: Rather than treating every account identically, mature systems bucket accounts into trust tiers, such as new/unverified, established, and highly-trusted/verified, that change how much scrutiny their engagement receives and how much friction they encounter.
Real-life analogy: A brand-new employee’s expense reports get reviewed line by line; a long-tenured, consistently accurate employee’s reports get lighter-touch spot checks instead. Trust is earned gradually over time and adjusts the intensity of scrutiny, rather than applying the exact same fixed process to everyone regardless of their history.
Beginner example: A brand-new account that joined ten minutes ago and immediately starts liking hundreds of posts is treated with far more suspicion than a five-year-old account with a long, consistent engagement history doing the exact same volume of likes during a viral news event.
Software example: A trust-tier lookup can gate which enforcement actions are even eligible for a given account: brand-new accounts might be automatically subject to lightweight friction challenges, while a highly-trusted verified account triggering the same rule gets routed straight to human review instead of any automatic restriction, protecting high-value creators from being auto-actioned by an imperfect model.
Architecture and Components
The full end-to-end system, the way you’d sketch it on a whiteboard in a system design interview.
Let’s zoom out and design the full system end-to-end, the way you’d sketch it on a whiteboard in a system design interview. We’ll go from the client all the way down to storage and enforcement, calling out every infrastructure component — API Gateway, Load Balancer, message queues, feature stores, ML services, and databases — explicitly.
4.1 High-Level Architecture
“Why do you have both a Global Load Balancer and a Regional Load Balancer, and why is the API Gateway separate from the Load Balancer?” A strong answer: the Global LB (GeoDNS/Anycast) routes users to their nearest healthy region for latency; the Regional LB does L7 load distribution and TLS termination across gateway instances in that region; the API Gateway is a distinct logical layer responsible for auth, rate limiting, request shaping, and routing to the right microservice — collapsing LB and Gateway into one component is a common but costly mistake, because it couples network-layer scaling with application-layer policy logic and makes independent scaling of each layer impossible.
4.2 Component Breakdown
CDN & Edge Bot Check
Filters out obvious headless-browser and scripted traffic before it even reaches your data centres, using TLS/JA3 fingerprinting and JS-challenge tokens — cheapest place to reject traffic.
Global + Regional Load Balancer
Global LB (Anycast/GeoDNS) picks the nearest healthy region; Regional LB (L7, e.g., Envoy/NGINX) spreads traffic across API Gateway instances and terminates TLS.
API Gateway
Single entry point enforcing authentication, per-account and per-IP rate limiting, schema validation, and request routing — also where adaptive bot-challenges (CAPTCHA, proof-of-work) get injected for risky sessions.
Engagement Ingestion Service
Validates and normalises every like/comment/share/follow/view event into a canonical schema, then publishes to the event bus. Stateless, horizontally scaled.
Kafka / Event Bus
Partitioned by content_id and account_id so per-content and per-account aggregates can be computed efficiently downstream; acts as the durable backbone decoupling ingestion from detection.
Stream Processor (Flink)
Computes sliding-window features: likes-per-minute on a post, unique-accounts ratio, geographic dispersion, device diversity — the raw ingredients for both rules and ML.
Online/Offline Feature Store
Serves low-latency features (Redis-backed) to the real-time scorer while keeping perfect parity with the offline features used to train models — prevents training/serving skew.
Rules Engine
Deterministic, human-readable heuristics (e.g., “more than 200 likes/min from accounts <7 days old”) — fast, explainable, and a first line of defence while ML models catch up to new attack patterns.
ML Scoring Service
Gradient-boosted trees (e.g., XGBoost) for tabular behavioural features, plus embedding models for account/content representations — outputs a calibrated authenticity probability in under 100 ms.
Graph Database + Analysis Service
Stores accounts/content as nodes and interactions as edges; runs community detection and GNN inference to surface coordinated clusters invisible to single-account scoring.
NLP / Multimodal Bait Classifier
Scores the content itself (caption, image, video transcript) for explicit engagement-bait patterns, independent of who engages with it.
Decision / Orchestration Service
Fuses rules + ML + graph + content scores into one policy decision using a configurable, versioned policy layer — the “brain” that decides the action.
Enforcement Action Service
Executes graduated actions: silently discount a fake like from public counters, demote content in ranking, challenge a session, restrict an account, or escalate to human review.
Review Queue & Appeals Service
Routes borderline or high-impact cases to trained human reviewers; captures reviewer decisions as new labelled training data — closing the feedback loop.
Primary DB / Wide-Column / Cache / Warehouse
Sharded relational store for account/content metadata, a wide-column store (Cassandra) for raw high-volume event logs, Redis for hot scores and rate-limit counters, and a warehouse/lake for training and analytics.
Metrics, Logs & Alerting
Prometheus/Grafana dashboards, centralised structured logging, and PagerDuty-style alerting so on-call engineers see farming spikes and pipeline failures in real time.
4.3 Zoomed-In: The Real-Time Scoring Path
“Why does the ingestion service return 200 OK before the fraud check finishes?” This tests understanding of user experience trade-offs: engagement actions (likes/follows) must feel instant to the user, so the system does an optimistic acknowledgment and asynchronously decides — within seconds — whether to actually count that engagement publicly. This is the same pattern payment systems use: your card swipe is accepted instantly at the register, but the fraud engine can still reverse the transaction minutes later.
Internal Working
Going one level deeper into the two hardest components — the ML Scoring Service and the Graph Analysis Service — plus the content-understanding layer that runs alongside them.
5.1 ML Scoring Service — Feature Engineering
Every engagement event is scored using three broad feature families:
| Feature Family | Examples | Analogy |
|---|---|---|
| Account-Level | account age, follower/following ratio, historical engagement rate, device diversity, past violation history | A person’s credit history |
| Behavioural / Velocity | events-per-minute, inter-event time variance (too regular = bot), session length, time-of-day distribution vs the account’s historical pattern | Someone’s normal walking pace vs suddenly sprinting everywhere |
| Contextual / Relational | relationship between engager and poster (mutual follow? stranger?), geographic distance, whether the engager has ever viewed this account’s content before | A friend congratulating you vs a stranger showing up at your party uninvited |
5.2 A Simplified Java Scoring Service
Below is a simplified (but structurally realistic) Java example showing how a scoring microservice might combine a rules pass and a model pass. In production this would call out to a served model (e.g., via gRPC to a TensorFlow Serving / Triton endpoint); here we illustrate the orchestration logic.
public class EngagementScoringService {

    private final FeatureStoreClient featureStore;
    private final ModelInferenceClient modelClient;
    private final RulesEngine rulesEngine;

    public EngagementScoringService(FeatureStoreClient featureStore,
                                     ModelInferenceClient modelClient,
                                     RulesEngine rulesEngine) {
        this.featureStore = featureStore;
        this.modelClient  = modelClient;
        this.rulesEngine  = rulesEngine;
    }

    // Called from the stream processor for every engagement event
    public AuthenticityDecision score(EngagementEvent event) {

        // Step 1: fetch precomputed rolling features (online store, ~5ms)
        FeatureVector features = featureStore.fetch(
                event.getAccountId(), event.getContentId());

        // Step 2: fast deterministic rules pass (cheap, explainable)
        RuleResult ruleResult = rulesEngine.evaluate(features, event);
        if (ruleResult.isHardBlock()) {
            return AuthenticityDecision.block(ruleResult.getReason());
        }

        // Step 3: ML model inference (gradient boosted trees, <50ms p99)
        double mlScore = modelClient.predictAuthenticity(features);

        // Step 4: fuse rule signal + ML score into a final weighted score
        double finalScore = fuseSignals(mlScore, ruleResult.getRiskBoost());

        return AuthenticityDecision.fromScore(finalScore, features.explain());
    }

    private double fuseSignals(double mlScore, double ruleRiskBoost) {
        // Simple weighted fusion; production systems use a calibrated
        // logistic layer trained on labeled incident data instead.
        double combined = (0.7 * mlScore) - (0.3 * ruleRiskBoost);
        return Math.max(0.0, Math.min(1.0, combined));
    }
}public class RulesEngine {
public RuleResult evaluate(FeatureVector f, EngagementEvent event) {
// Rule 1: burst velocity from very young accounts
if (f.getLikesPerMinuteOnContent() > 200
&& f.getMedianEngagerAccountAgeDays() < 7) {
return RuleResult.riskBoost(0.4, "velocity_spike_young_accounts");
}
// Rule 2: near-identical inter-event timing (bot cadence)
if (f.getInterEventTimeVarianceMs() < 15) {
return RuleResult.riskBoost(0.5, "machine_like_regular_cadence");
}
// Rule 3: engagement bait phrase match on the content itself
if (event.getContentBaitScore() > 0.85) {
return RuleResult.riskBoost(0.3, "engagement_bait_language");
}
return RuleResult.clean();
}
}5.3 Graph Analysis Service — Community Detection
The Graph Analysis Service periodically (near-real-time, every few minutes) runs community-detection algorithms — commonly a variant of the Louvain method or Label Propagation — over the interaction graph to find densely-connected clusters of accounts that engage heavily with each other but sparsely with the rest of the platform.
How trust propagates (SybilRank-style intuition): Start with a small, manually-verified set of “seed” trusted accounts (e.g., verified public figures, long-standing accounts with strong real-world identity signals). Run a random-walk / PageRank-style propagation: trust flows outward through the graph, diminishing with distance. Accounts only reachable through long, thin paths from any trusted seed accumulate low trust scores — exactly like how your credit score suffers if your only “references” are themselves unverifiable strangers.
“How do you keep graph analysis running at platform scale — billions of nodes, tens of billions of edges?” Discuss: partitioning the graph across a distributed graph-processing framework (Pregel-style, e.g., Apache Giraph or GraphX on Spark), running community detection incrementally on recently-active subgraphs rather than the full graph every time, and using approximate algorithms (e.g., approximate PageRank via power iteration with early stopping) to trade a small accuracy loss for massive compute savings.
5.4 NLP Bait Classifier — Internal Design
The content-understanding path works quite differently from the account-behaviour path, because it never even looks at who is engaging — only at what was posted. When a new piece of content is published, the NLP Bait Classifier runs once, scores the caption text, any on-screen text extracted via OCR from images or video frames, and (for video) a transcript generated through automatic speech recognition, looking for a family of linguistic patterns: direct imperative requests for engagement (“comment YES,” “tag three friends,” “share if you agree”), reciprocity framing (“I’ll follow back everyone who follows me”), and manufactured urgency or controversy bait designed purely to provoke a reaction rather than communicate information.
Analogy: This is conceptually similar to how an email spam filter reads the body of a message for phishing language patterns, independent of who sent it or how many times it’s been forwarded — the content itself carries the signal.
Beginner example: A cooking video captioned “Here’s how I make my grandmother’s lasagna” is very unlikely to trigger the classifier. A nearly identical video captioned “LIKE this video or grandma’s recipe disappears forever, tag someone who needs to see this NOW” carries strong bait-language markers even though the underlying content is similar.
Critically, a high bait score from this classifier does not automatically mean the content is prohibited outright — plenty of legitimate contests, giveaways, and calls-to-action use similar language within a platform’s rules. Instead, the bait score becomes one more input into the Decision Service’s fusion logic, typically combined with engagement-pattern signals: content with high bait language and simultaneously abnormal engagement velocity is treated far more seriously than content with bait language alone, which might just be a slightly aggressive but ultimately organic call-to-action from a legitimate creator.
5.5 Model Versioning and the Model Registry
Every model deployed into the ML Scoring Service and Graph Analysis Service is registered in a central Model Registry with an immutable version identifier, its training-data date range, evaluation metrics, and the exact feature schema it expects. This matters enormously in an adversarial domain: when a farming campaign is later confirmed months after the fact, engineers need to know precisely which model version was live at the time, what its known blind spots were, and whether a newer model would have caught it — all of which depends on rigorous versioning discipline rather than treating “the model” as a single, ever-changing black box.
Data Flow and Lifecycle
The full lifecycle of a single suspicious “like,” from the tap on a screen to a permanent audit record.
User Taps “Like”
Client app sends request through the Load Balancer to the API Gateway, which authenticates the session and checks basic per-account rate limits.
Optimistic Acknowledgment
Ingestion Service validates schema, assigns an event ID, publishes to Kafka, and immediately returns 200 OK — the UI updates instantly (the “heart” turns red) regardless of what happens next.
Stream Processing and Scoring
The Stream Processor updates rolling-window aggregates, the Rules Engine evaluates hard thresholds, and the ML Scoring Service returns an authenticity probability — all read/write against the online Feature Store and cache.
Graph Correlation (Async)
The event also lands in the Graph Database. Periodic (or micro-batch) community-detection jobs may retroactively lower this engagement’s authenticity if it’s later found to belong to a pod — enforcement can be retroactive within this window.
Decision and Enforcement
The Decision Service fuses all available signals and the Enforcement Service applies an action: nothing, silent public-count discounting, ranking demotion, friction challenge, or flag-for-human-review — written to the audit log in the primary DB.
Human Review (If Escalated)
Borderline or high-impact cases (e.g., a large verified account) enter the Review Queue; a trained moderator’s decision becomes a new labelled training example, closing the feedback loop back into the ML pipeline.
Model Retraining
The Data Warehouse aggregates the day’s labelled outcomes (human decisions, confirmed farming campaigns, appeal reversals) and triggers scheduled retraining of both the ML Scoring model and the GNN, incorporating newly observed attack patterns.
Because graph-level coordination often only becomes visible minutes after the fact, a naive design that makes engagement counts permanently public the instant they occur cannot correct itself later without a visibly “changing” like count — which itself confuses users. Most platforms solve this by never fully trusting the public counter in the first 5–15 minutes, or by silently discounting fraudulent counts going forward without ever publicly decrementing (avoiding a confusing UX where numbers appear to drop).
Advantages, Disadvantages and Trade-offs
Every meaningful choice above trades one desirable property for another. Making these explicit is the difference between an architecture and a wish-list.
Advantages of This Architecture
- Layered defence (edge → rules → ML → graph) means no single bypassed layer compromises the whole system.
- Decoupled event-driven design (Kafka) lets ingestion scale independently of scoring, and lets new detection layers be added without touching ingestion.
- Graph-native analysis catches coordination invisible to any per-account or per-content model.
- Graduated enforcement minimises collateral damage to legitimate users compared to binary ban/no-ban systems.
- Human-in-the-loop review creates a continuously improving feedback loop.
Disadvantages and Costs
- High operational complexity: many interdependent services, each needing its own SLOs, on-call rotation, and versioned deployments.
- Graph algorithms at platform scale are computationally expensive and hard to run truly real-time — most systems accept a several-minute detection lag for coordination signals.
- False positives directly damage creator trust and revenue — the cost of an error is asymmetric and reputationally expensive.
- Adversaries adapt quickly; the system requires continuous investment, not a “build once” mindset.
- Explainability is hard with GNNs and deep models — regulatory and appeals requirements can conflict with using the most accurate models.
7.1 Key Trade-off: Precision vs Recall
Every threshold you choose trades false positives against false negatives. Think of airport security: set the metal detector too sensitive, and you pat down every belt buckle (false positives — angry travellers, wasted staff time). Set it too lenient, and real threats slip through (false negatives). Engagement farming systems tune this per enforcement action: silent demotion can tolerate a higher false-positive rate (low cost if wrong) while permanent account bans require very high confidence (high cost if wrong).
7.2 Key Trade-off: Real-Time vs Batch Detection
| Dimension | Real-Time (Streaming) | Batch (Graph / Offline) |
|---|---|---|
| Latency | <1–2 seconds | Minutes to hours |
| Signal Type | Velocity, individual account features, content NLP | Coordination, cross-account clustering, long-horizon patterns |
| Compute Cost | Continuous, moderate per-event cost | Bursty, high per-run cost (full/partial graph traversal) |
| Best For | Catching obvious bots, bait content, velocity spikes | Catching sophisticated pods, Sybil networks, slow-and-low campaigns |
7.3 Key Trade-off: Transparency vs Gameability
Publishing exact detection rules would let bad actors trivially evade them (an “open playbook” problem) — but total secrecy undermines user trust and appeals fairness, and invites regulatory criticism. Most platforms publish policy (what’s prohibited) without publishing detection mechanics (exact thresholds/models), and reserve detailed evidence for regulator/court disclosure and law-enforcement channels.
“If you had to cut scope for an MVP, what would you keep and what would you cut?” Strong answer: keep the rules engine and basic velocity-based streaming detection (cheap, fast to ship, catches the bulk of unsophisticated bot/click-farm traffic); defer the graph/GNN layer and the full human-review workflow to a v2, since coordinated pods are a smaller fraction of total farming volume even though they’re the hardest to catch technically.
Performance and Scalability
Reasoning about scale from first principles — the way you would on a whiteboard, before writing a line of code.
8.1 Scale Assumptions
Let’s do a back-of-envelope capacity estimate the way you would in an interview. Assume a platform with 500 million daily active users, each performing an average of 40 engagement actions per day (likes, comments, shares, follows, views counted as discrete events).
At 1.2M events/sec peak, a single Kafka cluster with well-partitioned topics (partitioned by content_id hash, hundreds of partitions) and the Stream Processor horizontally scaled across hundreds of task-manager nodes is the standard approach — this is squarely the scale regime that Kafka + Flink was designed for (LinkedIn and Uber run similar or larger volumes for other use cases).

8.2 Scaling the ML Scoring Service
- Model choice matters for latency: gradient-boosted trees (XGBoost/LightGBM) serve in single-digit milliseconds; deep embedding models need GPU-backed serving (Triton) with batching to hit <100 ms p99 at this volume — many systems use trees for the hot path and reserve deep models for the async graph/offline path.
- Horizontal scaling: the scoring service is stateless per-request (features come from the feature store), so it scales linearly by adding pods behind the internal load balancer — a textbook case for Kubernetes Horizontal Pod Autoscaling on CPU/GPU utilisation.
- Feature store latency: Redis-backed online store must serve reads in single-digit milliseconds; hot keys (viral posts) can create hotspotting, mitigated with client-side caching and key sharding.
8.3 Scaling the Graph Layer
- Full-graph recomputation is infeasible at billions of nodes; production systems use incremental/streaming graph updates — only reprocessing the subgraph touched by recent activity.
- Graph partitioning (sharding by account-id ranges or using a distributed graph DB like JanusGraph/Neo4j Fabric/Amazon Neptune) allows parallel traversal.
- Approximate algorithms (e.g., HyperLogLog for cardinality estimates of “unique engagers,” MinHash for near-duplicate account clustering) trade a small, bounded error for orders-of-magnitude compute savings.
8.4 Little’s Law Applied to the Review Queue
The human Review Queue is a classic queueing-theory system: L = λ × W (average items in the queue = arrival rate × average time in queue). If moderators can review 2,000 flagged cases/hour combined and cases arrive at 1,800/hour, the queue stays stable; if a farming campaign spikes flagged volume to 5,000/hour, the queue will grow unboundedly unless you either add reviewer capacity, raise the auto-action confidence threshold (fewer cases need human review), or add priority triage (highest-impact accounts reviewed first).
“How would you handle a sudden coordinated attack that spikes traffic 50× on one piece of content in seconds (a ‘brigading’ event)?” Discuss: per-content adaptive rate limiting at the API Gateway, circuit breakers that temporarily freeze public counter updates on content showing anomalous velocity, and prioritised/expedited scoring queues that pull suspicious high-velocity content to the front of the graph analysis pipeline instead of waiting for the normal batch cycle.
8.5 Cost Optimisation at Scale
Running billions of ML inferences and periodic graph traversals daily is genuinely expensive, so cost engineering becomes a real design constraint, not an afterthought. A few concrete levers matter here. First, tiered scoring: cheap deterministic rules run on every single event, while the more expensive ML model only runs on events that pass an initial coarse filter (for example, skip full ML scoring for accounts already in the highest trust tier with a long clean history, since the expected value of scoring them is low). Second, batching inference requests to the ML Scoring Service rather than firing one request per event reduces per-request overhead substantially, especially for GPU-backed deep models where batched throughput is dramatically higher than single-item latency-optimised calls. Third, using spot/preemptible compute instances for the offline graph analysis and model retraining jobs, which can tolerate interruption and restart, while reserving guaranteed capacity only for the latency-sensitive real-time path.
Analogy: This mirrors how a restaurant kitchen staffs differently for the dinner rush versus prep work done the night before — the fast, customer-facing line needs guaranteed staff on hand every minute, while the slower prep work can be scheduled more flexibly around cheaper labour and downtime.
8.6 Capacity Planning for Seasonal and Event-Driven Spikes
Farming activity is not evenly distributed over time; it clusters heavily around high-stakes moments — elections, major product launches, viral news cycles, and creator monetisation deadlines, since that’s precisely when inflated metrics are most valuable to an attacker. Capacity planning must therefore budget for sustained multiples of average load during predictable high-risk windows (for example, provisioning the Stream Processor and ML Scoring Service fleets at 3 to 5 times average daily capacity in the weeks surrounding a national election), rather than sizing purely off historical daily averages.
High Availability and Reliability
The one rule specific to trust-and-safety systems: the core product must never be blocked by a fraud-detection outage.
9.1 What Happens If Detection Goes Down?
This is a critical design question specific to trust-and-safety systems: the core product (posting, liking, viewing) must never be blocked by a fraud-detection outage. The system should fail open for the user-facing action (the like still registers instantly) but fail safe for downstream trust decisions (ranking and payouts should not treat unscored engagement as automatically “trusted”).
Fail-open (allow all engagement through if the fraud system is down) protects user experience but opens a window for attackers to time campaigns around known outages. Fail-closed (block all engagement if the fraud system is down) protects trust integrity but takes down a core product feature for everyone. Most mature systems use a hybrid: fail-open for the UI action, but hold the engagement in a “pending trust” state that excludes it from ranking/payout calculations until scoring resumes — the safest of both worlds.
9.2 Redundancy and Multi-Region Design
- Active-active multi-region deployment of the API Gateway, Ingestion Service, and Scoring Service, with the Global Load Balancer routing users to their nearest healthy region.
- Kafka clusters replicated with a replication factor of 3+ across availability zones; MirrorMaker (or equivalent) for cross-region topic replication if regional failover is required.
- Feature store (Redis) deployed with primary-replica pairs per region plus automated failover (Redis Sentinel/Cluster) to survive node loss without a full cold-cache restart.
- Graph database replicated read-followers so read-heavy analysis jobs never contend with write traffic from live ingestion.
9.3 Circuit Breakers and Graceful Degradation
The Decision Service wraps calls to the ML Scoring Service and Graph Analysis Service in circuit breakers (e.g., Resilience4j in Java). If the ML service is unhealthy, the system automatically falls back to rules-only scoring rather than blocking the entire pipeline — a degraded-but-functioning mode beats a total outage.
public class DecisionService {

    private final CircuitBreaker mlCircuitBreaker;
    private final EngagementScoringService scoringService;
    private final RulesEngine rulesEngine;

    public AuthenticityDecision decide(EngagementEvent event, FeatureVector features) {
        Supplier<AuthenticityDecision> mlCall =
                () -> scoringService.score(event);

        Supplier<AuthenticityDecision> decorated =
                CircuitBreaker.decorateSupplier(mlCircuitBreaker, mlCall);

        try {
            return decorated.get();
        } catch (CallNotPermittedException | Exception ex) {
            // ML path unhealthy -> degrade gracefully to rules-only scoring
            RuleResult ruleResult = rulesEngine.evaluate(features, event);
            return AuthenticityDecision.fromRulesOnly(ruleResult);
        }
    }
}
9.4 Disaster Recovery
- RPO (Recovery Point Objective): Kafka’s durable log plus periodic snapshots of the feature store mean an acceptable RPO of seconds to a few minutes for the streaming path.
- RTO (Recovery Time Objective): automated region failover via the Global Load Balancer aims for an RTO of under a few minutes for the ingestion/scoring path; graph analysis, being asynchronous, can tolerate a longer RTO (tens of minutes) without user-facing impact.
- Regular chaos-engineering drills (e.g., randomly killing scoring service pods, simulating Kafka broker loss) validate that fail-open/fail-safe behaviour actually holds under real failure conditions, not just on paper.
“Would you rather have false negatives (miss some farming) or downtime on the core like/comment feature?” This is testing product judgment, not just engineering: the expected answer is that a trust-and-safety subsystem should almost never be allowed to take down the core product — reliability engineering here optimises for “degrade gracefully,” not “never miss a fraud case.”
9.5 Defining SLOs for Each Layer
Because different layers of the pipeline have very different failure tolerances, they need genuinely different Service Level Objectives rather than one blanket availability target for “the system.” A sensible allocation looks roughly like this: the API Gateway and Ingestion Service, sitting directly in the user-facing request path, target 99.99% availability, since any downtime here blocks the core like/comment/follow experience for real users. The Stream Processor and ML Scoring Service target slightly lower availability, around 99.9%, because a brief outage here degrades to rules-only scoring rather than failing the user request outright, thanks to the circuit-breaker fallback described earlier. The Graph Analysis Service and offline retraining pipeline can tolerate meaningfully lower availability targets still, since a delay of even an hour in coordination detection rarely causes irreversible harm, and a backlog can simply be processed once the service recovers.
Analogy: This mirrors how a hospital allocates reliability investment — the emergency room and its core life-support systems demand near-perfect uptime, while the records archive room, though still important, can tolerate a short outage without anyone being harmed.
Security
This system doesn’t just protect the platform — it must also protect itself from being reverse-engineered, poisoned, or weaponised.
10.1 Threat Model — Securing the Detector Itself
A unique twist here: the system doesn’t just protect the platform from external abuse, it must also protect itself from being reverse-engineered, poisoned, or weaponised. This is one of the most interesting security surfaces in system design because the “attacker” is actively probing the defence system, not just the product.
Adversarial Probing
Attackers create small batches of accounts, engage, and observe which patterns get flagged (via visible demotion or shadowban signals) to reverse-engineer thresholds — mitigated by randomised/jittered thresholds and not exposing precise enforcement feedback to users.
Training-Data Poisoning
If attackers can influence what gets labelled as “legitimate” (e.g., by having farmed accounts survive undetected long enough to become positive training examples), model quality degrades over time — mitigated by strict provenance tracking and periodic re-validation of “trusted” labels.
Insider Risk
Employees or compromised credentials with access to detection rules or enforcement tooling could disable protections for specific accounts — mitigated by strict RBAC, mandatory audit logging of every rule/policy change, and dual-approval for high-impact policy edits.
Model / Feature Exfiltration
Leaked feature definitions or model weights would hand attackers a precise evasion playbook — mitigated by encrypting model artifacts at rest, strict service-to-service authentication (mTLS), and least-privilege access to the feature store.
10.2 Standard Platform Security Controls
- AuthN/AuthZ at the API Gateway: OAuth2/OIDC token validation, per-endpoint scopes, and mutual TLS (mTLS) between internal microservices (Gateway → Ingestion → Scoring → Decision → Enforcement) so a compromised service can’t impersonate another.
- Rate limiting & adaptive friction: token-bucket rate limiters at the Gateway per account/IP/device; escalating friction (CAPTCHA, SMS re-verification, proof-of-work challenges) for sessions with elevated risk scores rather than an all-or-nothing block.
- Encryption: TLS 1.3 in transit everywhere; encryption at rest for the primary DB, event store, and feature store (especially anything containing device/IP fingerprints, which can be sensitive PII under GDPR/CCPA).
- Secrets management: centralised vault (e.g., HashiCorp Vault/AWS Secrets Manager) for all service credentials, rotated automatically, never hardcoded.
- Least privilege: the Enforcement Action Service, which can restrict/ban accounts, runs with a narrowly scoped service identity distinct from read-only analytics services — a compromised analytics job should never be able to trigger account bans.
10.3 Privacy and Regulatory Considerations
Device fingerprinting and behavioural biometrics are powerful anti-fraud signals but sit close to privacy-sensitive territory. Systems must: minimise retention of raw device/IP data (aggregate into risk scores and discard raw identifiers on a defined schedule), support data-subject access/deletion requests (GDPR Article 17), and maintain clear documentation for regulators (EU Digital Services Act requires large platforms to explain systemic risk mitigation, including inauthentic-behaviour detection, in public transparency reports).
Treating the fraud-detection pipeline as exempt from the platform’s normal data-privacy review because “it’s for safety” is a common and risky shortcut — regulators explicitly scrutinise safety systems’ data practices, precisely because they often process the most sensitive behavioural and device-level data on the entire platform.
“How would you prevent an attacker from using the appeals process itself as a probing tool?” Good answer: rate-limit appeals per account, avoid giving overly specific rejection reasons that reveal detection logic, and route unusually frequent or patterned appeal submissions (e.g., appeals arriving in bulk from related accounts) back into the risk-scoring pipeline as a signal in themselves.
10.4 Securing the Bot-Challenge Mechanism Itself
The friction challenges used to slow down suspected automation, such as CAPTCHAs, SMS re-verification, and proof-of-work puzzles, are themselves a security surface that needs protecting, since a commercial industry exists specifically to solve CAPTCHAs at scale using either cheap human labour in low-wage regions or increasingly capable automated solvers. A resilient design rotates challenge types rather than relying on a single mechanism indefinitely, monitors challenge-solve rates and solve-time distributions for statistically inhuman patterns that suggest an automated or outsourced solving service is being used, and treats an unusually high volume of successfully solved challenges from a narrow cluster of accounts as itself a fresh risk signal worth feeding back into the Graph Analysis Service, rather than treating a passed challenge as a permanent, unconditional stamp of trust.
10.5 Supply-Chain and Third-Party Risk
Many of the open-source and commercial components in this architecture, including the stream-processing framework, the graph database, and any third-party bot-detection or device-fingerprinting vendor, represent a supply-chain risk that a comprehensive security posture must account for. Standard mitigations apply here just as they would anywhere else in the platform: pinning dependency versions with regular, deliberate vulnerability scanning, maintaining a software bill of materials for every deployed service, and applying the same least-privilege network segmentation to third-party vendor integrations as to internal services, so a compromised third-party fraud-signal vendor cannot become a pathway into the core enforcement pipeline.
Monitoring, Logging and Metrics
Which numbers actually tell you whether the system is winning the arms race, and which are vanity metrics.
11.1 The Metrics That Actually Matter
| Metric | What It Tells You | Alert Threshold Example |
|---|---|---|
| Estimated Platform-Wide Inauthentic Engagement % | North-star trust metric; trend over time reveals if farming is winning the arms race | Week-over-week increase >15% |
| Scoring Service p99 Latency | Whether real-time enforcement is keeping up with traffic | >150ms sustained for 5 min |
| False Positive Rate (from Appeals) | Collateral damage to legitimate users | Appeal-overturn rate >5% on any single rule/model version |
| Kafka Consumer Lag | Whether streaming detection is falling behind ingestion volume | Lag > 30 seconds sustained |
| Review Queue Depth & Wait Time | Human-review capacity vs. incoming flagged volume (Little’s Law in action) | Queue depth growing for >30 min |
| Model Score Drift (PSI/KL-divergence) | Whether the ML model’s score distribution is shifting, signaling new attack patterns or data issues | Population Stability Index > 0.2 |
11.2 Observability Stack
- Metrics: Prometheus scraping per-service counters/histograms, visualised in Grafana dashboards segmented by region, content type, and enforcement action.
- Logging: structured JSON logs shipped to a centralised store (ELK stack or Datadog), with every enforcement decision logged with its full explainability payload (which rule fired, which features drove the ML score) for audit and appeals.
- Distributed tracing: OpenTelemetry traces spanning Gateway → Ingestion → Stream Processor → Scoring → Decision → Enforcement, so a slow or failing request can be pinpointed to the exact hop.
- Alerting: PagerDuty/Opsgenie integration tied to Prometheus alert rules, with clear severity tiers — a spike in Kafka lag pages on-call within minutes; a slow drift in false-positive rate creates a ticket for the ML team, not a 3am page.
11.3 Explainability as a First-Class Feature
Unlike many ML systems where explainability is a nice-to-have, here it’s a hard requirement: every enforcement action must be traceable to specific evidence for human reviewers, appeals processes, and (for major platforms) regulatory disclosure. Techniques include SHAP values for the gradient-boosted model, rule-trigger logging for the rules engine, and graph visualisation snapshots for coordination findings.
“How would you detect that your detection system itself has degraded — not because of an outage, but because a new farming technique is slipping through undetected?” Good answer: track leading indicators like a sudden rise in “viral” content from very new/low-trust accounts, a growing gap between internally-estimated inauthentic engagement and externally-reported anomalies (press, researchers, advertisers), and periodic red-team exercises where an internal team actively tries to farm engagement to test the pipeline.
Deployment and Cloud Architecture
How this design actually lives across regions, availability zones, and the everyday plumbing of a production cloud environment.
12.1 Deployment Topology
12.2 Infrastructure as Code and CI/CD
- All infrastructure (Kubernetes clusters, Kafka topics, IAM roles, autoscaling policies) defined in Terraform for repeatable, auditable, region-identical deployments.
- Each microservice ships via its own CI/CD pipeline with canary deployment: new versions of the Scoring Service or Rules Engine roll out to 1% of traffic, monitored against false-positive/negative rate deltas, before progressing to 10%, 50%, 100% — critical because a bad model deploy can silently cause a wave of wrongful enforcement actions.
- Blue-green deployment for the API Gateway and Enforcement Service, where a full switch happens instantly with an immediate rollback path, since these sit directly in the user-facing request path.
12.3 Cloud Service Choices (Illustrative — AWS Example)
| Component | Example AWS Service | Why |
|---|---|---|
| Global/Regional Load Balancer | Route 53 (GeoDNS) + Application Load Balancer | Managed, integrates with health checks and auto-scaling groups |
| API Gateway | Amazon API Gateway or self-managed Envoy on EKS | Envoy preferred at this scale for finer-grained control over rate limiting and custom auth filters |
| Event Streaming | Amazon MSK (Managed Kafka) or self-managed Kafka on EC2 | MSK reduces operational burden of broker management at this scale |
| Stream Processing | Amazon Kinesis Data Analytics / self-managed Flink on EKS | Flink offers more mature exactly-once semantics for financial-grade fraud pipelines |
| ML Serving | Amazon SageMaker Endpoints / self-managed Triton on EKS with GPU nodes | Depends on model complexity; trees can run cheaply on CPU-based endpoints |
| Graph Database | Amazon Neptune or self-managed JanusGraph on Cassandra | Neptune for managed operations; JanusGraph for extreme scale/cost control |
| Feature Store | Amazon ElastiCache (Redis) + Feast (open source) for governance | Combines low-latency serving with feature versioning/lineage |
| Data Warehouse | Amazon Redshift or Snowflake | Training data aggregation, BI dashboards, transparency reporting |
| Container Orchestration | Amazon EKS (Kubernetes) | Standard for horizontally-scaled stateless microservices with HPA |
“Why replicate Kafka across regions instead of just running independent regional pipelines?” Because coordinated attacks are often geographically distributed by design (that’s part of what makes them look “organic”), so the Graph Analysis Service needs a global (or at least cross-region-aware) view of the interaction graph — a purely regional pipeline would miss cross-region pods entirely, which is precisely the blind spot sophisticated attackers exploit.
12.4 Rollback and Progressive Delivery Discipline
Because a bad deploy in this system can wrongfully punish real users at massive scale within minutes, progressive delivery discipline matters more here than in most ordinary product engineering. Every deployment pipeline for the Rules Engine, ML Scoring Service, and Decision Service is wired to automatically watch a small set of guardrail metrics, such as false-positive rate estimated from live appeal outcomes and the overall enforcement-action volume, during each canary stage, and to trigger an automatic rollback the moment any guardrail crosses a predefined threshold, without waiting for a human to notice a dashboard anomaly first. Feature flags additionally let the team toggle individual rules or model versions off instantly for a specific region or content category if a narrower issue is discovered, without needing to roll back the entire service, which keeps the blast radius of any single bad change as small as operationally possible.
Analogy: This mirrors the way a modern car’s electronic stability control system intervenes automatically the instant it senses a skid, rather than waiting for the driver to consciously notice and correct it — the faster and more automatic the safety mechanism, the smaller the resulting harm.
Databases, Caching and Load Balancing
Different data has different physics — and one database rarely satisfies all of them.
13.1 Database Selection Rationale
| Store | Technology Choice | Why This Fits |
|---|---|---|
| Account & Content Metadata | Sharded PostgreSQL / Google Spanner | Needs strong consistency for things like ban status and appeal state; Spanner adds global consistency for multi-region writes if required |
| Raw Engagement Event Log | Apache Cassandra / ScyllaDB (wide-column) | Extremely high write throughput, time-series-friendly partitioning by content_id/time bucket, tunable consistency |
| Graph of Accounts/Content/Interactions | JanusGraph on Cassandra, or Neptune | Purpose-built for traversal-heavy queries (community detection, shortest-path-to-trusted-seed) |
| Online Feature Store / Hot Scores | Redis Cluster | Sub-millisecond reads for real-time scoring; TTL-based expiry fits rolling-window features naturally |
| Offline Training Data | Data Lake (S3/Parquet) + Snowflake/BigQuery | Cheap, massive-scale storage for historical features, cost-efficient for periodic batch training jobs |
13.2 Why Not Just One Database?
A common beginner mistake is trying to force this whole system onto a single relational database. This system is a textbook case for polyglot persistence — using the right storage engine per access pattern, exactly the way a kitchen uses a freezer for long-term storage, a fridge for near-term ingredients, and a countertop for what’s being used right now. Relational databases excel at strongly-consistent metadata; wide-column stores excel at massive write throughput; graph databases excel at traversal; caches excel at sub-millisecond hot reads. Forcing all of these into Postgres would either collapse under write load or perform traversal queries so slowly the real-time detection SLA becomes impossible.
13.3 Caching Strategy
- Cache-aside pattern for account risk scores: the Scoring Service checks Redis first; on a miss, computes from the feature store and writes back with a short TTL (e.g., 60 seconds) so scores stay fresh without recomputation on every single event.
- Write-through for rate-limit counters: every engagement event atomically increments a Redis counter (using
INCRwith a sliding TTL) so the Gateway can enforce rate limits without hitting the primary database at all. - Cache invalidation on enforcement: when an account is restricted, its cached “trusted” status is invalidated immediately across all regions via a pub/sub invalidation message, rather than waiting for TTL expiry — critical because a stale cache could let a just-banned account’s engagement continue counting for up to a minute otherwise.
13.4 Load Balancing Deep Dive
Three distinct load-balancing layers exist in this system, each solving a different problem:
Global Load Balancer
DNS-based (GeoDNS) or Anycast IP routing sends a user to their nearest healthy region — solves geographic latency and regional disaster recovery.
Regional (L7) Load Balancer
Distributes traffic across API Gateway pods within a region using algorithms like least-connections or round-robin, with active health checks removing unhealthy instances — solves intra-region traffic distribution and TLS termination.
Internal Service Load Balancing
Service-mesh-based (e.g., Istio/Envoy sidecars) load balancing between microservices (Gateway → Ingestion → Scoring), often with more advanced strategies like consistent-hashing to keep related requests on warm cache nodes.
“How would you handle a hot partition problem — a single viral post generating a disproportionate share of Kafka traffic on one partition?” Good answer: use a composite partition key (content_id + a random salt bucket) for extremely high-volume content, fan the load across multiple partitions, and reaggregate downstream in the Stream Processor — the classic “salting” technique for defeating hot-key skew.
13.5 Replication and Consistency Trade-offs
Different stores in this architecture deliberately make different consistency choices, and understanding why is a good test of systems fluency. The primary account/content metadata store favours strong consistency, since a delayed or inconsistent view of an account’s ban status could allow a just-restricted account to keep engaging for a few extra seconds across different regions, a real and meaningful gap for a fast-moving farming campaign. The wide-column event log, by contrast, favours eventual consistency and high write availability, since losing strict ordering guarantees on raw event ingestion is an acceptable trade for the massive write throughput required, especially since the event log’s role is historical record-keeping and model training rather than instant decision-making. The Redis-backed feature store sits in between, typically configured for a small, bounded staleness window, since serving a feature value that is a second or two out of date rarely changes a scoring decision meaningfully, but waiting for perfectly fresh data on every single read would violate the sub-100-millisecond latency budget the whole real-time path depends on.
Analogy: This is the same reasoning airlines use for different systems: the system tracking whether a specific seat is booked needs strong consistency to avoid double-booking, while the system logging in-flight Wi-Fi usage statistics can tolerate a slightly stale or eventually-consistent view without any real consequence.
APIs and Microservices
The contract each service exposes and why splitting into services beats a single monolith here.
14.1 Core Internal APIs
paths:
  /v1/score:
    post:
      summary: Score a single engagement event for authenticity
      requestBody:
        content:
          application/json:
            schema:
              type: object
              properties:
                eventId:        { type: string }
                accountId:      { type: string }
                contentId:      { type: string }
                engagementType: { type: string, enum: [like, comment, share, follow, view] }
                timestamp:      { type: string, format: date-time }
      responses:
        '200':
          content:
            application/json:
              schema:
                type: object
                properties:
                  authenticityScore: { type: number }
                  action:            { type: string }
explanation: { type: array, items: { type: string } }| API | Protocol | Consumers | Notes |
|---|---|---|---|
POST /v1/score | gRPC (internal), REST (external tools) | Stream Processor, Decision Service | Hot path, <100ms p99 SLA |
POST /v1/content/analyze | gRPC | NLP Bait Classifier, Decision Service | Called once per new content publish, cached result reused for subsequent engagements |
GET /v1/graph/community/{accountId} | REST | Review Queue UI, Decision Service | Returns cluster membership + trust-propagation trace for explainability |
POST /v1/enforcement/action | gRPC (internal, mTLS-only) | Decision Service only | Highly privileged; strict RBAC and audit logging |
POST /v1/appeals | REST | Client apps | Rate-limited per account; feeds appeal-pattern signal back into risk scoring |
14.2 Why Microservices Here (and Not a Monolith)
This domain has genuinely independent scaling and iteration needs: the Rules Engine changes daily (analysts tune thresholds), the ML model retrains weekly, the Graph Service runs on a completely different compute profile (memory-heavy graph traversal vs. the Scoring Service’s low-latency inference), and the Enforcement Service has far stricter security requirements than, say, the Content NLP Classifier. Splitting these into independently deployable, independently scalable microservices lets each team iterate at its own pace and blast-radius-limit failures — a monolith would force lockstep deployment of a security-critical enforcement path alongside a fast-iterating ML experimentation path, which is operationally dangerous.
14.3 Communication Patterns
- Synchronous (gRPC): used where a response is needed within the request’s latency budget — Stream Processor → Scoring Service, Decision Service → Enforcement Service.
- Asynchronous (Kafka events): used for anything that can tolerate delay and benefits from durability/replay — Ingestion → all downstream consumers, Enforcement → audit logging, Review outcomes → model retraining pipeline.
- API Composition at the Gateway: external-facing endpoints (e.g., a “why was my content demoted” transparency endpoint for creators) compose data from multiple internal services (Decision Service explanation + Graph Service cluster info) into a single client-friendly response.
“Would you use REST or gRPC for the hot scoring path, and why?” Expected answer: gRPC, because of its binary protobuf serialisation (smaller payloads, faster parsing than JSON), built-in support for streaming, and lower per-call overhead — all of which matter when you’re making this call for every single engagement event at hundreds of thousands of requests per second. REST/JSON remains fine for lower-volume, human/tool-facing APIs like the appeals endpoint.
Design Patterns and Anti-patterns
The reusable ideas the design leans on — and the tempting shortcuts you must resist.
15.1 Patterns Used in This System
CQRS
Writes (engagement events) flow through the ingestion/streaming pipeline, while reads (public like counts, creator analytics dashboards) are served from precomputed, denormalised views — avoiding contention between high-volume writes and read-heavy dashboards.
Event Sourcing
The raw Kafka event log is the source of truth; all aggregates (counts, scores) are derived/replayable from it — enabling reprocessing with an improved model without losing historical fidelity.
Circuit Breaker
Applied around ML and Graph service calls (see Section 9.3) to degrade gracefully instead of cascading failure.
Strangler Fig
Used operationally when replacing legacy rule sets: new ML-based scoring runs in shadow mode alongside old rules, gradually taking over decision authority as confidence grows, rather than a risky big-bang cutover.
Bulkhead
Review Queue capacity is partitioned by severity tier so a flood of low-severity flags can never starve out capacity needed for high-impact/urgent cases (e.g., a large verified account caught in a coordinated attack).
Saga (Enforcement Workflows)
Multi-step enforcement (discount engagement → demote content → notify creator → log audit trail) is implemented as a saga with compensating actions, so a partial failure (e.g., notification service down) doesn’t leave the system in an inconsistent state.
15.2 Anti-patterns to Avoid
Single Hard Threshold Everywhere
Relying on one static rule (“>500 likes/hour = ban”) is trivially evaded and generates avoidable false positives on legitimately viral content — always combine multiple weak signals probabilistically.
Synchronous Blocking on Fraud Checks
Making the user wait for full graph/ML analysis before their like registers destroys UX for a feature that should feel instant — always decouple the user-facing acknowledgment from the deeper asynchronous analysis.
Model Without Explainability
Deploying a black-box deep model with no per-decision explanation makes appeals, audits, and regulatory disclosure practically impossible — pair complex models with an explainability layer (SHAP, rule-trigger logs) from day one.
Treating Detection as “Done”
Shipping a model and never retraining or red-teaming it against evolving tactics guarantees decay — this domain is fundamentally adversarial and requires continuous investment, not a one-time build.
God Service
Combining rules, ML scoring, graph analysis, and enforcement into one giant service creates a single point of failure and forces lockstep deploys across teams with very different release cadences and risk profiles.
“Why event sourcing here specifically, versus just storing final aggregate counts?” Because ML models and thresholds evolve constantly — event sourcing lets the team reprocess historical raw events through a new model to retroactively validate or improve past decisions, generate better training labels, and answer “would our new model have caught this campaign?” without needing to have predicted that question in advance.
15.3 The Competing Consumers Pattern in Practice
The Kafka-backed ingestion pipeline is a direct application of the Competing Consumers pattern: many independent instances of the Stream Processor subscribe to the same partitioned topic, with each partition’s messages consumed by exactly one instance at a time, allowing the overall processing throughput to scale horizontally simply by adding more consumer instances, up to the number of partitions configured on the topic. This pattern is what allows the detection pipeline to absorb sudden traffic spikes, such as a viral news event or a coordinated brigading attack, by rapidly scaling out consumer pods rather than requiring a redesign of the ingestion path itself.
Analogy: Picture a large restaurant kitchen during a dinner rush, where multiple identically-trained line cooks can each pick up the next ticket from a shared order rail as soon as they finish their current dish — adding another cook to the line increases throughput almost linearly, without anyone needing to reorganise how orders are printed or routed.
15.4 Backpressure and Load Shedding
When the ML Scoring Service or Graph Analysis Service falls behind the incoming event rate, for example during an unexpected traffic spike, the system needs an explicit backpressure strategy rather than simply queueing indefinitely until memory is exhausted. Kafka’s consumer lag naturally provides a buffer, but beyond a configured lag threshold, the Decision Service can deliberately shed load by routing lower-priority events, such as engagement on very old content unlikely to still be actively ranked, straight to a lightweight rules-only path, reserving full ML and graph analysis capacity for the highest-priority, freshest content where detection speed matters most.
Best Practices and Common Mistakes
Habits that mature teams share — and the recurring traps that catch newer ones.
16.1 Best Practices
- Score at multiple levels simultaneously — event, content, account, and cluster — because farming can be visible at any one of these levels while looking clean at the others.
- Build shadow-mode evaluation into every model change — run new models alongside production ones, comparing decisions on live traffic without acting on the new model’s output, before ever letting it make real enforcement decisions.
- Make enforcement graduated and reversible — prefer silent discounting and demotion over permanent bans wherever possible; reversibility is what makes an aggressive detection posture survivable when false positives inevitably happen.
- Invest as much in the labelling pipeline as the model — model quality is bottlenecked by label quality; human reviewer decisions, confirmed campaign takedowns, and appeal outcomes should all feed back as high-quality labels.
- Red-team your own system regularly — an internal team actively trying to farm engagement (with authorisation and safeguards) is one of the best ways to find blind spots before real attackers do.
- Design for explainability from day one, not as an afterthought bolted onto a black-box model after regulators or journalists ask hard questions.
16.2 Common Mistakes
Mistakes Teams Commonly Make
- Optimising purely for detection recall while ignoring false-positive impact on legitimate creators, causing a trust backlash that outweighs the fraud prevented.
- Treating account-level and content-level fraud as the same problem, missing cases where real, clean accounts farm specific pieces of content via pods.
- Under-investing in the graph layer because it’s harder to build, leaving sophisticated coordinated campaigns as a permanent blind spot.
- Publishing overly specific enforcement feedback to users (“you were flagged because you got 47 likes in 30 seconds”), handing attackers a precise evasion recipe.
- Letting the review queue silently grow without alerting, so real campaigns sit unreviewed for days while public metrics stay inflated.
- Forgetting to version and audit rule/policy changes, making it impossible to answer “why did enforcement behaviour change last Tuesday?” during an incident review.
How to Avoid Them
- Track false-positive rate as a first-class SLO, not a secondary concern, with dedicated alerting and executive visibility.
- Maintain separate but coordinated scoring paths for account-level and content-level risk, fused at decision time.
- Budget graph/GNN infrastructure investment proportional to its detection value, even though it’s the least “flashy” component to build.
- Keep enforcement messaging general (“this content violates our engagement policies”) without exposing exact thresholds or signals.
- Instrument the review queue with the same rigour as any other production system — depth, wait time, and SLA breach alerting.
- Require every rule/model/policy change to go through versioned, audited deployment with a documented rollback plan.
“The moment a metric becomes a target, it ceases to be a good metric.”— Goodhart’s Law, and the single best mental model for why engagement farming will always exist wherever engagement is rewarded.
“How do you balance shipping fast detection improvements against the risk of a bad model causing mass false positives?” Expected answer: shadow-mode testing, staged canary rollouts with automatic rollback triggers tied to false-positive-rate deltas, and treating detection model deploys with the same rigour as core payment-system deploys — because at scale, a bad model version can wrongfully demote or restrict millions of legitimate accounts within minutes.
16.3 Organisational Practices That Reinforce Good Engineering
Beyond the purely technical practices above, the healthiest teams running systems like this tend to share a few organisational habits worth calling out explicitly. They run regular blameless postmortems on both missed farming campaigns and false-positive incidents, treating each as an equally valuable source of learning rather than only scrutinising the misses. They maintain a living, versioned policy document that translates business and legal requirements into concrete detection and enforcement rules, so that engineers, policy specialists, and legal reviewers are always working from the same source of truth rather than tribal knowledge scattered across chat threads. They also deliberately rotate engineers through the human review queue periodically, since firsthand exposure to real borderline cases builds an intuition for the messy edge cases that no amount of reading dashboards or metrics can substitute for, and consistently produces better-calibrated rules and models over time.
Real-World / Industry Examples
Every major platform has converged on the same architectural shape — here’s the public evidence.
Coordinated Inauthentic Behaviour Takedowns
Meta publishes quarterly “Coordinated Inauthentic Behavior” reports detailing networks of accounts removed for artificially amplifying content, often tied to state-linked influence operations. Their public methodology emphasises network-level (graph) analysis over individual account review — directly validating the graph-first architecture described here.
Engagement Bait Demotion (2018)
Facebook explicitly announced it would use machine learning to detect posts using “vote-baiting” language (“LIKE if…”, “SHARE if…”) and demote them in the News Feed ranking algorithm — an early, well-documented example of a content-level NLP classifier feeding directly into ranking, similar to the Content Understanding Layer in our architecture.
Bot Network Purges
X has periodically removed tens of millions of suspected bot/spam accounts in visible “purges,” using velocity and behavioural-pattern detection (accounts tweeting at inhuman frequency, identical content posted by many accounts) — an example of the Rules Engine + Stream Processor layer operating at scale.
View Count Fraud Detection
YouTube has long used server-side view validation that deliberately does not increment the visible view counter in real time for the first portion of a video’s life, specifically to make it harder for view-botting scripts to calibrate against instant feedback — directly reflecting the “don’t fully trust public counters immediately” principle from our Data Flow section.
Engagement Pod Detection
LinkedIn has publicly discussed detecting “engagement pods” — external groups (often coordinated via other platforms) whose members agree to mass-like and comment on each other’s posts within minutes of publishing — a textbook Community Detection use case matching our Graph Analysis Layer.
Watch-Time Authenticity Modelling
TikTok’s recommendation system reportedly weighs not just raw watch time but inferred genuine attention (e.g., discounting suspicious autoplay-loop patterns), reflecting the Authenticity Score concept over binary engagement counting described in Core Concepts.
Every major platform independently converged on the same architectural shape: layered detection (rules → ML → graph), asynchronous/graduated enforcement rather than instant hard blocks, and a deliberate lag before fully trusting public-facing metrics. That convergence is strong real-world validation that this is close to the “right” architecture for the problem, not an arbitrary design choice.
“Can you name a case where a platform’s anti-farming system caused a notable false-positive backlash?” This tests real-world awareness: several platforms have faced creator backlash over sudden, unexplained reach drops later attributed to overly aggressive spam/bait classifiers misfiring on legitimate high-engagement content (e.g., posts asking sincere questions being misclassified as “bait”). The right takeaway for system design is exactly what this article emphasises: precision matters as much as recall, and unexplained enforcement erodes trust even when technically correct.
Frequently Asked Questions
The questions people actually ask when they first meet this problem — distilled and answered honestly.
Can this system ever reach 100% accuracy?
No, and it shouldn’t try to. This is an adversarial, continuously evolving problem — the correct goal is to raise the cost and lower the return-on-investment of farming enough that it stops being economically attractive at scale, not to achieve perfect detection, which is provably unreachable against a motivated, adaptive adversary.
How do you avoid punishing genuinely viral content that just happens to spike quickly?
By combining velocity with corroborating signals — account age/diversity of engagers, geographic/network dispersion, content-classifier bait score — rather than velocity alone. Genuinely viral content typically shows organic diversity in who’s engaging; farmed spikes show unnatural homogeneity (similar account ages, similar creation patterns, similar device fingerprints).
Should small platforms build all of this from day one?
No. Start with the Rules Engine and basic velocity-based streaming detection — this alone catches the majority of unsophisticated bot and click-farm traffic cheaply. Add ML scoring once you have enough labelled incident data to train a meaningful model, and only invest in the full graph/GNN layer once coordinated pods become a material fraction of observed abuse — build in the order of highest detection-value-per-engineering-dollar.
How is this different from a generic content-moderation (hate speech / nudity) pipeline?
Content moderation classifies individual pieces of content in isolation against policy categories. Engagement farming detection is fundamentally relational and temporal — it cares about patterns across many accounts and events over time, not the semantic meaning of any single piece of content (except for the bait-language NLP path). The two systems can share infrastructure (event bus, review queue, enforcement service) but need distinct detection logic.
What’s the single hardest part of this system to get right?
Calibration of the fusion layer — combining rules, ML scores, and graph signals into one confident decision without over- or under-weighting any single source, while keeping the whole thing explainable and adjustable as new attack patterns emerge. Any individual component (a good graph algorithm, a good classifier) is well-understood engineering; the fusion and policy layer is where most of the genuine, ongoing design difficulty lives.
Do generative AI tools make this problem worse?
Significantly. LLMs can generate large volumes of plausible, varied fake comments (harder to catch with simple duplicate-text detection) and can help attackers write more convincing engagement-bait captions. This is pushing detection systems toward multimodal, semantic-level content analysis rather than relying on surface-level pattern matching like exact-text duplication.
How do you handle cross-platform coordination, where a group organises on one app but farms engagement on another?
You generally can’t observe the organising conversation itself without visibility into the other platform, so detection has to rely entirely on the downstream footprint it leaves behind: a cluster of accounts that suddenly all engage with the same content within a tight time window, despite having little or no prior interaction history with each other or with the creator, is a strong indirect signal of external coordination. Some platforms also participate in cross-industry information-sharing initiatives around known bad-actor infrastructure, such as shared blocklists of IP ranges or device fingerprints associated with commercial farming services, though this remains an incomplete and evolving area of collaboration.
Who typically owns this system inside a company — the Trust & Safety team, the ML platform team, or the core infrastructure team?
In most large organisations, ownership is genuinely cross-functional: a dedicated Integrity or Trust & Safety engineering team usually owns the Decision Service, policy layer, and enforcement logic; a central ML platform team often owns the shared feature store and model-serving infrastructure that many other ML use cases also depend on; and core infrastructure teams own the underlying Kafka, Kubernetes, and database platforms as shared horizontal services. Getting this ownership boundary right, with very clear interfaces and SLAs between teams, is itself a significant system design decision, since misaligned ownership is a common root cause of slow incident response when something in the pipeline breaks.
Summary and Key Takeaways
Zooming back out from the schematic details to the handful of principles that make the whole thing hang together.
Designing a system to detect and prevent engagement farming is fundamentally a fraud-detection problem layered on top of a social platform: the currency being protected is authentic attention, not money, but the architectural instincts — layered defence, probabilistic scoring over hard thresholds, graduated and reversible enforcement, and continuous adversarial adaptation — are directly borrowed from decades of fraud-engineering practice.
Pulling everything together, notice how the same handful of ideas keep resurfacing across nearly every section of this design: never trust a single signal in isolation, always prefer reversible and graduated responses over irreversible ones, decouple the user-facing experience from the deeper asynchronous analysis running behind it, and treat the whole system as a living, continuously retrained organism rather than a piece of software that ships once and is simply left running. Whether you are asked to design this exact system in an interview, or a conceptually related trust-and-safety problem like payment fraud, content moderation, or account-takeover detection, these same underlying principles will transfer almost directly, because they describe how to build resilient decision-making systems under genuine adversarial pressure, not just how to detect fake likes specifically.
Key Takeaways
- Engagement farming spans a taxonomy of distinct tactics (bait, bots, click farms, pods, Sybils, view fraud, follow trains) that each leave different fingerprints — a single detection technique cannot catch all of them.
- A production architecture layers an edge/bot check, API Gateway with adaptive rate limiting, a streaming ingestion and scoring pipeline, a graph-native coordination-detection layer, and a content-level NLP classifier — fused together in a Decision Service that drives graduated enforcement.
- Real-time streaming detection (velocity, individual signals) and asynchronous graph/batch detection (coordination, Sybil networks) are complementary, not substitutes — each catches what the other misses.
- The system must fail open for user experience but fail safe for trust decisions — never let a fraud-detection outage silently damage core product availability, but also never let unscored engagement be blindly trusted downstream.
- Precision matters as much as recall: false positives against legitimate creators are a serious, trust-eroding cost, and graduated/reversible enforcement (discount, demote, challenge) is safer at scale than binary block/ban decisions.
- Polyglot persistence (relational + wide-column + graph + cache + warehouse) is essential — no single database technology serves every access pattern this system needs efficiently.
- Explainability, audit logging, and human review are not optional extras — they are core requirements driven by appeals fairness, regulatory obligations (like the EU’s Digital Services Act), and the practical need to debug and improve the system over time.
- This is an adversarial, continuously evolving domain — the mission is to raise the cost of farming past the point of profitability, not to chase an unreachable 100% detection rate.
“If you could only add one more component to this system with a limited budget, what would it be and why?” There’s no single right answer, but a strong candidate is deeper investment in the labelling and feedback-loop infrastructure (human review + appeal outcomes feeding retraining) — because every other component’s long-term effectiveness is ultimately bottlenecked by the quality and freshness of the labels used to train and validate it.

