What Is a Bottleneck in System Design?
A system is only ever as fast as its slowest necessary step. This is a plain-English guide to spotting those slowest steps, understanding why they matter, and knowing what to do about them — before real users find them for you.
What Is a Bottleneck?
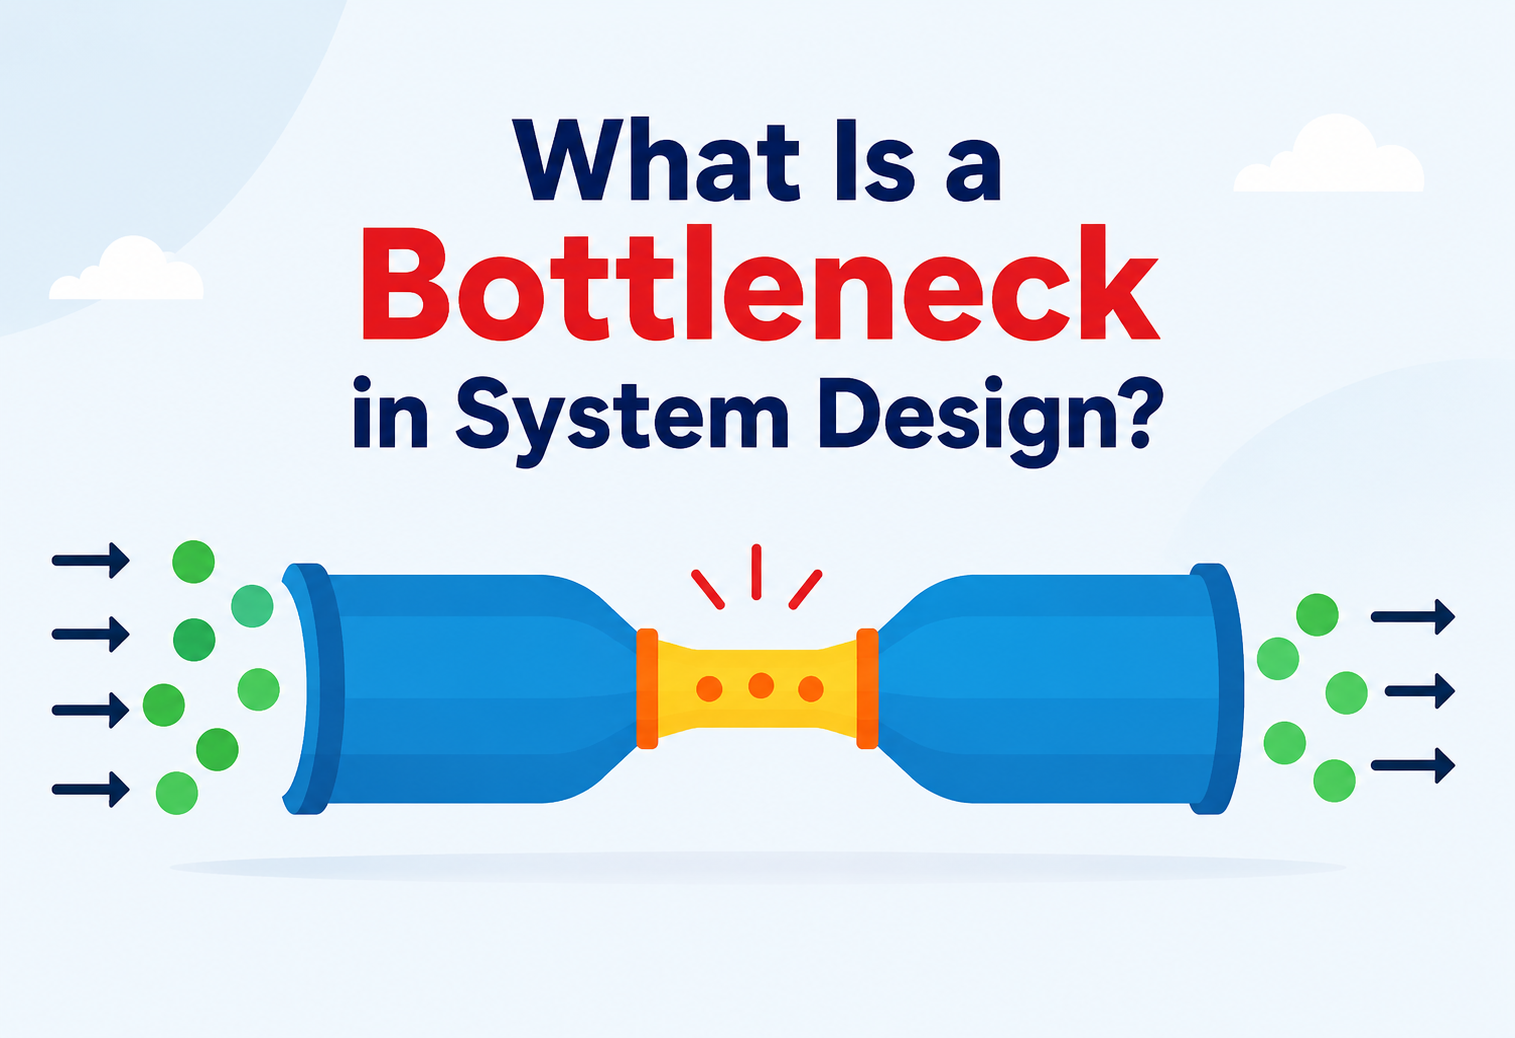
Picture a glass bottle turned upside down. The bottle’s belly is wide and roomy, but the neck near the cap is thin and narrow. No matter how much liquid you pour in from the top, it can only leave the bottle as fast as that skinny neck allows. Pour faster, and the liquid just backs up above the neck, waiting its turn.
That narrow neck is exactly where the word “bottleneck” comes from, and it is a surprisingly perfect way to describe a very common problem in computer systems. A bottleneck in system design is the one part of a system — a piece of hardware, a slow line of code, an overloaded database, a crowded network cable, or even a single overworked employee — that limits how fast the entire system can go, no matter how fast every other part might be.
Here is the tricky part: a bottleneck does not have to be broken to cause trouble. Every other component in the system could be working perfectly, humming along at full speed, and the whole system would still crawl if just one piece cannot keep up. Speed is a team sport, and a team only moves as fast as its slowest player.
Think about a school cafeteria at lunchtime. The kitchen can cook meals quickly, the dining hall has plenty of tables, and hundreds of hungry students are ready to eat. But there is only one lunch lady scanning ID cards at the entrance, one card at a time. Even though the kitchen, the tables, and the students are all ready to go, the entire line moves at the speed of that single scanner. That scanner is the cafeteria’s bottleneck.
In software, this same idea shows up everywhere. A shopping app might have a beautifully fast website, a huge team of engineers, and servers scattered across the globe — yet if every single request has to wait in line for one small database table to respond, the whole app feels sluggish. Fixing bottlenecks is one of the most important, and most misunderstood, jobs in software architecture.
A bottleneck is the single slowest, most constrained part of a system that sets the upper speed limit for everything that depends on it.
It also helps to understand what a bottleneck is not. It is not the same thing as a bug, which is a mistake that makes a system behave incorrectly. A bottleneck can exist in code that is completely correct and bug-free — it simply cannot do its correct work fast enough for the amount of demand being placed on it. It is also not quite the same as a “single point of failure,” which is a component that, if it goes down entirely, takes the rest of the system with it. A bottleneck might never fail outright; it might just quietly slow everyone down, day after day, without ever technically crashing. Both problems matter, but they call for different kinds of fixes, so it is worth keeping the two ideas separate in your head.

Think about a toll booth on a highway. If the toll booth breaks down completely, that is a single point of failure — nobody can pass at all. But if the toll booth works fine and simply takes twenty seconds to process each car, while cars are arriving every five seconds, that is a bottleneck. Nothing is broken. The booth is just too slow for how many cars want to use it, and the backup grows with every passing minute.
Why Bottlenecks Matter So Much
It would be easy to think of a bottleneck as a small, technical annoyance — something engineers quietly fix in the background. In reality, bottlenecks sit right at the intersection of technology, money, and trust. When a system slows down or falls over because of an unnoticed constraint, the effects ripple outward fast.
Lost sales, every second
An online store that grinds to a halt during a big sale does not just annoy shoppers — it loses the sale entirely, often to a competitor’s site that stayed up.
Reputation takes the hit
People remember when an app crashed the one time they really needed it. A single bad experience can undo months of goodwill.
Some systems cannot afford delays
Hospital systems, payment networks, and emergency services cannot treat “a little slow” as acceptable — a bottleneck there has real consequences.
3 a.m. pages
Unresolved bottlenecks tend to resurface at the worst possible times, usually waking up an on-call engineer in the middle of the night.
There is also a quieter, longer-term cost. Teams that never learn to spot bottlenecks early tend to solve the wrong problems — throwing more servers at an issue that was never about server count in the first place, or rewriting code that was never actually slow. Understanding bottlenecks properly saves both money and headaches, because it points effort at the one place that will actually make a difference.
A system is only ever as fast as its slowest necessary step.
There is an important detail hiding in that idea: the cost of a bottleneck almost never grows in a smooth, gentle line. For a long stretch, a system under rising demand can look totally fine — response times barely move, and nobody notices anything different. Then, once demand crosses a certain point, performance can fall off a cliff within minutes. This is one of the most counter-intuitive things about bottlenecks: everything can seem calm right up until the moment it very suddenly is not. That is exactly why waiting for user complaints as your early-warning system is such a risky strategy — by the time people are complaining, the problem is usually already well past the point where it could be fixed quietly and calmly.
Three Ideas You Need First — Throughput, Latency & Capacity
Before going any further, it helps to nail down three words that show up constantly in any bottleneck conversation. They sound technical, but the ideas behind them are things everyone already understands from everyday life.
- Throughput — how many things get done in a given amount of time. Think of it as “cars per minute” crossing a bridge, or “orders per second” a website can process.
- Latency — how long a single thing takes from start to finish. Think of it as how long one specific car takes to cross that same bridge.
- Capacity — the maximum amount of work a component can handle before it starts to struggle. A bridge might be built to comfortably hold 40 cars at once; that number is its capacity.
A bottleneck shows up the moment demand tries to exceed capacity at some point in the system. When that happens, throughput stops growing (it plateaus, no matter how much more traffic arrives) and latency starts climbing, because new requests are forced to wait behind the ones already stuck at the narrow point.
A ten-lane highway that suddenly narrows to a single lane for roadwork behaves exactly like this. It does not matter how fast or wide the highway is on either side — every car has to slow down and take turns at that single lane, and traffic backs up for miles behind it.
There is a fourth idea worth adding to the toolbox: utilization, which is simply how much of a component’s total capacity is currently being used, usually shown as a percentage. A server running at 40% utilization has plenty of breathing room. The same server at 95% utilization is right at the edge — and this is exactly where things get interesting, because the relationship between utilization and latency is not a straight line. As utilization creeps toward 100%, wait times do not just rise gently; they curve sharply upward, almost like a hockey stick. A jump from 70% to 80% utilization might barely be noticeable, while a jump from 90% to 95% can double or triple how long everyone waits. This is one of the most important, and most surprising, lessons in capacity planning: the last little bit of headroom is worth far more than it looks.
The Six Kinds of Bottlenecks
Bottlenecks tend to hide in one of six general places. Knowing these categories makes it much faster to guess where to look first when something starts feeling slow.
1. CPU Bottlenecks
The CPU (the “brain” of a computer) can only do so many calculations per second. When a server is asked to do too much thinking at once — running complex algorithms, resizing thousands of images, or crunching big calculations — the CPU becomes the limiting factor. You will usually notice this as CPU usage sitting near 100% for long stretches, with new tasks stacking up because there is no thinking-power left to give them.
2. Memory (RAM) Bottlenecks
Memory is like a desk where a computer keeps everything it is currently working on, within arm’s reach. When there is not enough desk space, the computer has to start shuffling things onto a much slower “storage shelf” (the hard disk) and back again — a process called swapping. This constant shuffling eats up time that should have gone toward actual work.
3. Disk / Storage Bottlenecks
Every time an app needs to save or read something — a photo, a saved game, a customer record — it talks to a storage drive. Older mechanical hard drives are especially slow at this compared to modern solid-state drives. When many requests try to read or write at once, the drive’s read/write speed becomes the ceiling.
4. Network Bottlenecks
Data has to travel between computers over cables, radio waves, and fibre lines, and all of these have limited bandwidth. When too much data tries to squeeze through at once, or when the distance between two systems is very large, network bottlenecks appear as buffering video, delayed messages, or timeouts.
5. Database Bottlenecks
Databases are often the single busiest part of a system, since almost every feature eventually needs to read or write some piece of data. A missing index, a poorly written query, or too many things trying to write to the same table at once can turn the database into the slowest link in the whole chain — even if every other part of the system is lightning fast.
6. Process & Human Bottlenecks
Not every bottleneck lives inside a machine. Sometimes the constraint is a manual approval step, a single engineer who is the only person who understands a critical piece of code, or a workflow that requires waiting for someone to click “approve” before anything else can happen. These are just as real, and often just as damaging, as a technical bottleneck.
It is worth adding that these six categories are starting points, not strict boxes. Real systems often experience a chain reaction where one bottleneck creates another. A slow database query, for instance, does not just make the database look busy — it also makes the application server look busy, because that server is sitting there holding a connection open and waiting for an answer that has not arrived yet. An engineer glancing only at the application server’s CPU chart might wrongly conclude the server itself needs upgrading, when the real fix belongs entirely inside the database. This is exactly why architects always try to trace a slowdown back to its true origin, rather than fixing whichever symptom happens to be easiest to see first.
| Type | What is actually limited | Common symptom |
|---|---|---|
| CPU | Processing power | Usage stuck near 100%, tasks queue up |
| Memory | Working space | Frequent swapping, sluggish response |
| Disk | Read/write speed | Slow saves and loads under heavy use |
| Network | Data transfer speed | Buffering, timeouts, high latency |
| Database | Query and transaction speed | Slow pages, connection pool exhaustion |
| Process/Human | Decision or approval speed | Work piles up waiting on one person or step |
A useful habit is to ask, for any slowdown, which of these six things is actually running out. “The website is slow” is not a diagnosis — it is just a starting point. “The checkout page is slow because the payments database’s write capacity is exhausted during the last five minutes of every hour when batch reports run” is a diagnosis, and it points directly at a fix. Getting from the vague version to the specific version is the whole craft of bottleneck-hunting.

How Bottlenecks Are Born
Bottlenecks rarely appear out of nowhere. They are usually the quiet result of a system growing past the assumptions it was originally built on. A handful of common origin stories show up again and again.
Success Outgrows the Design
A system built comfortably for a thousand users can behave completely differently once ten thousand, or a million, show up. Code and infrastructure that felt generous at launch can quietly become the tightest point in the system as popularity grows — a strange kind of problem caused by things going well.
An Unexpected Spike
Some traffic surges are entirely out of a team’s control. A product suddenly goes viral on social media, a celebrity is photographed wearing a company’s clothing, or a TV mention sends a flood of curious visitors to a website within minutes. Retailers see this constantly around big shopping events like Black Friday, when traffic levels can run around thirty times higher than an ordinary day, catching under-prepared systems completely off guard.
Hidden Inefficiency in Code
Sometimes the culprit is not a lack of hardware at all — it is a piece of code doing far more work than it needs to. A query that scans an entire table instead of using an index, or a loop that repeats an expensive calculation unnecessarily, can bring a powerful server to its knees even under light load.
One Shared Resource, Too Many Visitors
Modern systems love to share things — a single database, a single cache, a single authentication service — because sharing is efficient most of the time. But a resource built to serve a modest number of visitors can become a chokepoint the moment every single request in the system needs to pass through it.
Imagine a small neighbourhood bakery that was perfectly staffed for its usual regulars. One morning, a famous food reviewer posts about it online, and suddenly two hundred new customers show up. The oven, the counter space, and the till were never designed for that kind of crowd — not because anything broke, but because success arrived faster than the bakery could grow to meet it.
A Chain Reaction From One Small Change
Sometimes a bottleneck forms because of a change that looks completely unrelated at first glance. A new feature that seems harmless — say, showing a “5 people are viewing this item” counter — might quietly add one extra database query to every single page load across the whole site. Multiplied across millions of visits a day, that one small, well-intentioned addition can be enough to tip an already-busy database over its limit. This kind of bottleneck is especially sneaky because nobody set out to cause a slowdown; it arrived as the side effect of a feature that, on its own, looked perfectly reasonable.
A Hidden Dependency Everyone Forgot About
Modern systems rarely stand alone. They lean on payment processors, email providers, authentication services, mapping APIs, and dozens of other outside systems. Every one of those outside connections has its own capacity limits, and it is easy for a team to forget that their beautifully scaled application still has to wait on a third-party service that was never built to handle their new, larger volume of traffic. When that outside dependency slows down, it can look exactly like an internal bottleneck, even though the fix has to happen on someone else’s system entirely — or by adding a buffer, like a queue or a cache, between your system and theirs.
The pattern to notice here is that a bottleneck is almost always relative to load. A component that looks perfectly fine under normal conditions can become the entire system’s weak point the instant conditions change.
Warning Signs to Watch For
Long before a system crashes completely, it usually gives off warning signs. Learning to recognise these early is one of the most valuable skills an engineer or architect can build.
Response times creep up
Pages or API calls that used to take 200 milliseconds start taking 2 or 3 seconds, especially during busy periods.
A stubborn ceiling
No matter how much more traffic arrives, the number of requests handled per second refuses to climb any higher.
Timeouts and 5xx errors
Requests start failing outright instead of just being slow, often showing up as “server busy” or “gateway timeout” messages.
Growing backlogs
Message queues, connection pools, or task lists start growing faster than they can be drained.
One especially useful habit is to stop trusting average response time on its own. Averages hide the worst experiences. A system reporting a smooth 300-millisecond average might still be leaving one in every hundred visitors waiting eight full seconds. Architects prefer to look at percentiles instead — figures like the 95th or 99th percentile — because they reveal how bad the slowest requests really are, which is usually where the bottleneck’s true damage is hiding.
A system that looks perfectly healthy on a quiet Tuesday afternoon but has never actually been tested under real peak conditions. Calm weather does not prove a ship is seaworthy.
It also helps to watch the metrics as a group rather than one at a time, since bottlenecks tend to leave fingerprints across several signals at once. The table below lists a few combinations engineers commonly look for.
| Pattern observed | What it usually means |
|---|---|
| High CPU + rising latency | The processor itself is the constraint |
| Low CPU + rising latency | Requests are waiting on something else — often a database or an outside service |
| Rising memory + occasional crashes | Possible memory leak or undersized memory allocation |
| Growing queue length + steady processing rate | Arrivals have outpaced the system’s ability to keep up — see Little’s Law later in this guide |
| Fine for most users, terrible for a few | A percentile problem — check the 95th/99th percentile, not just the average |
How Architects Hunt Bottlenecks Down
Finding a bottleneck is part science, part detective work. Architects and engineers lean on a handful of tried-and-tested techniques, usually combining several of them rather than relying on just one.
1. Set a baseline
Measure how the system behaves under normal, everyday conditions first. Without a baseline, there is nothing to compare “slow” against.
2. Monitor resources continuously
Track CPU, memory, disk, and network usage over time with tools like Prometheus, Grafana, or Datadog, watching for sustained spikes rather than brief blips.
3. Run load and stress tests
Deliberately simulate heavy traffic with tools such as JMeter, k6, Gatling, or LoadRunner to see exactly where the system starts to buckle before real users ever find out.
4. Profile the code
Use a profiler to see precisely which functions, queries, or code paths are eating up the most time and memory, rather than guessing.
5. Trace requests end to end
In systems built from many small services, distributed tracing follows a single request across every service it touches, revealing exactly which hop added the delay.
6. Study the logs
Error logs and slow-query logs often contain the answer in plain sight — repeated timeouts, retries, or a single query that always shows up at the top of the “slowest queries” report.
Finding a bottleneck is a lot like a doctor diagnosing a patient. You do not just guess and start treatment — you check vital signs (monitoring), run tests under controlled conditions (load testing), and look closely at the specific area that is causing pain (profiling) before deciding on a treatment plan.
| Goal | Typical tools |
|---|---|
| Resource monitoring | Prometheus, Grafana, Datadog, New Relic |
| Load & stress testing | Apache JMeter, k6, Gatling, LoadRunner |
| Code profiling | VisualVM, YourKit, pprof, Scalene |
| Database analysis | SQL Profiler, slow-query logs, execution plans |
| Distributed tracing | Jaeger, Zipkin, OpenTelemetry |
The most reliable diagnoses combine at least two of these approaches. Monitoring tells you something is wrong and roughly when. Profiling and tracing tell you exactly where. Load testing lets you reproduce the problem safely, before it happens to real users on a real Friday night.
Two more habits round out a mature detection toolkit. Application Performance Monitoring (APM) tools go a step further than basic resource dashboards by stitching together everything happening inside a single request — the database calls it made, the outside APIs it touched, and how long each step took — into one readable timeline. And synthetic monitoring flips the usual approach around: instead of waiting for real users to hit a slow spot, automated robots continuously perform the same key actions (like logging in or checking out) around the clock, from multiple locations, so a bottleneck can be caught within minutes of appearing rather than discovered through a wave of angry reviews the next morning.

Measure first, guess second — never the other way around. A confident guess about where the bottleneck lives is right just often enough to be dangerous.
Bottlenecks Hiding Inside Common Architecture Patterns
The way a system is structured has a big influence on where its bottlenecks tend to appear. Here is how a few well-known architecture styles typically meet their limits.
Monolithic Applications
A monolith keeps all the logic — the user interface, the business rules, the data access — bundled into one deployable application. It is simple to build and reason about, but everything shares the same pool of CPU and memory. One heavy feature, like generating a big report, can slow down completely unrelated features running on the same machine at the same time.
Microservices
Breaking a system into many small, independently deployable services solves the “everything shares one pool” problem, since each service can scale on its own. But it trades that problem for a new one: every call between services now travels over a network, and each hop adds a little latency. A single overloaded service — say, the one responsible for checking inventory — can quietly become the bottleneck for every other service that depends on it.
Client-Server Systems
In the classic setup where many clients talk to one central server, that server is a natural bottleneck by design. It works fine until the number of clients grows past what a single server (or even a small cluster) can comfortably handle.
Event-Driven Systems
Here, components announce that something happened instead of calling each other directly, which is great for handling bursts gracefully. The bottleneck tends to shift toward the message broker itself, or toward whichever “listener” is slowest to process the flood of events it has been handed.
Serverless / Function-Based Systems
In a serverless setup, individual functions spin up automatically to handle each request and disappear when they are done, which can feel like it removes the whole idea of a fixed-capacity bottleneck. In practice, the constraint just moves further down the chain — to a maximum number of functions allowed to run at once, to a shared database that all those functions still have to talk to, or to the brief “cold start” delay a function faces the very first time it wakes up after being idle.
Batch and Data Pipeline Systems
Systems built to process huge volumes of data in scheduled batches — like an overnight report job — have their own particular bottleneck pattern. Here, the limiting factor is often not speed under live user traffic, but how much data can be read, transformed, and written within a fixed time window. A pipeline that takes eleven hours to run a job scheduled for a ten-hour window is, quite literally, out of time before it is out of resources.

What patterns give you
- Knowing the pattern narrows down where to look.
- Most patterns have well-known scaling playbooks.
- Bottlenecks are predictable, not random.
What patterns cost you
- Every pattern has a natural weak point somewhere.
- Fixing one bottleneck can shift the pressure elsewhere.
- There is no pattern that is immune to overload.
A bottleneck rarely disappears when you fix it — it usually just moves to the next weakest point in line. Solving performance problems is often an ongoing relay race, not a one-time victory.
Fixing a Bottleneck
Once a bottleneck has been found, there are a handful of proven strategies for relieving it. Which one fits best depends entirely on which type of bottleneck it is.
Vertical Scaling — Give It a Bigger Engine
The simplest fix is often to give the struggling component more resources: a faster CPU, more RAM, a quicker disk. It is quick to do and requires no redesign, but there is always a ceiling — eventually you run out of bigger machines to buy, and a single point of failure remains a single point of failure no matter how powerful it is.
Horizontal Scaling — Add More Helpers
Instead of making one component bigger, this approach adds more copies of it and spreads the work across all of them, usually with the help of a load balancer directing traffic to whichever copy has room. This scales much further than vertical scaling but requires the component to be designed so that many copies can work together correctly.
Caching — Stop Doing the Same Work Twice
A cache keeps a fast, temporary copy of information that is expensive to fetch or compute, so the next request can be answered almost instantly instead of repeating all that work. This is one of the single most effective fixes for database bottlenecks, since it is common for a small handful of items — like a homepage’s most popular products — to be requested over and over again.
Content Delivery Networks (CDNs)
A CDN stores copies of images, videos, and files on servers scattered around the world, so a visitor in Tokyo does not have to wait for data to travel all the way from a server in Ohio. This shrinks network bottlenecks caused purely by physical distance.
Database Optimisation
Adding the right index can turn a query that scans a million rows into one that finds its answer almost instantly. Splitting a single huge database into smaller pieces — called sharding — spreads the load across multiple machines instead of asking one database to do everything.
Asynchronous Processing & Queues
Not every task needs to happen instantly while a user waits. Sending a confirmation email, resizing an uploaded photo, or generating a report can be handed off to a background queue, letting the user move on immediately while the heavier work happens quietly behind the scenes.
Rate Limiting & Traffic Shaping
Sometimes the healthiest fix is not to serve every request instantly, but to politely control the pace at which they arrive — similar to a store using a single line with numbered tickets instead of letting everyone crowd the counter at once. Many large retailers use virtual waiting rooms during huge sales events for exactly this reason, protecting the system by controlling inflow rather than trying to absorb an unlimited flood.
Connection Pooling
Opening a fresh connection to a database is surprisingly expensive — a bit like introducing yourself to a stranger from scratch every single time you want to ask a question, instead of just continuing a conversation you already started. A connection pool keeps a small set of ready-to-go connections open and reuses them, which removes a huge amount of unnecessary overhead when traffic is heavy.
Read Replicas
Many applications read data far more often than they write it — think of how often you scroll a social media feed versus how often you actually post something. A read replica is a copy of the database that only handles reading, freeing the main database to focus on writing, and letting read-heavy traffic scale out across as many replica copies as needed.
Circuit Breakers & Backpressure
When one component starts to slow down, it is tempting for everything that depends on it to just keep hammering away, hoping it recovers — but this often makes things worse, piling on load exactly when the struggling component needs relief. A circuit breaker temporarily stops sending requests to a component that is clearly struggling, giving it room to recover, similar to how a fuse box cuts power before wires get dangerously overloaded. Backpressure works alongside this idea by letting a slow component signal upstream, “I cannot keep up right now — please slow down,” instead of silently drowning in more work than it can handle.
Right tool, right problem
- Caching: repeated reads of the same popular data.
- Horizontal scaling: traffic that keeps growing over time.
- Queues: work that does not need an instant answer.
What each fix costs
- Caching can serve slightly outdated data.
- Horizontal scaling adds operational complexity.
- Queues introduce a short delay by design.
Real-World Case Studies
Nothing illustrates a bottleneck like watching a real system meet its limit. These stories, drawn from well-documented public incidents, show how differently the same basic problem — demand outrunning capacity — can play out.
An overstock sale meets an international audience
One Canadian retailer’s weekly discount sale happened to fall on a major U.S. holiday it had not planned for. A wave of unexpected shoppers arrived all at once, and the checkout process buckled under the surge, leaving many customers unable to complete their orders for hours. The underlying issue was not broken code — it was infrastructure sized for a much smaller, more predictable crowd.
A free giveaway overwhelms a mobile app
A fast-food chain once offered a free item through its app and website for a single day. The promotion worked exactly as intended — almost too well. So many customers tried to redeem the offer simultaneously that the ordering system buckled, turning a marketing win into a lesson about testing for worst-case demand, not just expected demand.
One photo, one website, one afternoon
Small and mid-sized retailers have repeatedly discovered that a single celebrity appearing in their clothing can send more visitors to their website in an hour than they normally see in a month. Systems sized for everyday traffic have little chance against that kind of instantaneous, unpredictable spike unless they were specifically built to scale on demand.
Millions of fans, one midnight release
When a globally anticipated album dropped at midnight, an enormous number of fans opened the app at the exact same moment to listen and save it to their playlists. The sheer concurrency of everyone hitting “save” simultaneously pushed one part of the system’s cluster past its limit, causing a short but very visible outage before things stabilised.
Millions of verified fans, one queueing system
A record-breaking concert tour’s ticket presale drew millions of verified fans hoping to buy seats at the same moment. The queueing and inventory-locking systems behind the scenes were not tuned for that scale of simultaneous demand, and the resulting slowdown became one of the most talked-about technology failures of the year.
When the bottleneck is not even your own system
Several major websites once went offline together not because of anything they did, but because they all relied on the same outside domain-name provider, which was hit by a massive coordinated attack. It is a reminder that a bottleneck can live entirely outside your own infrastructure, in a shared dependency everyone quietly relies on.
A mobile game rockets past every install estimate
An augmented-reality mobile game once passed ten million installs within its very first week of release. Server capacity had been planned around launch-day projections, not around a genuine global phenomenon, and players around the world found themselves repeatedly disconnected as the back-end struggled to keep pace with far more simultaneous players than any forecast had anticipated.
Thousands of students, one login window
A university admissions clearing system once saw a wave of logins on results day that comfortably beat every previous year’s peak. The system briefly returned server-busy errors to visitors until its auto-scaling setup finished spinning up extra capacity roughly fifteen minutes later — a reminder that scaling systems still need a moment to react, and that moment matters most exactly when everyone is watching.
Almost none of these companies were “bad” at engineering. Each system worked perfectly well for ordinary days. The bottleneck only became visible once demand jumped far outside the range anyone had planned or tested for.
A Little Bit of Queueing Theory
There is a simple, almost magical piece of math that explains why bottlenecks behave the way they do, called Little’s Law. It states that, on average, the number of things waiting in a system equals the rate at which they arrive multiplied by how long each one stays.
What this quietly tells us is unsettling in a useful way: if requests arrive faster than the system can finish them (even by a small amount), the queue does not just grow — it grows without limit. There is no stable “slightly overloaded” state a system can sit in forever. Either capacity is greater than demand and the queue stays manageable, or demand creeps past capacity and the wait time climbs and climbs until something breaks or someone intervenes.
Think of a water park’s most popular slide. If a new rider steps onto the ladder every ten seconds, but each ride (climb, wait, slide, walk back around) takes two full minutes, the line at the ladder will keep growing all day long — even though the slide itself works perfectly. The slide was never broken; there just was not enough of it to match how many people wanted a turn.
This is exactly why architects care so much about testing systems before demand exceeds capacity, rather than reacting after the queue has already spiralled. Once a real system tips past its limit, it often needs demand to drop significantly below normal before it can fully recover — which is why a short, sharp traffic spike can sometimes cause an outage that lasts far longer than the spike itself.
This “hangover effect” catches a lot of teams by surprise. Say a burst of traffic causes requests to start timing out. Frustrated users, seeing an error, often do the very human thing: they hit refresh, sometimes two or three times. Each of those retries is a brand-new request added to an already-overwhelmed queue, which makes the backlog even worse, which causes more timeouts, which causes more retries. This spiral has a name — a retry storm — and it is one of the reasons a bottleneck that first appears for just a minute or two can sometimes take twenty or thirty minutes to fully calm back down, even after the original burst of legitimate traffic has passed.
A little bit of spare capacity is disproportionately valuable. Running comfortably below 100% utilization is not wasteful — it is the buffer that keeps a temporary spike from turning into a spiral.
Preventing Future Bottlenecks
Finding and fixing today’s bottleneck is important, but the more valuable long-term skill is building habits that catch tomorrow’s bottleneck before it ever reaches real users.
Capacity Planning
Rather than reacting after a bottleneck bites, mature teams estimate future demand ahead of time — factoring in seasonal spikes, marketing campaigns, and expected growth — and test their systems against those numbers well in advance.
Fitness Functions
Some teams build small, automated checks that continuously verify performance targets are still being met, the same way a regular health check-up catches a problem early rather than waiting for a crisis. These checks run constantly, quietly comparing today’s system against yesterday’s baseline.
Chaos and Failure Testing
Deliberately breaking small parts of a system on purpose, in a controlled way, reveals how the rest of the system copes — and often uncovers a hidden bottleneck long before real customers ever stumble into it.
Design for Graceful Degradation
Not every feature needs to survive a traffic spike at full strength. A well-designed system can quietly turn off “nice to have” features — like personalised recommendations — to protect the “must have” ones, like checkout, during extreme load.
Blameless Post-Mortems
After a bottleneck causes real trouble, the most valuable thing a team can do is sit down and honestly walk through what happened, without pointing fingers at any one person. The goal of this kind of review is not to assign blame — it is to answer three simple questions: what actually happened, why did our existing safeguards not catch it sooner, and what specific, concrete change will make it less likely to happen again. Teams that treat these reviews as blameless tend to uncover far more honest, useful detail than teams where people are worried about getting in trouble for admitting a mistake.
Written Playbooks for the Bad Day
When a bottleneck does strike despite every precaution, the teams that recover fastest are usually the ones who wrote down what to do before the emergency, not during it. A short, clear runbook — which dashboard to check first, which switch to flip to shed non-essential load, who to notify — turns a panicked scramble into a calm, practised routine, the same way a fire drill makes a real fire far less chaotic than it would otherwise be.
Test at several times your expected peak, not just your expected peak. Real-world spikes have a habit of arriving bigger than anyone predicted.
Common Pitfalls When Dealing With Bottlenecks
Fixing the Wrong Component
It is tempting to upgrade the biggest, most expensive-looking part of a system first, assuming that is where the trouble lives. Without proper measurement, teams sometimes spend weeks scaling a server that was never the actual constraint, while the real bottleneck — a single unindexed database query — sits untouched.
Chasing Averages Instead of the Tail
A dashboard showing a comfortable average response time can hide a painful experience for a meaningful slice of users. Ignoring the slowest percentile of requests means the bottleneck’s real damage stays invisible.
Assuming One Fix Is Permanent
Solving a bottleneck rarely makes a system bottleneck-free forever — it usually just raises the ceiling until the next constraint takes over. Treating performance work as a “one and done” task rather than an ongoing practice sets a team up for a repeat surprise.
Testing Only the Happy Path
A system tested only under gentle, predictable conditions has never really been tested at all. The moments that matter most — a huge sale, a viral post, a holiday rush — are exactly the conditions most teams forget to simulate.
Optimising a Part That Is Not the Bottleneck
Speeding up a component that already has plenty of spare capacity feels productive, but it does nothing for overall performance if that component was never the constraint in the first place. Any time spent optimising a non-bottleneck is time the real bottleneck goes on quietly limiting everything else. This is easy to forget because optimising the part you already understand well is usually more comfortable than digging into the part that is actually causing the trouble.
Silence from monitoring during a big event is not proof everything is fine — it might just mean nobody is watching the right metric. Absence of alarms is not the same thing as absence of problems.
Frequently Asked Questions
Is a bottleneck always a bad thing?
Not necessarily. Every system has some component that is relatively the slowest — that is unavoidable, in the same way every relay team has one runner who is marginally slower than the others. A bottleneck only becomes a genuine problem once it is slow enough, relative to actual demand, to noticeably hurt the experience or cost real money. Spending resources chasing a bottleneck that nobody actually notices is its own kind of waste.
Can you ever remove a bottleneck completely?
You can relieve today’s bottleneck, but a system will always have some component that is comparatively the most constrained, even if it is now far beyond what any realistic amount of traffic would ever reach. The goal is not a mythical bottleneck-free system — it is making sure the current bottleneck sits comfortably above the demand you actually expect, with healthy room to spare.
How is a bottleneck different from “the system is slow”?
“The system is slow” describes a symptom that anyone can notice. “There is a bottleneck at the payment database’s write capacity” describes a cause that points directly at a fix. Learning to move from the vague symptom to the specific cause is really the whole point of this entire guide.
Do small applications need to worry about this?
Yes, just at a smaller scale. A hobby project with a handful of visitors a day can still hit a bottleneck — for example, a shared free-tier database that only allows a small number of connections at once. The underlying ideas of capacity, throughput, and queueing apply just as much to a tiny personal blog as they do to a billion-dollar retailer; only the numbers involved are different.
What is the single best first step if I suspect a bottleneck?
Measure before you touch anything. Pull up resource monitoring for CPU, memory, disk, network, and database performance, and look for whichever one is sitting closest to its limit while the slowdown is happening. Resist the urge to guess and start changing things — a bottleneck found through measurement gets fixed once; a bottleneck “fixed” through guesswork often gets fixed several times before someone finally measures it properly.
Key Takeaways
Bottlenecks are not a sign that a team did something wrong. They are a natural, almost mathematical consequence of building anything popular enough that demand keeps growing. The systems that hold up the best over the years are not the ones that never hit a bottleneck — every large, successful system eventually does. They are the ones whose teams built the habit of measuring honestly, fixing the right thing, and treating performance as an ongoing conversation rather than a box to check once and forget.
Remember This
- The slowest step sets the pace. A bottleneck is the single slowest, most constrained part of a system — it caps everything that depends on it, even if every other part is fast.
- Six places to look. Bottlenecks hide in CPU, memory, disk, network, databases, or even in a single overworked human step.
- Throughput plateaus, latency climbs. Once demand outgrows a component’s capacity, that is the earliest and clearest sign something is wrong.
- Measure before you touch. Reliable diagnosis takes monitoring, load testing, profiling, and tracing — not guesswork.
- Match the fix to the type. Vertical scaling, horizontal scaling, caching, CDNs, database tuning, queues, and traffic shaping each suit a different kind of bottleneck.
- Fixing shifts, not removes. Fixing one bottleneck usually shifts the pressure to the next weakest point — performance work is an ongoing habit, not a one-time project.
- Test for the worst day. Testing for worst-case demand, not just average demand, is what separates systems that survive a viral moment from those that do not.
The teams that stay ahead of bottlenecks are usually not the ones with the largest budgets or the most exotic technology. They are the ones who have made measuring, questioning, and rehearsing the bad day part of their normal week. Every well-known outage in this guide was preventable in hindsight; the real skill is building the small daily habits that turn that hindsight into foresight, so the next unusual traffic spike is met by a calm, prepared system rather than a scrambling one.

