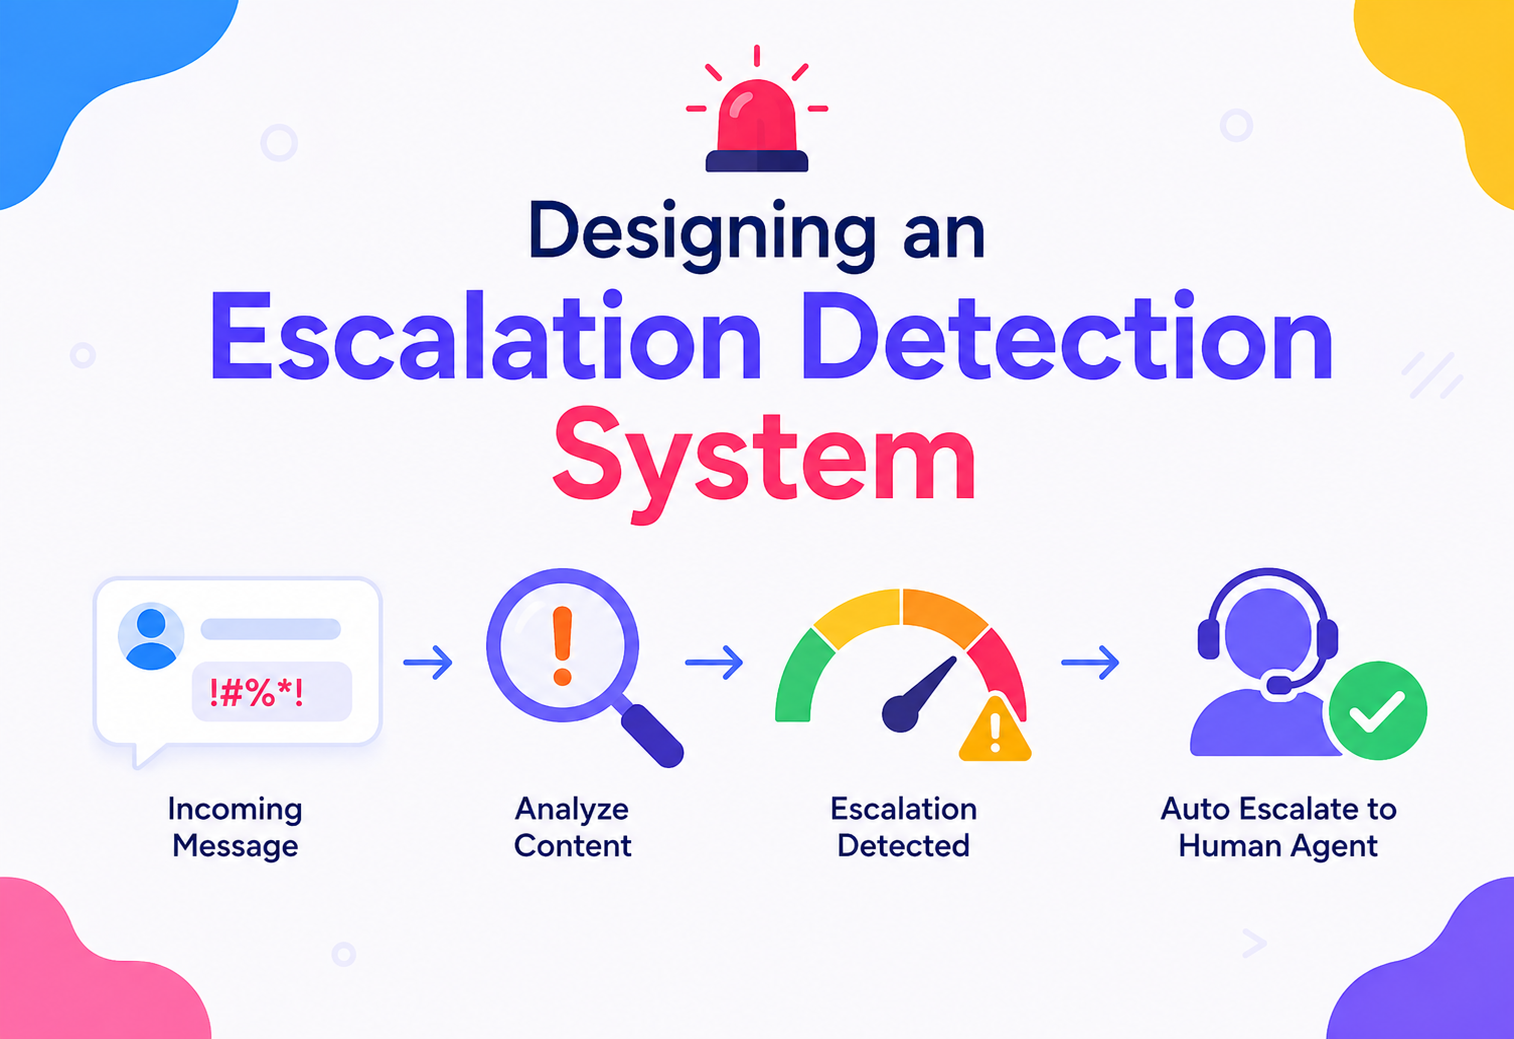
Designing an Escalation Detection System
A complete, ground-up walkthrough of how modern support, trust & safety and incident-response platforms detect — in real time — when a conversation, ticket or alert must be handed off to a human, a senior agent or an on-call responder. From the first signal to the routed hand-off, at global scale.
The Big Idea, in One Breath
An escalation detection system is a real-time decision service that watches a stream of events — support chats, tickets, monitoring alerts, safety reports — and answers a single question, thousands of times a second: “does this need to be handed off to a human, a senior, or an on-call responder, right now?” If the answer is yes, it fires an escalation with a reason, a severity and a routing target.
It is a small, focused system with an outsized impact: get it wrong in one direction and angry customers wait, incidents burn out of control, and safety events go unreported. Get it wrong in the other direction and human agents drown in false positives, on-call engineers get woken up for nothing, and the whole team stops trusting the system.
Think of a hospital triage nurse. Patients arrive with symptoms of every shape and severity. The nurse does not treat them — she decides, in seconds, whether someone waits in the lobby, sees a general practitioner, or is rushed straight to the trauma bay. An escalation detection system is the triage nurse of a digital operation: it never resolves the problem, it decides who resolves it and how fast.
per event
escalations
escalation rate
What Escalation Detection Really Is
Before we design one, we need to pin down what the system does and, more importantly, what it does not do. Escalation detection is a decision component, not a resolver — and understanding that boundary is what keeps the design honest.
2.1 A Working Definition
An escalation detection system is a service that, given a continuous stream of events belonging to a “case” (a chat, a ticket, an alert, a report), continuously evaluates whether:
- the case has crossed a severity threshold that requires a human or a more senior human,
- the case has been waiting too long for the class of person currently handling it,
- a specific keyword, entity or user attribute makes the case sensitive (legal, VIP, self-harm, security), or
- an SLA / policy rule mandates escalation regardless of content.
When any of those trigger, it emits an escalation event: { caseId, reason, severity, routeTo, dedupeKey, evidence }. Downstream systems (routing, paging, ticket workflow) act on that event.
2.2 Familiar Places You See It
Customer Support Chat
Detects angry, confused or high-value customers and escalates from a bot or L1 agent to an L2 specialist — often before the customer even asks.
On-Call & SRE
Watches alert flurries, correlates them into an incident, and pages the right rotation with the right severity when patterns match a real outage.
Content Moderation
Sends flagged content, self-harm signals, or CSAM candidates directly to specialised human reviewers instead of the general moderation queue.
Fraud & Compliance Ops
Escalates suspicious transactions to KYC/AML analysts when rule confidence, model score or regulatory trigger crosses a defined line.
2.3 What It Is Not
Escalation detection is not the same as routing, ticketing or paging. Those systems consume its output; they do not replace it. It is also not a general-purpose classifier — it is a focused classifier whose only decision is “escalate: yes/no, and to whom.”
A resolver solves a problem. A router moves a problem. An escalation detector decides that a problem now belongs to a different, more capable owner — and provides the evidence that justifies the hand-off.
Why It Matters So Much
Escalation is the moment where cheap automation stops working and expensive human attention takes over. Deciding when that hand-off happens is one of the highest-leverage decisions in any operations organisation — and it happens millions of times a day.
3.1 The Business & Human Problem
- Customer trust collapses when a frustrated user has to repeat themselves to three agents. Detecting escalation early keeps trust intact.
- Operational cost is dominated by human time. A wrong escalation wastes a senior agent’s minute; a missed escalation wastes hours of everyone’s time.
- Regulatory exposure in finance, healthcare and safety domains creates hard obligations: certain cases must be seen by a specific role within a specific SLA.
- Employee well-being depends on it: agents burn out when they receive too many false escalations, and on-call engineers quit when they are woken up for noise.
3.2 What Makes It Uniquely Hard
Why it’s harder than classification
- The signal accumulates over time — you must decide continuously, not once.
- Ground truth is delayed and messy: you only know whether escalation was correct hours or days later.
- The cost of a false negative and a false positive are asymmetric and case-dependent.
Why it’s harder than alerting
- Signals are multi-modal: text sentiment, latency, error rates, user profile, policy.
- Policies change frequently and must be auditable.
- Explanations are required — you cannot escalate a legal matter without evidence.
Every missed escalation is a customer, an incident, or a safety event you learned about too late. Every false escalation is a human minute you cannot get back. The system exists to compress the time between “something is wrong” and “the right person is on it” — with as few wrong hand-offs as possible.
The Building Blocks
A production escalation detection system is a small constellation of focused components. Each has one job. The magic is in how they compose.
Event Ingestion
Consumes chats, tickets, alerts and telemetry from source systems via Kafka, Pub/Sub or webhooks. Normalises them into a common event schema.
Case Store (State)
Holds the running state of every open case: message history, current owner, timers, feature aggregates. Usually a low-latency KV (Redis, DynamoDB).
Feature Extractor
Turns raw events into numeric/categorical features: sentiment score, wait time, VIP flag, error-rate delta, keyword hits, entity mentions.
Rule Engine
Evaluates deterministic policies: SLA breach, keyword triggers, compliance rules. Fast, auditable, easily changed by non-engineers.
ML Scorer
Runs a trained model (gradient-boosted trees, small transformer, LLM) to score escalation likelihood. Adds nuance the rules cannot express.
Decision Fuser
Combines rule and ML outputs into a final decision with reason codes, confidence and a suggested route.
Escalation Publisher
Emits an escalation event to routing / paging / ticketing, with dedupe keys so the same case is not escalated twice.
Feedback Loop
Captures agent/on-call outcomes (accept, reject, resolved-by-role) and writes labelled data back for retraining and rule tuning.
Policy Registry
Versioned store of rules, thresholds, and model bindings. Every escalation records the exact policy version that fired it.
Observability
Metrics (rate, precision, recall), logs (per-decision trace), and dashboards for ops teams to see and challenge decisions.
Here is how these pieces typically fit together at a glance:

Signals & Feature Engineering
Every design decision downstream depends on the signals we extract upstream. Weak features guarantee weak decisions, no matter how clever the rule engine or model. This chapter catalogues the signals that actually move the needle.
5.1 The Four Signal Families
Content Signals
Extracted from the text/audio itself: sentiment, toxicity, keyword hits, entity mentions (products, laws, self-harm terms), embeddings for semantic search.
Behavioural Signals
How the case is unfolding: message count, back-and-forth ratio, wait time, agent handoff count, re-open flag, time-of-day, repeat contact within 24h.
Identity & Context Signals
Who is involved: VIP flag, plan tier, region, tenure, prior escalation history, related open incidents, product area.
System & Telemetry Signals
What the surrounding platform looks like: current error rate for that product, correlated alerts, deploy in progress, ongoing outage flag.
5.2 A Minimal Feature Vector
{
  "case_id"          : "c_9f2a",
  "channel"          : "chat",
  "duration_s"       : 412,
  "msg_count"        : 27,
  "agent_msg_ratio"  : 0.38,
  "sentiment_min"    : -0.82,
  "sentiment_slope"  : -0.14,
  "toxicity_max"     : 0.71,
  "keyword_hits"     : ["refund", "manager", "legal"],
  "customer_tier"    : "enterprise",
  "prior_escalations": 2,
  "product_error_rate_5m": 0.031,
  "wait_since_last_agent_s": 96,
  "policy_flags"     : ["sla_breach_L1"]
}
5.3 Streaming vs Windowed Features
Some features are computed per-event (last sentiment, latest keyword). Others are computed over rolling windows (message count last 60 s, sentiment slope last 5 turns). A hybrid state store — hot per-case in Redis, cold aggregates in a feature store — keeps both cheap.
Two rules of thumb: never let a feature exceed 20 ms to compute at P99, and never build a feature you cannot explain to an ops manager in one sentence. If a feature is fast and explainable, both the rule engine and the ML model can use it, and escalations remain auditable.
Detection Patterns: Rules, ML, and Hybrid
Once you have features, there are three broad families of detectors that turn them into a decision. Each has a distinct sweet spot; almost every mature system uses all three in combination.
6.1 Deterministic Rules
Simple IF condition THEN escalate statements evaluated by a rule engine (Drools, Open Policy Agent, or a bespoke DSL). They are:
- Fast — sub-millisecond evaluation.
- Auditable — each rule’s version and firing evidence is logged.
- Editable by non-engineers — ops managers can tune thresholds without a deploy.
- Weak at nuance — they miss subtle signals like sarcasm or accumulating frustration.
6.2 Machine-Learning Scorers
A trained model consumes the feature vector and outputs an escalation probability. Common choices:
| Model | Strengths | Where it fits |
|---|---|---|
| Gradient-boosted trees (XGBoost, LightGBM) | Great with mixed tabular features, cheap, explainable | General escalation likelihood scorer |
| Small transformer / distilled encoder | Understands conversational text well | Sentiment / intent / frustration on chat text |
| Large LLM | Zero/few-shot on novel patterns; can produce reason | Complex cases, rare intents, human-review support |
| Anomaly detector (Isolation Forest, autoencoder) | Catches never-seen patterns | Incident / telemetry escalation |
6.3 The Hybrid That Actually Ships
Real systems do not choose between rules and ML — they layer them:
features = extract(case, event)

// 1. hard policy rules always win
if rule_engine.mustEscalate(features):
    return escalate(reason=rule.reason, route=rule.route, confidence=1.0)

// 2. hard suppression rules also win
if rule_engine.mustSuppress(features):
    return noop

// 3. ML fills the grey zone
p = ml_scorer.predict(features)
if p > policy.threshold(features.tier, features.channel):
    return escalate(
        reason   = ml.topReasons(features),
        route    = router.suggestFor(features, p),
        confidence = p
    )

return noopRules encode the things you are legally or contractually required to escalate. ML encodes the things you have learned from experience to escalate. Never let the ML override a hard rule — and never let a rule quietly override the ML without logging why.
Streaming vs Batch, Monolith vs Distributed
There are two orthogonal architectural axes to pick early: how often we evaluate a case, and how the compute is spread across machines. Both decisions have long tails you cannot easily undo.
7.1 Streaming, Micro-Batch, or Batch?
Streaming (event-at-a-time)
- Best latency — escalate within the same second as the trigger.
- Higher engineering cost: exactly-once, stateful processing, back-pressure.
- Right for chats, on-call alerts, safety events.
Micro-batch / Batch
- Cheaper and simpler, but decisions arrive seconds to minutes later.
- Good for “end-of-shift review” escalations or nightly compliance sweeps.
- Never good enough for user-facing conversation escalation.
7.2 Monolith vs Distributed
| Shape | When it fits | Trade-offs |
|---|---|---|
| Single deployable service | < 100 evt/s, small team, one channel | Fast to build; caps at one machine’s throughput |
| Stream processor (Flink / Kafka Streams) | > 1k evt/s, per-case state, multi-tenant | Great throughput; ops-heavier; exactly-once by construction |
| Actor / stateful service (Orleans, Akka) | Long-lived cases with rich state | Clean per-case model; needs sharding & failover |
| Serverless functions | Very bursty, low sustained traffic | Cheap at rest; cold starts hurt sub-second SLAs |
7.3 Sharding Strategy
All ordering matters at the case level, not globally. So the system partitions the input topic by caseId (Kafka key = caseId), and each partition is consumed by exactly one worker instance. This guarantees per-case ordering, keeps state co-located, and scales horizontally by adding partitions.
A single “mega-case” (huge outage chat room, viral safety incident) can saturate one partition. Detect hot cases early and either fan-out to multiple sub-workers or downsample low-value features for that case.
What the Detector Actually Does: End-to-End Walkthrough
Enough abstract talk. Let us follow one real event — a frustrated customer’s tenth message on a chat — from the moment it arrives to the moment a senior agent is paged.
Event lands in Kafka
The chat platform publishes a message.created event keyed by caseId=c_9f2a. It carries text, author, timestamp and channel metadata.
Consumer loads case state
The detection worker for that partition looks up case state in Redis: message history summary, running sentiment, timers, ownership.
Feature extraction
Sentiment model scores the text at −0.82. Keyword extractor flags “manager” and “refund.” Feature aggregates are updated: sentiment_slope=-0.14, msg_count=10, wait_since_last_agent_s=96.
Rule engine fires first
The rule enterprise_customer_asks_for_manager matches. Rule engine returns escalate=true, reason=policy.vip_manager_request, route=L2/en/enterprise.
Deduplication check
The publisher checks the dedupe store: c_9f2a has no active escalation. It creates one and mints an escalationId.
Escalation event emitted
An escalation.opened event is written to the outbound topic with reason codes, feature snapshot, model & policy versions and suggested route.
Downstream systems react
Routing service moves the conversation to an L2 queue. Paging system pings the on-shift senior agent. The chat UI shows a “senior agent joining” banner.
Outcome captured
Minutes later the senior agent resolves the case. A resolution event flows back to the feedback pipeline with a “true positive escalation” label, feeding tomorrow’s model retraining.
Quality Attributes: The “-ilities”
The non-functional targets for an escalation detection system look unlike any other service. Speed matters, but so does explainability, and so does the emotional experience of the humans on the receiving end.
Latency
Decision within 300 ms P95 of event arrival for interactive channels (chat, on-call). Batch channels can afford seconds.
Throughput
Design for 10× peak traffic. A single celebrity outage can produce a decade of normal event volume in an hour.
Precision & Recall
Optimise recall for hard rules (miss nothing legally required). Balance for ML-driven soft escalations to protect agent trust.
Explainability
Every escalation carries reason codes, evidence, model & policy version. An ops manager can audit any decision within seconds.
Reliability
Exactly-once escalation emission per case-per-reason within a window. No duplicates and no silent drops.
Scalability
Sharded by caseId. Add partitions to add throughput; auto-scale on lag, not CPU.
Availability
Degrade gracefully: if the ML scorer is down, rules still fire; if features are stale, decisions are made with a “degraded” flag.
Human Trust
Frontline agents and on-call engineers must feel the system is on their side. Their feedback must visibly change behaviour within a release cycle.
9.1 The Latency Budget
| Hop | Target | How |
|---|---|---|
| Ingestion → worker | < 50 ms | Kafka in-region, small batches, tuned commit interval |
| Load case state | < 5 ms | Redis with in-memory replica per shard |
| Feature extraction (all) | < 80 ms | Parallel calls; sentiment model on GPU or distilled CPU |
| Rule evaluation | < 3 ms | Compiled ruleset in memory |
| ML scoring | < 40 ms | Boosted-tree model, batch of 1, warmed process |
| Publish & dedupe | < 20 ms | Idempotent write to outbound topic |
| Total decision | ~200–300 ms P95 | Well under human perception for chats and alerts |
Common Pitfalls & Trade-offs
Almost every escalation system, in production, gets bitten by the same handful of anti-patterns. Knowing them up front turns weeks of firefighting into a paragraph in a design review.
10.1 Ten Traps We’ve All Fallen Into
No dedupe key
The same case gets escalated on every event, paging the on-call five times in five minutes. Every escalation needs a case+reason+window dedupe key.
Threshold hard-coded in code
Ops cannot tune it without a deploy, so thresholds drift for months out of date. Always externalise thresholds into the policy registry.
ML model with no reason codes
Agents receive an escalation with no explanation, lose trust, and start ignoring it. Always attach top features / rule matches as reasons.
Silent failure of a feature
The sentiment service goes down, feature returns 0, escalations quietly drop. Emit “degraded feature” metrics and fall back to rules-only mode.
No feedback loop
Nobody labels agent outcomes, so the model never learns. Wire outcome capture in before shipping the first ML model.
Retraining on biased data
You only see labels for cases that were escalated. The model becomes ever more confident about the type of case it already catches, and blind to new ones. Sample unescalated cases for label collection.
Global thresholds for global business
An enterprise VIP threshold applied to free-tier users floods the queue. Threshold must be a function of tier, channel and hour-of-day.
Escalating without owner availability
You paged an L2 rotation that is out of hours. Always ask the routing service “is there an owner available now?” before publishing.
Escalating and forgetting
No lifecycle on the escalation event. Add opened, accepted, resolved, retracted states so you can measure MTTA and MTTR.
No shadow mode for new rules
Ship a new rule to production, page 3,000 people. Every new rule / model version runs in shadow mode with counter metrics before going live.
10.2 The Trade-offs You Cannot Avoid
Recall vs Agent Burnout
- Higher recall → safer, but more false positives.
- Higher precision → agents love it, but rare-but-serious cases slip.
- Split the threshold per severity: high-recall for safety, high-precision for opinion-based cases.
Automation vs Human Oversight
- Full auto-escalation is fast but scary in regulated domains.
- Human-in-the-loop review adds trust and latency.
- Use human review for new rules; graduate them to auto once metrics are stable.
Context
We must decide how new escalation rules and model versions reach production without endangering agent trust.
Decision
All new rules and model versions run in shadow mode for a minimum of seven days. Shadow decisions are logged, compared to production decisions, and reviewed by an ops lead. Only after a documented sign-off do they graduate to enforcing mode.
Consequences
Slightly slower rollout of improvements, but drastically fewer “paging incidents caused by our own paging system.” The rollout process itself becomes a first-class part of the platform.
How Escalation Detection Evolves
The topic is not new — humans have escalated cases to specialists since the first call centre. What has changed is the speed, richness and autonomy of the detection. Understanding the waves helps you decide where your organisation actually is.
Wave 1 — Human Judgement (pre-2010)
Agents raise their hand. Supervisors watch queues. Slow, high-quality, does not scale.
Wave 2 — Rules & SLAs (2010s)
Static thresholds in the ticketing tool: “if wait > 30 min, escalate.” Enough to enforce SLAs; blind to content.
Wave 3 — ML Scoring (late 2010s)
Classifiers on sentiment, intent and behaviour add nuance. Rules and ML co-exist for the first time in mainstream support platforms.
Wave 4 — Correlated Signals (early 2020s)
Detection cross-references telemetry, incidents and customer segments in real time — the escalation understands the surrounding context.
Wave 5 — LLM-Assisted Reasoning (2024+)
Large language models summarise the case, propose escalation with a natural-language justification and even suggest what the escalating owner should do first.
11.1 Adjacent Systems That Plug In
Skill-Based Routing
Consumes escalation events, matches skills / language / seniority, dispatches to the best available owner.
On-Call & Paging
PagerDuty / Opsgenie-style tools driven by escalation events for infrastructure incidents.
CRM / Ticketing
Tickets get their priority, owner and SLA updated automatically when an escalation opens.
Ops Analytics
Dashboards for escalation rate, MTTA, MTTR, false-positive rate by team — the raw material for continuous improvement.
Key Takeaways
Escalation detection is not a fancy add-on. It is the invisible layer that decides, thousands of times a day, which human should hear about which problem — and how fast. Get it right and your ops team feels superhuman. Get it wrong and every other investment in support or reliability leaks value.
Key Takeaways
- Escalation detection is a decision service, not a resolver. Its output is an event, not a fix.
- Signals matter more than models. Content, behaviour, identity and system telemetry — all four families — are essential.
- Hybrid detectors ship. Deterministic rules for the things you must never miss, ML for the grey zone, always fused with reason codes.
- Stream by default, batch only where SLAs allow. Interactive channels demand sub-second decisions.
- Shard by
caseId. Ordering matters per case, not globally. Scale by adding partitions. - Every escalation must be explainable. Reason codes, evidence and policy version travel with the event.
- Deduplicate everything. One case, one active escalation per reason per window — never spam humans.
- Close the feedback loop before the first ML model ships. Labels are the compound-interest asset of the whole system.
- Ship new rules and models in shadow mode first. Trust with your ops team is easy to lose and slow to rebuild.
- Design for graceful degradation. If a feature or model is down, rules keep firing and decisions carry a “degraded” flag.
The most successful escalation systems are the ones the humans stop noticing. The bot handles what it can, the L1 handles what it must, and the senior specialist is quietly summoned exactly when their expertise is needed — not a minute earlier, not a minute later. That silence, and that timing, is what a good escalation detection system sounds like.

