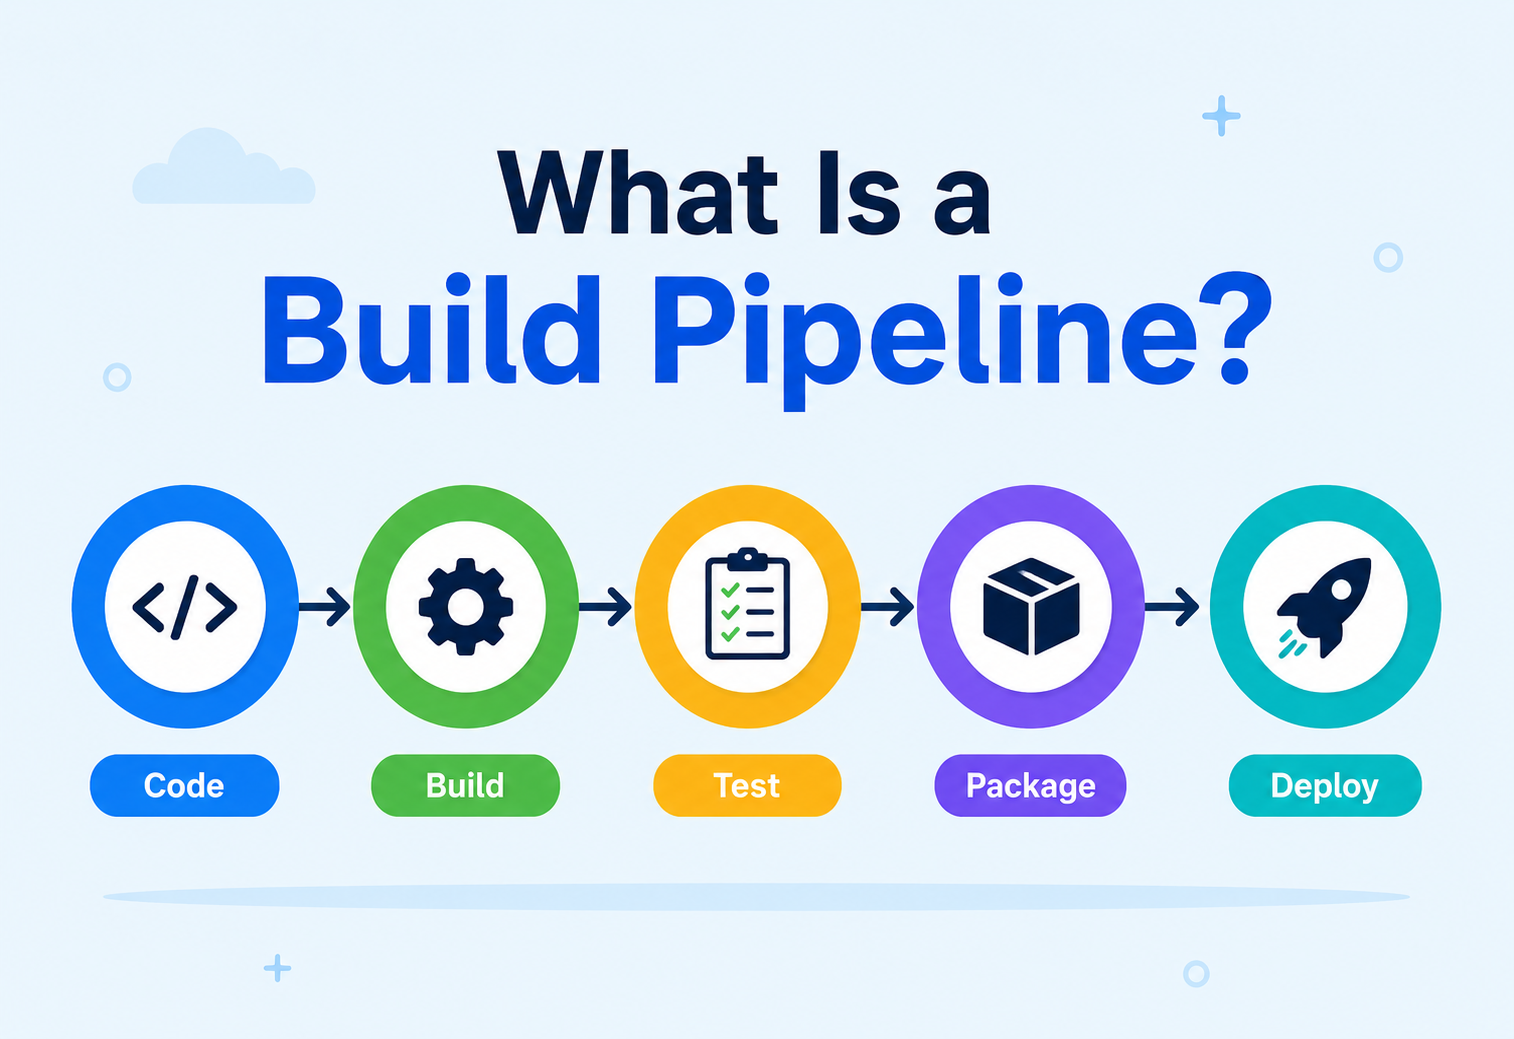
What Is a Build Pipeline?
A ground-up walk through the automated backbone that carries source code from a developer’s keyboard to a live production system. From the “integration hell” of the 1990s and Grady Booch’s original 1991 idea of continuous integration, through the tools (CruiseControl, Jenkins, Travis CI, CircleCI, GitLab CI, GitHub Actions, Argo CD) that made it mainstream, into how companies like Netflix, Amazon, Google, Etsy, Uber and Spotify run build pipelines at massive scale — with clear vocabulary, real code samples, and the design patterns and anti-patterns you will meet on any real team.
Introduction & History
Imagine you work in a bakery. Every time you bake a batch of bread, you do not just toss flour and water into the oven and hope for the best. You follow a sequence: mix the dough, let it rise, shape the loaves, bake at a specific temperature, cool, and finally package the bread for sale. Each step depends on the one before it, and if anything fails — say the dough does not rise — you stop before you waste an oven’s worth of energy baking something that will not sell.
A build pipeline is the software equivalent of that bakery process. It is an automated sequence of steps that takes raw source code written by developers and turns it into a working, tested, deployable piece of software — reliably, repeatably, and without a human having to babysit every step.
Before build pipelines existed, this process was manual and painful. In the 1990s and early 2000s, a common pattern in software teams was “integration hell”: developers worked on their own code for weeks, then tried to merge everything together right before a release. The result was chaotic — code that worked perfectly on one developer’s laptop would break the moment it was combined with everyone else’s changes, and nobody could figure out whose change caused the problem.
In 1991, Grady Booch coined the term “continuous integration” to describe merging code frequently instead of rarely. Kent Beck and the Extreme Programming (XP) community popularised the practice in the late 1990s, arguing that if integration was painful, the solution was to do it more often, not less. The first widely used automation tool to support this, CruiseControl, appeared in 2001, letting teams automatically build and test code every time someone committed a change. Later tools — Jenkins (originally Hudson, 2004), Travis CI (2011), CircleCI (2011), GitLab CI (2012), and GitHub Actions (2018) — turned this idea into an industry standard. Today virtually every professional software team, from two-person startups to companies like Google and Amazon running thousands of services, relies on some form of automated build pipeline.
Henry Ford’s assembly line took car manufacturing from “one team builds one car slowly and inconsistently” to “each station performs one repeatable task, and cars roll off the line predictably.” A build pipeline does the same for software: each stage — compile, test, package, deploy — is a station on the assembly line, and code “rolls” through it automatically.
1.1 A brief timeline
| Year | Milestone |
|---|---|
| 1991 | Grady Booch describes the concept of “continuous integration” as part of iterative software development practice. |
| 1997–1999 | Kent Beck and Extreme Programming popularise integrating code multiple times per day rather than at the end of a project. |
| 2001 | CruiseControl, one of the first widely used CI servers, is released as an open-source project. |
| 2004 | Hudson (later renamed Jenkins after an Oracle trademark dispute in 2011) is created, eventually becoming the most widely deployed self-hosted CI server. |
| 2006 | Martin Fowler publishes his influential essay Continuous Integration, codifying best practices for the wider industry. |
| 2010 | Jez Humble and David Farley publish Continuous Delivery, formalising the distinction between continuous integration, delivery, and deployment. |
| 2011 | Hosted CI services like Travis CI and CircleCI emerge, removing the need to self-host build infrastructure. |
| 2013 | Docker is released, giving pipelines a standardised, portable way to package and ship applications. |
| 2015 | Kubernetes is open-sourced by Google, quickly becoming the dominant deployment target for pipelines. |
| 2018 | GitHub Actions launches, tightly integrating pipeline automation directly into source control. |
| 2020s | GitOps (Argo CD, Flux), progressive delivery, and supply-chain security become mainstream pipeline concerns. |
This history matters because it shows that the build pipeline is not a single invention — it is the accumulation of decades of lessons about what goes wrong when software integration and release are left to manual human processes.
The Problem & Motivation
To understand why build pipelines matter, it helps to look at the pain they were designed to eliminate.
2.1 The world before build pipelines
- “Works on my machine” syndrome. A developer writes code, tests it locally, and it works. They hand it off, and it breaks in a different environment because of a missing dependency, a different JDK version, or an untracked configuration file.
- Manual, error-prone releases. A release engineer would follow a checklist — copy files to a server, run a script, restart a service — by hand. Skipping one line on a Friday-night deploy could take down production.
- Late discovery of bugs. Without automated tests running on every change, bugs were often discovered days or weeks later, by which point dozens of other changes had piled on top, making the root cause hard to isolate.
- Slow feedback loops. A developer might not know their change had broken something until QA manually tested it a week later — by then, they had moved on to other work and lost context.
2.2 What a build pipeline solves
A build pipeline directly attacks each of these problems:
| Problem | How a build pipeline solves it |
|---|---|
| Works on my machine | Builds run in a clean, standardised, reproducible environment (often a container) every time. |
| Manual, risky releases | Packaging and deployment steps are scripted and version-controlled, removing manual steps. |
| Late bug discovery | Automated tests run on every commit, giving feedback within minutes. |
| Slow feedback loops | Developers get pass/fail signals almost immediately, while the change is still fresh in their mind. |
Imagine a solo developer building a simple to-do list app. Every time they push code to GitHub, a pipeline automatically compiles the Java code, runs unit tests, and tells them within two minutes whether anything broke — instead of them manually running mvn test and remembering to check the results.
At Netflix, hundreds of engineers push code across thousands of microservices every day. Their internal build and deploy pipeline (built on top of Spinnaker, which Netflix open-sourced) automatically builds, tests, and progressively rolls out changes, catching failures before they reach the millions of subscribers streaming video at any given moment.
2.3 The economics of catching bugs early
There is a well-known observation in software engineering, sometimes attributed to research from IBM in the 1980s and reinforced by later studies: the cost of fixing a bug grows dramatically the later it is discovered. A bug caught while a developer is still writing the code might take minutes to fix. The same bug, if it survives into a code review, might take an hour, since the reviewer and author both need to re-establish context. If it makes it past review and is only caught during manual QA testing days later, it might take half a day, since the original developer now has to context-switch back into code they have since moved on from. And if it reaches production, it might trigger a customer-facing incident, an emergency rollback, an investigation, and a postmortem — easily consuming many engineer-days and, in serious cases, real financial or reputational damage.
A build pipeline is, in essence, an economic argument made concrete: it front-loads cheap, fast, automated checks so that the expensive, slow, human-involved failure modes happen as rarely as possible.
Core Concepts
Before diving into architecture, let’s build a solid vocabulary. Each term below includes what it means, why it matters, where you will see it, a simple analogy, and an example. Understanding these terms precisely matters because they get used loosely and interchangeably in casual conversation, but in a production engineering context, the distinctions between them — for example, between continuous delivery and continuous deployment — genuinely change how much automation and risk a team is choosing to accept.
3.1 Build
What: The process of converting human-readable source code into an executable artifact (like a .jar, .war, Docker image, or binary).
Why: Computers do not run Java source files directly — they need compiled bytecode.
Analogy: Translating a recipe written in English into a set of precise, machine-followable instructions.
Example: Running mvn package on a Spring Boot project produces app-1.0.0.jar.
3.2 Continuous Integration (CI)
What: The practice of merging all developers’ code changes into a shared repository frequently (often multiple times a day), with each merge automatically built and tested.
Why: It catches integration problems early, when they are small and easy to fix.
Analogy: Proofreading each paragraph of a group essay as it is written, rather than waiting until the whole essay is done to check for contradictions.
Example: Every pull request on GitHub automatically triggers a workflow that compiles and tests the code before it can be merged.
3.3 Continuous Delivery (CD)
What: Extending CI so that every change that passes automated tests is automatically packaged into a release-ready artifact, though a human still decides when to deploy it to production.
Why: It keeps software always in a deployable state, shrinking the gap between “written” and “shippable.”
Example: A pipeline builds a Docker image and pushes it to a registry after every successful test run, ready for a release manager to promote at any time.
3.4 Continuous Deployment
What: A step further than continuous delivery — every change that passes all automated checks is deployed to production automatically, with no human approval gate.
Why: It enables extremely fast release cycles (some companies deploy hundreds of times a day).
Example: Amazon has reportedly deployed code to production roughly every 11.7 seconds on average across its systems, relying entirely on automated pipelines.
3.5 Pipeline Stage
What: A distinct phase in the pipeline (e.g. Build, Test, Package, Deploy) that must typically complete successfully before the next stage begins.
Analogy: A relay race — each runner (stage) must complete their leg and pass the baton before the next runner starts.
3.6 Job / Task
What: A single unit of work within a stage, such as “run unit tests” or “run static code analysis.” A stage can contain one or several jobs, sometimes run in parallel.
3.7 Artifact
What: The output produced by the build — a compiled binary, a Docker image, a compressed archive — that gets carried forward through later stages (like deployment) without being rebuilt.
Why it matters: Rebuilding at every stage risks producing slightly different outputs (different compiler versions, dependency updates). You want to build once and promote the exact same artifact through test, staging, and production.
3.8 Trigger
What: The event that starts a pipeline run — a git push, a pull request, a scheduled cron job, or a manual button click.
3.9 Pipeline as Code
What: Defining the pipeline itself in a version-controlled file (like a Jenkinsfile or .github/workflows/build.yml) rather than clicking through a UI.
Why: It makes the pipeline reviewable, versioned, and reproducible, just like application code.
3.10 Build Agent / Runner
What: The machine (physical, virtual, or containerised) that actually executes pipeline steps.
3.11 Quality Gate
What: A checkpoint in the pipeline that blocks progress unless certain conditions are met — for example, “test coverage must be above 80 %” or “zero critical security vulnerabilities.”
3.12 Build Matrix
What: Running the same pipeline across multiple combinations of variables — e.g. Java 17 and Java 21, on both Linux and Windows — to verify compatibility.
Why: Software often needs to work across several environments, and testing each combination manually does not scale.
Example: An open-source Java library might test against JDK 17, 21, and 23 simultaneously on every commit to catch version-specific issues.
3.13 Environment Promotion
What: Moving the same, unchanged artifact through a sequence of environments — typically dev → QA → staging → production — with increasing levels of confidence at each stage.
Analogy: A student moving from junior school to senior school to university — the same person, progressively taking on more responsibility, rather than being rebuilt from scratch at each level.
3.14 Rollback
What: Reverting a deployed environment to a previous, known-good artifact version after a problem is discovered.
Why: Even with thorough testing, some issues only appear under real production load; a fast rollback path limits the damage.
3.15 Pipeline Concurrency & Queuing
What: How a CI system handles multiple pipeline runs triggered close together — running them in parallel across agents, queuing them, or cancelling superseded runs (e.g. an older commit’s build being cancelled once a newer commit on the same branch arrives).
3.16 Shift Left
What: A guiding philosophy behind pipeline design — catching problems (bugs, security issues, quality issues) as early as possible in the process, rather than late.
Analogy: Checking your spelling as you type each sentence rather than proofreading an entire 50-page document only after finishing it.
Architecture & Components
A build pipeline is made up of several cooperating components. Let’s walk through them.
4.1 Source Control System
Git repositories (hosted on GitHub, GitLab, or Bitbucket) are the starting point. Every pipeline run is triggered by an event here — a push, a merge, or a tag.
4.2 CI/CD Orchestrator
This is the “brain” — software like Jenkins, GitHub Actions, GitLab CI, CircleCI, or Azure DevOps that reads the pipeline definition, schedules jobs, and tracks their state.
4.3 Build Agents / Runners
The actual machines that execute each step. Modern setups use ephemeral, containerised agents (a fresh Docker container spun up for each run) to guarantee a clean, reproducible environment every time — directly solving the “works on my machine” problem.
4.4 Build Tool
Language-specific tools that compile code and manage dependencies — Maven or Gradle for Java, npm for JavaScript, pip for Python.
4.5 Test Runners
Frameworks like JUnit, TestNG, or Mockito that execute unit, integration, and sometimes end-to-end tests, producing structured reports the pipeline can parse to decide pass/fail.
4.6 Static Analysis & Security Scanners
Tools like SonarQube, Checkstyle, or Snyk that inspect code quality and known vulnerabilities without executing the program.
4.7 Artifact Repository
A storage system — Nexus, JFrog Artifactory, or a container registry like Docker Hub / Amazon ECR — that stores versioned build outputs so they can be promoted between environments without rebuilding.
4.8 Deployment Mechanism
Tools such as Kubernetes, Helm, Ansible, or cloud-native deployment services that take the artifact and actually run it in an environment.
4.9 Notification & Feedback Layer
Slack, email, or dashboard integrations that tell the team whether a pipeline run succeeded or failed.
4.10 Configuration & Secrets Store
Environment-specific configuration (database URLs, feature flags) and sensitive credentials (API keys, TLS certificates) are kept separate from the pipeline definition itself, typically injected at runtime by a dedicated secrets manager. This separation means the same pipeline code can run identically across dev, staging, and production, with only the injected configuration changing — a principle sometimes called “one build, many configs.”
4.11 How these components fit together
It is worth being explicit about the relationships between these pieces, since beginners often conflate them. The CI/CD orchestrator is not the same thing as the build agent — the orchestrator is the scheduler and coordinator, deciding what should run and when, while the agent is the actual worker that executes the commands. Similarly, the artifact repository is distinct from source control: source control stores human-authored code that changes constantly, while the artifact repository stores machine-produced, versioned outputs that, once created, should never change. Confusing these roles is a common source of pipeline design mistakes, such as trying to store build outputs directly in the Git repository (which bloats repository size and defeats the purpose of immutable, independently versioned artifacts).
Think of an airport. Source control is the check-in counter (where the “package,” i.e., the passenger, enters the system). The CI/CD orchestrator is air traffic control, deciding what happens and when. Build agents are the ground crew doing the actual physical work. The artifact repository is the baggage handling system that keeps track of exactly which bag belongs to which flight. And deployment is the plane actually taking off and landing at its destination.
Internal Working — Step by Step
Let’s trace exactly what happens, step by step, when a developer pushes a code change, using a typical Java/Spring Boot project as our running example.
-
Trigger
A developer runs
git push origin feature/add-payment-api. GitHub receives the push and, because a webhook is configured, sends an HTTP POST notification to the CI server (or, in GitHub Actions’ case, natively triggers the configured workflow). -
Checkout
The CI server allocates a build agent (often a fresh container) and checks out the exact commit that triggered the build.
-
Dependency resolution
The build tool (Maven/Gradle) reads the project’s dependency manifest (
pom.xmlorbuild.gradle) and downloads required libraries, typically from a cached repository to keep this fast.<!-- pom.xml snippet --> <dependencies> <dependency> <groupId>org.springframework.boot</groupId> <artifactId>spring-boot-starter-web</artifactId> </dependency> <dependency> <groupId>org.springframework.boot</groupId> <artifactId>spring-boot-starter-test</artifactId> <scope>test</scope> </dependency> </dependencies> -
Compilation
The Java source files are compiled into bytecode (
.classfiles). Any syntax or type error stops the pipeline here, immediately, before wasting time on later stages. -
Unit tests
JUnit tests execute against the compiled code, verifying individual units of logic in isolation.
@SpringBootTest class PaymentServiceTest { @Autowired private PaymentService paymentService; @Test void shouldCalculateTotalWithTax() { BigDecimal total = paymentService.calculateTotal(new BigDecimal("100.00")); assertEquals(new BigDecimal("118.00"), total); // 18% GST } } -
Static analysis
Tools like SonarQube scan for code smells, complexity issues, and duplicated code, often failing the build if quality thresholds are not met.
-
Packaging
The compiled classes are bundled into a deployable artifact — for Spring Boot, typically an executable JAR containing an embedded Tomcat server.
# Maven packaging command run by the pipeline mvn clean package -DskipTests=false # Produces: target/payment-service-1.4.0.jar -
Containerisation
Many pipelines then build a Docker image wrapping that JAR.
# Dockerfile FROM eclipse-temurin:21-jre-alpine WORKDIR /app COPY target/payment-service-1.4.0.jar app.jar EXPOSE 8080 ENTRYPOINT ["java", "-jar", "app.jar"] -
Integration & security tests
The container may be spun up in an isolated test environment to run integration tests against a real (or containerised) database, along with dependency vulnerability scanning.
-
Publish artifact
The Docker image is tagged with the commit hash or version number and pushed to a registry (e.g. Amazon ECR).
docker tag payment-service:latest 123456789.dkr.ecr.ap-south-1.amazonaws.com/payment-service:1.4.0 docker push 123456789.dkr.ecr.ap-south-1.amazonaws.com/payment-service:1.4.0 -
Deploy
A deployment tool (Helm, Argo CD, or a custom script) instructs the target environment — often Kubernetes — to pull the new image and replace the running instances, typically using a rolling update strategy.
-
Notify
Finally, the pipeline posts a success or failure message to a Slack channel or dashboard, closing the feedback loop for the team.
5.1 Why the order of these steps matters
Notice that the steps are deliberately ordered from cheapest and fastest to most expensive and slowest. Compilation typically takes seconds and catches an entire class of errors (typos, type mismatches) before any test even runs. Unit tests, which run in memory without external dependencies, come next because they are still relatively fast. Integration tests, which need a real database or other services running, are more expensive in both time and infrastructure cost, so they run later, after cheaper checks have already filtered out obviously broken changes. This ordering is sometimes called the “test pyramid” applied to pipeline design: put a large number of fast, cheap checks at the base, and a smaller number of slow, expensive checks near the top, so that most failures are caught — and reported back to the developer — within the first minute or two rather than the last.
This ordering also has a direct cost implication. Build agents, especially cloud-hosted ones, are billed by the minute. Running a 30-minute integration test suite against a change that would have failed compilation in 10 seconds wastes both time and money — which is exactly the kind of waste a well-ordered pipeline eliminates.
name: Build and Deploy
on:
  push:
    branches: [main]

jobs:
  build-test:
    runs-on: ubuntu-latest
    steps:
      - uses: actions/checkout@v4
      - uses: actions/setup-java@v4
        with:
          java-version: '21'
          distribution: 'temurin'
      - name: Build with Maven
        run: mvn -B clean verify
      - name: Build Docker image
        run: docker build -t payment-service:${{ github.sha }} .
      - name: Push to registry
        run: |
          echo "${{ secrets.REGISTRY_PASSWORD }}" | docker login -u user --password-stdin
docker push payment-service:${{ github.sha }}Data Flow & Lifecycle
It helps to visualise a pipeline as a state machine, where a “build” moves through a series of well-defined states from creation to retirement.
Each build typically carries metadata through its whole lifecycle: a unique build number, the commit hash it was built from, timestamps for each stage, test results, and the final deployment status. This metadata is what lets a team answer questions like “which commit is currently running in production?” or “when did this bug get introduced?” months later.
6.1 Lifecycle states
| State | Meaning |
|---|---|
| Queued | Build is waiting for an available agent. |
| Running | Build is actively executing stages. |
| Success | All stages completed and quality gates passed. |
| Failed | A stage failed (compile error, test failure, security gate). |
| Aborted | Manually cancelled or superseded by a newer commit. |
| Deployed | Artifact successfully running in the target environment. |
| Rolled Back | A previously deployed build was reverted due to issues. |
6.2 Why traceability matters
Carrying metadata like the commit hash and build number all the way through to production is not just bookkeeping — it is what makes incident response possible. When something goes wrong in production, the very first question an on-call engineer asks is usually “what changed recently?” With proper traceability, they can look at the currently running artifact’s build number, trace it back through the artifact repository to the exact commit it was built from, and see precisely which code changes, by which developer, went into that release — turning what could be hours of guesswork into minutes of investigation.
Pros, Cons & Tradeoffs
✓ Advantages
- Fast, consistent feedback on every change.
- Eliminates “works on my machine” issues via standardised environments.
- Reduces manual, error-prone release steps.
- Enables frequent, low-risk releases instead of rare, high-risk ones.
- Creates an audit trail (who built what, when, from which commit).
- Frees engineers from repetitive manual work.
⚠ Tradeoffs & challenges
- Initial setup and maintenance cost (someone has to own the pipeline).
- Slow or flaky pipelines can become a bottleneck teams learn to distrust.
- Overly strict quality gates can frustrate developers if poorly tuned.
- Build agents and infrastructure cost money and require capacity planning.
- Complex pipelines can themselves become hard-to-debug “legacy code.”
- Security of the pipeline itself becomes a critical concern — a compromised pipeline can push malicious code to production.
The core tradeoff is upfront investment versus long-term velocity. Teams that skip building a solid pipeline often move faster initially but pay for it later in outages, slow manual releases, and integration pain. Teams that invest early usually see the payoff compound as the codebase and team size grow, since the fixed cost of building and maintaining the pipeline is spread across an ever-larger number of changes shipped through it safely.
Performance & Scalability
As codebases and teams grow, pipeline speed becomes a serious engineering concern in its own right — a slow pipeline directly slows down every developer on the team.
8.1 Parallelisation
Independent jobs (unit tests, static analysis, security scans) can run concurrently across multiple agents rather than sequentially.
8.2 Caching
Dependency caches (e.g. Maven’s ~/.m2 directory, Docker layer caching) avoid re-downloading or re-compiling unchanged parts of the project on every run.
8.3 Incremental builds
Build tools like Gradle track which files changed and skip recompiling and retesting unaffected modules — critical in large monorepos with hundreds of modules.
8.4 Test selection & sharding
Instead of running an entire multi-hour test suite on every commit, large organisations split (shard) tests across many agents running in parallel, or run only tests affected by the specific change on pull requests, reserving the full suite for scheduled runs.
8.5 Ephemeral, elastic agents
Cloud-based agent pools (e.g. Kubernetes-based Jenkins agents, or GitHub-hosted runners) scale up automatically when many builds queue up and scale back down to zero when idle, controlling cost while maintaining throughput.
Google’s internal build system, Blaze (the basis for the open-source Bazel), is designed around aggressive caching and fine-grained dependency graphs so that changing one file in a codebase with billions of lines of code only rebuilds and retests the small subset of code actually affected — not the entire repository.
8.6 Measuring where time actually goes
Before optimising a slow pipeline, it is worth measuring which stage is actually the bottleneck rather than guessing. A common approach is to record per-stage timing in every run and chart it over time. Teams are often surprised to find the bottleneck is not the test suite at all, but something less visible — dependency downloads that are not cached, a Docker image build that is not using layer caching effectively, or an artifact upload competing for network bandwidth with dozens of other concurrent builds. Treating pipeline performance as a measurable, ongoing engineering concern — rather than a one-time setup task — is what separates fast, trusted pipelines from ones developers learn to route around.
8.7 The cost dimension
Scalability is not only about speed; it is also about cost. Every minute a build agent runs, whether self-hosted on a company’s own servers or billed per-minute by a cloud CI provider, has a real dollar cost. Teams running thousands of builds a day can find their CI bill becoming a significant line item, which is why techniques like caching, incremental builds, and running expensive test suites only on a schedule (rather than on every single commit) matter as much for the finance team as they do for developer experience.
High Availability & Reliability
If your build pipeline goes down, your entire engineering organisation effectively stops shipping. Treating the pipeline itself as a production system is essential.
- Redundant CI servers / managed services: Using a managed CI platform (GitHub Actions, CircleCI) offloads uptime responsibility; self-hosted Jenkins setups often run in active-passive or clustered configurations.
- Idempotent, retryable stages: A flaky network call should not require restarting the entire pipeline from scratch — stages should be safely retryable.
- Immutable artifacts: Once built and tagged, an artifact is never modified — it is simply promoted between environments, which prevents “it changed between staging and prod” mysteries.
- Rollback strategy: Every deployment mechanism should support a fast, automated rollback to the last known-good artifact if health checks fail post-deployment.
- Blue-green and canary deployments: Reduce blast radius by routing only a small percentage of traffic to a new version before a full rollout.
Canary deployments get their name from coal miners historically carrying caged canaries into mines — if the canary showed signs of distress from gas, miners knew to evacuate before it affected them. A canary release exposes a new version to a small slice of real traffic first, so problems are caught before they affect everyone.
9.1 Testing the rollback path itself
A subtle but important reliability practice is that the rollback mechanism needs to be exercised regularly, not just designed and forgotten. It is common for teams to build an automated rollback feature, never actually trigger it in a real incident for months, and then discover during an actual outage that the rollback script itself has bugs, or depends on infrastructure that has since changed. Some organisations address this by periodically running “game days” — deliberately triggering a rollback in a controlled setting to verify the whole path works end-to-end, similar to a fire drill.
9.2 Disaster recovery for the pipeline itself
High availability thinking also needs to extend to the pipeline’s own infrastructure. If a self-hosted Jenkins server’s disk fails and no backup exists for its configuration and job history, a team can lose not just convenience but the institutional knowledge encoded in years of pipeline configuration. Best practice is to back up pipeline configuration (ideally it is already version-controlled as pipeline-as-code, which serves as a natural backup), and to document or automate how to stand up a replacement CI server from scratch, so a single infrastructure failure does not halt all software delivery across the company.
Security
A build pipeline has broad access — to source code, credentials, and production deployment rights — making it an attractive target. The 2020 SolarWinds attack, where attackers compromised a build pipeline to insert malicious code into a trusted software update, is a well-known example of what can go wrong.
10.1 Key security practices
- Least privilege for credentials: Pipeline secrets (API keys, deployment credentials) should be scoped narrowly and stored in a secrets manager (e.g. HashiCorp Vault, AWS Secrets Manager) — never hard-coded in pipeline config files.
- Dependency scanning: Tools like Snyk or OWASP Dependency-Check flag known vulnerabilities in third-party libraries before they reach production.
- Static Application Security Testing (SAST): Scans source code for common vulnerability patterns (SQL injection, hard-coded secrets) as part of the pipeline.
- Signed and verified artifacts: Cryptographically signing build artifacts (and verifying signatures before deployment) ensures the artifact deployed is exactly the one that was built and tested — not tampered with in between.
- Restricted pipeline modification: Changes to the pipeline definition itself should go through code review, just like application code, since a malicious pipeline change can bypass all other controls.
- Isolated build environments: Ephemeral, sandboxed build agents prevent one build from leaving behind malicious artifacts that affect a later build.
Uber’s engineering team publicly documented moving toward supply-chain security practices including SBOM (Software Bill of Materials) generation in their pipelines, so they can quickly identify which services are affected when a new vulnerability is disclosed in a widely used library.
10.2 Thinking about the pipeline as an attack surface
It is useful to explicitly list what an attacker gains if they compromise a build pipeline, since this framing explains why the security practices above matter so much. A compromised pipeline can typically: read the full source code of every project it builds, including any secrets accidentally committed to the repository; access the credentials the pipeline itself uses to deploy to production, effectively gaining the same deployment rights as the legitimate team; and, most dangerously, inject malicious code into an artifact that will then be cryptographically “trusted” and deployed automatically, exactly as the SolarWinds incident demonstrated at massive scale. This is why security-conscious organisations increasingly treat their pipeline infrastructure with the same threat-modelling rigor as their production systems, rather than as mere developer tooling.
10.3 Beginner-friendly starting point
A solo developer or small team does not need enterprise-grade supply-chain tooling on day one. A reasonable starting point is simply: never commit secrets to source control (use your CI provider’s built-in secrets feature instead), keep your CI provider account protected with two-factor authentication, and enable any free, built-in dependency vulnerability alerts your Git host offers (GitHub’s Dependabot, for example). These three habits alone eliminate a large share of real-world pipeline security incidents.
Monitoring, Logging & Metrics
Just like any production system, a healthy pipeline needs observability so teams can spot problems and continuously improve delivery speed.
11.1 Key metrics (often called DORA metrics)
| Metric | What it measures |
|---|---|
| Deployment Frequency | How often code is successfully deployed to production. |
| Lead Time for Changes | Time from code commit to running in production. |
| Change Failure Rate | Percentage of deployments causing a production incident. |
| Mean Time to Recovery (MTTR) | How quickly a failed deployment is detected and fixed / rolled back. |
| Build Success Rate | Percentage of pipeline runs that complete successfully. |
| Pipeline Duration | Total time from trigger to deployment completion. |
Beyond metrics, pipelines should produce structured, searchable logs for every stage, and integrate with centralised logging (e.g. the ELK stack — Elasticsearch, Logstash, Kibana) so failures can be diagnosed quickly without digging through raw console output.
A small team might simply configure their CI tool to send a Slack message with a green checkmark or red X after every run, along with a link to the logs — enough visibility for a five-person team.
Large organisations build internal dashboards (sometimes on top of Grafana) tracking DORA metrics across hundreds of teams, using them in engineering reviews to identify which teams need support improving their delivery process.
Deployment & Cloud
The final stages of a build pipeline connect directly to how and where software actually runs.
12.1 Deployment strategies
- Rolling update: Gradually replaces old instances with new ones, a few at a time, keeping the service available throughout.
- Blue-green deployment: Runs two identical environments (“blue” = current, “green” = new); traffic is switched all at once after the green environment is verified healthy, enabling instant rollback by switching back.
- Canary deployment: Gradually shifts a small percentage of live traffic to the new version, expanding only if metrics stay healthy.
- Feature flags: Decouples deployment from release — code is deployed to production but hidden behind a flag, letting teams enable it for specific users independently of the deployment itself.
12.2 Cloud-native pipeline patterns
On AWS, a typical pipeline might use CodePipeline or Jenkins to build, push a Docker image to Elastic Container Registry (ECR), and deploy to Elastic Kubernetes Service (EKS) or ECS. On GCP, Cloud Build and Artifact Registry play similar roles feeding into Google Kubernetes Engine (GKE). Azure DevOps Pipelines integrates similarly with Azure Kubernetes Service (AKS).
# Simplified Kubernetes deployment manifest updated by the pipeline
apiVersion: apps/v1
kind: Deployment
metadata:
  name: payment-service
spec:
  replicas: 4
  strategy:
    type: RollingUpdate
    rollingUpdate:
      maxSurge: 1
      maxUnavailable: 0
  template:
    spec:
      containers:
        - name: payment-service
          image: 123456789.dkr.ecr.ap-south-1.amazonaws.com/payment-service:1.4.0
          readinessProbe:
            httpGet:
              path: /actuator/health
              port: 8080
Tools like Argo CD or Flux implement “GitOps” — where the desired state of production is described declaratively in a Git repository, and a controller continuously reconciles the live cluster to match it, effectively making Git the single source of truth for both code and deployed state.
12.3 GitOps versus push-based deployment
Traditional pipelines are “push-based”: the CI system directly connects to the target environment and pushes the new configuration or image onto it. GitOps flips this around into a “pull-based” model: the pipeline’s only job is to update a Git repository describing the desired state, and a separate controller running inside the target cluster continuously watches that repository and pulls in changes itself. This has a meaningful security benefit — the CI system never needs direct, standing credentials to production, since the controller inside the cluster is the only thing with deployment access, and it only ever reads from Git rather than accepting inbound commands.
12.4 Combining feature flags with deployment
Many mature organisations separate two decisions that are easy to conflate: “is this code running in production” and “can users see this feature.” A build pipeline handles the first question — deploying new code safely. Feature flag systems (like LaunchDarkly or an in-house equivalent) handle the second, letting a team deploy a half-finished feature to production, hidden behind a flag, and then turn it on gradually — for internal employees first, then a percentage of real users — completely independently of any further deployment. This decoupling means a risky feature launch no longer requires a risky deployment; the deployment already happened safely days or weeks earlier.
Databases, Caching & Load Balancing in Pipeline Context
While a build pipeline is not itself a database or cache, it interacts closely with these systems, particularly during testing and rollout.
13.1 Database migrations in the pipeline
Schema changes are typically version-controlled as migration scripts (using tools like Flyway or Liquibase for Java/Spring projects) and run as an explicit pipeline stage before the new application version is deployed, ensuring the database schema and application code stay in sync.
-- V17__add_payment_status_column.sql (Flyway migration)
ALTER TABLE payments ADD COLUMN status VARCHAR(20) NOT NULL DEFAULT 'PENDING';
CREATE INDEX idx_payments_status ON payments(status);
13.2 Test databases and caching
Integration test stages often spin up ephemeral, containerised databases (via Testcontainers, common in Java projects) so tests run against a real database engine rather than mocks, catching SQL-specific bugs early — without touching any shared, persistent test database that other builds might also be using.
13.3 Load balancers during rollout
During a rolling or blue-green deployment, a load balancer (like an AWS Application Load Balancer or an Nginx ingress in Kubernetes) is what actually controls which version of the application receives live traffic, working hand-in-hand with the deployment stage of the pipeline to shift traffic gradually and safely.
APIs & Microservices Context
In a microservices architecture, build pipelines take on additional responsibilities beyond a single-service world.
- Independent pipelines per service: Each microservice typically has its own pipeline, letting teams deploy independently without coordinating a “big bang” release across the whole system.
- Contract testing: Pipelines often run consumer-driven contract tests (using tools like Pact) to verify that a service’s API changes do not break other services that depend on it — without needing to spin up the entire system for every test.
- API versioning checks: Automated checks can compare a new OpenAPI/Swagger spec against the previous version to flag breaking changes before merge.
- Service mesh integration: In systems using a service mesh (like Istio), the pipeline’s canary deployment logic often integrates directly with mesh-level traffic-splitting rules rather than a simple load balancer.
A company running 50 Spring Boot microservices might maintain a shared, reusable Jenkins pipeline library so each service’s Jenkinsfile is just a few lines calling shared logic — avoiding 50 nearly identical, hard-to-maintain pipeline definitions scattered across repositories.
14.1 Monorepo versus polyrepo pipeline strategy
Organisations running microservices generally choose between two repository strategies, each with different pipeline implications. In a polyrepo setup, each microservice lives in its own Git repository with its own independent pipeline — simple to reason about, but coordinating a change that spans multiple services (like a shared library upgrade) requires updating and releasing each repository separately. In a monorepo setup, many or all services live in a single large repository, and the pipeline must be smart enough to detect which specific services were actually affected by a given change and only build and test those — otherwise every commit would trigger a rebuild of the entire company’s codebase, which quickly becomes impractical at scale. Google, Meta, and increasingly many mid-sized companies use sophisticated monorepo tooling (Bazel, Nx, Turborepo) specifically to make this selective building and testing fast and reliable.
Design Patterns & Anti-patterns
15.1 Effective patterns
Fail fast
Order stages so the cheapest, fastest checks (compile, lint) run before expensive ones (full integration test suites), so failures surface in seconds rather than after a 20-minute wait.
Build once, deploy many
Build a single immutable artifact and promote it unchanged through dev, staging, and production, rather than rebuilding at each stage.
Pipeline as code
Version-control the pipeline definition alongside the application code it builds.
Shared pipeline libraries
Extract common logic into reusable templates across many services / repositories.
Trunk-based development
Keep long-lived branches short-lived (or avoid them entirely), merging small changes into the main branch frequently to minimise painful, large merges.
15.2 Common anti-patterns
- The “snowflake” pipeline: A pipeline configured by hand through a UI, undocumented and irreproducible, that only one person understands.
- Flaky tests ignored: Tests that fail intermittently get treated as “normal” and re-run until green, quietly eroding trust in the entire test suite over time.
- The 45-minute pipeline nobody waits for: When pipelines get too slow, developers start skipping local verification and batching up changes, defeating the purpose of fast feedback.
- Testing in production only: Skipping a proper staging environment and quality gates, relying entirely on production monitoring to catch problems — expensive and risky for most systems.
- Secrets committed to pipeline config: Hard-coding API keys or passwords directly in a
Jenkinsfileor workflow YAML file instead of using a secrets manager.
Best Practices & Common Mistakes
✓ Best practices
- Keep pipeline definitions in the same repository as the code they build.
- Make pipelines idempotent and safely re-runnable.
- Cache dependencies aggressively to keep builds fast.
- Run fast checks first, slow checks last.
- Treat pipeline failures with the same urgency as production incidents.
- Automate rollback — do not rely on manual intervention under pressure.
- Keep the pipeline itself under code review.
⚠ Common mistakes
- Letting the test suite grow slow without addressing it.
- Granting overly broad permissions to CI credentials.
- No monitoring on the pipeline’s own health and duration.
- Skipping staging environments to “save time.”
- Manually patching production instead of going through the pipeline (creates drift).
- Not testing the rollback path until it is needed in an emergency.
Real-World / Industry Examples
What these examples share is a common thread: as an organisation’s number of services and engineers grows, the build pipeline stops being a convenience and becomes core infrastructure — treated with the same rigor, ownership, and investment as the production systems it deploys. Small companies can start simple, with a single shared pipeline definition, and evolve toward these more sophisticated patterns only as real scaling pain justifies the added complexity.
FAQ, Summary & Key Takeaways
Is a build pipeline the same as CI/CD?
They are closely related but not identical. CI/CD describes the practices (continuous integration and continuous delivery/deployment); a build pipeline is the concrete, automated implementation of those practices — the actual sequence of stages that executes them.
Do I need Kubernetes to have a build pipeline?
No. A build pipeline can deploy to a single virtual machine, a serverless platform, or even copy files to a traditional server. Kubernetes is a common target for the deployment stage, but it is not a requirement.
What’s the difference between Jenkins and GitHub Actions?
Jenkins is a self-hosted, highly extensible open-source automation server that you install and maintain yourself. GitHub Actions is a managed CI/CD service built directly into GitHub, requiring no infrastructure management but offering somewhat less flexibility for highly custom setups.
How long should a build pipeline take?
There is no universal number, but many high-performing teams aim for a core feedback loop (compile + unit tests) under 10 minutes, since developer context and patience both degrade quickly beyond that.
Can a small team or solo developer benefit from a build pipeline?
Yes. Even a simple pipeline that runs tests on every push catches mistakes before they reach users, and the free tiers of GitHub Actions or GitLab CI make this essentially free to set up for small projects.
What happens if a stage in the pipeline fails?
By default, most CI systems stop the pipeline at the failed stage and mark the run as failed, preventing later stages (like deployment) from running against broken code. The team is notified, and the specific stage’s logs pinpoint what went wrong — for example, a failing unit test will show exactly which assertion did not match the expected value.
Should every commit trigger a full production deployment?
Not necessarily. Many teams deploy every commit that passes tests to a staging environment automatically, but gate production deployment behind either a manual approval step or additional criteria (business hours, feature-flag readiness), depending on how much risk the organisation is comfortable automating away.
How is a build pipeline different from a deployment script?
A deployment script is usually a single, standalone script that pushes code somewhere. A build pipeline is a broader, orchestrated system that includes triggering, building, testing, quality gating, artifact management, and often multiple deployment stages with monitoring and rollback — a deployment script might be just one small piece invoked from within it.
What is “pipeline as code” and why does it matter so much?
It means the pipeline’s definition — which stages run, in what order, with what conditions — lives in a text file inside version control (like a Jenkinsfile or a YAML workflow file) rather than being configured by clicking through a web UI. This makes the pipeline itself reviewable via pull requests, auditable through git history, and easy to replicate across new projects, the same benefits version control brings to application code.
Summary
A build pipeline is the automated backbone that carries code from a developer’s keyboard to a running production system — compiling it, testing it, packaging it, scanning it for problems, and deploying it, all without manual intervention at every step. It emerged from decades of painful experience with manual, error-prone software releases, and today it is a foundational practice at organisations of every size, from solo developers to Netflix and Google.
Key takeaways
- A build pipeline automates the journey from source code to a deployable, tested artifact.
- It exists to solve real, expensive problems: “works on my machine,” slow feedback, and risky manual releases.
- Core stages are typically: checkout, compile, test, static analysis, package, publish, deploy.
- Reliability practices — immutable artifacts, canary deployments, automated rollback — turn a pipeline into a safety net rather than a risk.
- Security must be designed in from the start, since a pipeline has broad access to code and production systems.
- Metrics like deployment frequency, lead time, and change failure rate (DORA metrics) help teams measure and improve their delivery process over time.
Whether you are a solo developer setting up your first GitHub Actions workflow or an architect designing delivery infrastructure for hundreds of microservices, the underlying goal of a build pipeline never changes: turn the risky, manual, error-prone process of shipping software into something automated, fast, and trustworthy enough that your team can do it with confidence, many times a day, without fear.

