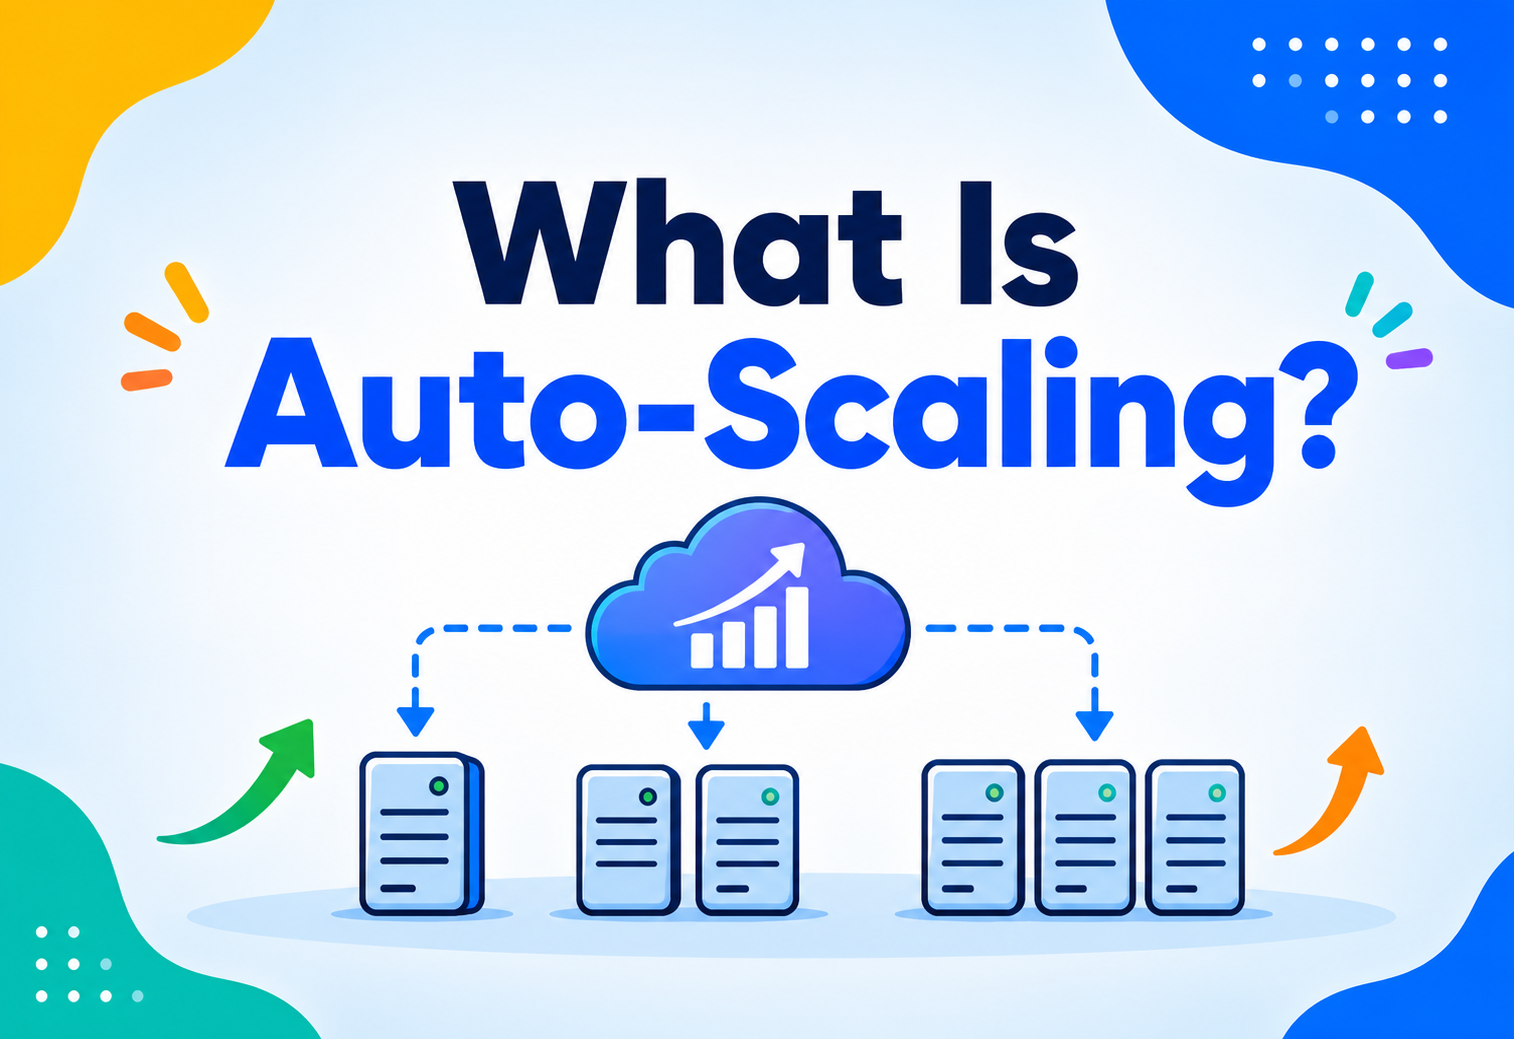
What Is Auto-Scaling?
From the first “the server is on fire” 3 a.m. page to Kubernetes HPA and predictive scaling with machine learning — how modern systems learn to grow and shrink themselves, why it matters, and how to build it right. Twenty grounded chapters walking from history and vocabulary through architecture, formulas, code samples, cloud implementations, distributed-systems trade-offs, industry examples from Netflix, Amazon, Uber and Google, and the FAQ and takeaways that tie it all together.
Introduction & History
Picture a small bakery that always bakes exactly 100 loaves of bread, every single day, regardless of demand. On a quiet Tuesday, 60 loaves go stale and are thrown away — wasted flour, wasted money. On the Saturday before a public holiday, 400 hungry customers show up, only the first 100 get any bread, and everyone else leaves annoyed. The bakery has lost trust, lost sales, and burned money in the same week.
Auto-scaling is what happens when that bakery installs a magic oven that automatically bakes more loaves when the queue lengthens and fewer loaves when the street is empty — with no human standing there hour by hour deciding “bake more” or “bake less.” In computing terms, auto-scaling is a system’s ability to automatically add or remove compute resources (servers, containers, database capacity) in response to real, measured demand, without any human clicking buttons in the middle of the night.
A Short History
Before the public cloud existed, “scaling” meant buying physical servers. A company would guess how much traffic they’d see next year, place an order for that many machines, and wait weeks for them to be racked in a data centre. This practice is called capacity planning — the art (and often the guesswork) of forecasting future demand and provisioning hardware in advance. Guess too low, and the site crashes under load. Guess too high, and you’ve spent a fortune on machines that sit idle, humming quietly and doing nothing.
1990s–2000s: The Data Centre Era
Companies bought and owned physical servers. Scaling meant purchase orders, shipping delays, and racking hardware by hand. “Black Friday” prep meant buying machines in October that would sit mostly idle in July.
2006: Amazon EC2 Launches
Amazon Web Services introduced Elastic Compute Cloud (EC2) — “elastic” being the key word. For the first time, a company could rent a virtual server by the hour and return it when finished, instead of owning it forever.
2009: Auto Scaling Groups
AWS introduced Auto Scaling as a managed feature: define rules, and AWS would automatically launch or terminate EC2 instances to match demand. This is widely seen as the birth of “auto-scaling” as a mainstream cloud concept.
2014–2015: Containers & Kubernetes
Docker made packaging applications into lightweight containers easy. Kubernetes (originally built at Google, open-sourced in 2014) brought auto-scaling down from whole virtual machines to individual application processes, scaling in seconds rather than minutes.
2014: Serverless Arrives
AWS Lambda introduced a model where you don’t manage servers or scaling rules at all — the platform scales your code from zero to thousands of parallel executions automatically, and you pay only for what runs.
2020s: Predictive & AI-Driven Scaling
Modern platforms use machine learning to forecast traffic spikes before they occur (predictive scaling), scaling up minutes before a Super Bowl ad airs rather than seconds after the flood arrives.
Today, auto-scaling sits alongside elasticity, pay-as-you-go pricing, and infrastructure-as-code as a foundational pillar of cloud computing. It’s the reason a two-person startup can survive going viral on social media without an engineer manually adding servers at 2 a.m., and it’s a big part of why the modern cloud-native industry — from tiny side projects to global platforms — can afford to build for scale it doesn’t yet have, instead of predicting that scale months or years in advance.
The Problem & Motivation
Traffic to a website or app is almost never flat. Consider a food-delivery app: quiet at 3 a.m., busy at lunchtime, busiest around 7 p.m. for the dinner rush, and it might spike wildly during a big sports final when everyone orders snacks at once. If you built enough servers to handle the biggest spike of the year, you’d be paying for that much capacity every single hour of every single day — even at 3 a.m. when almost nobody is using the app.
Fixed Capacity: The Old, Painful Way
Before auto-scaling, engineers had two bad choices:
Over-Provision
- Buy or rent enough servers for the worst-case peak, all year round.
- Most of that capacity sits idle 90%+ of the time.
- Massive, wasted infrastructure spend.
Under-Provision
- Buy just enough for “average” traffic.
- Site crashes or slows to a crawl during any spike.
- Lost sales, angry users, damaged reputation.
What Auto-Scaling Actually Solves
- Cost efficiency — you pay for capacity roughly matching what you’re actually using, not your worst-case guess.
- Reliability under load — when real users show up in large numbers, the system responds by growing itself rather than falling over.
- Removing human bottlenecks — no engineer has to be awake at 3 a.m. watching a dashboard and manually launching servers.
- Handling unpredictability — viral social posts, breaking news, flash sales, and DDoS-scale legitimate traffic bursts can’t always be predicted days in advance.
A restaurant that calls in extra waiters only on Friday and Saturday nights, and sends them home on quiet Tuesdays, is “auto-scaling” its staff to match how many customers walk in — without needing the same six waiters standing around bored every single day of the week.
Why “Just Add More Servers Manually” Doesn’t Scale (The Human Kind)
Even after cloud computing made it possible to rent a new server in minutes instead of weeks, a manual process still had a fundamental flaw: it depended on a human being awake, paying attention, and available to act. Traffic spikes don’t politely wait for business hours — a product goes viral on social media at 11 p.m., a competitor’s outage sends their users flooding to your service at 2 a.m., or a payment-processing bug at another company drives a surge of new signups to yours over a weekend. By the time an on-call engineer is paged, has looked at a dashboard, and has clicked “add 5 servers,” minutes have often already passed — and in that time, real users have seen errors, timeouts, or a broken checkout page.
Auto-scaling doesn’t just make scaling faster; it removes the human from the reaction loop entirely for the common cases, freeing engineers to focus on the rarer, genuinely novel problems that do need a person’s judgment.
Core Concepts & Terminology
Before going deeper, let’s build a shared vocabulary. Every term below is something you’ll see again and again in real auto-scaling systems.
Elasticity
The ability of a system to automatically grow (scale out) or shrink (scale in) its resources to match demand, and give back what it doesn’t need.
Scalability
The broader ability of a system to handle more load — elasticity is scalability that happens automatically and reversibly.
Horizontal Scaling (Scale Out / In)
Adding or removing whole copies (instances) of a server or service — like adding more cashiers at a store.
Vertical Scaling (Scale Up / Down)
Making a single machine bigger or smaller — more CPU or RAM on the same server, like giving one cashier a faster register.
Metric
A measured number used to decide when to scale — CPU usage, requests per second, queue length, memory usage.
Threshold
The trigger point for a metric — e.g., “scale out when average CPU usage crosses 70%.”
Cooldown Period
A pause after a scaling action during which the system won’t scale again, to avoid overreacting to the same event twice.
Scaling Policy
The rule set that decides how much to scale, and how fast, given the metrics observed.
Instance / Pod / Replica
A single running copy of your application — the unit that gets added or removed when scaling horizontally.
Load Balancer
A traffic director that spreads incoming requests evenly across all currently-running instances.
Reactive Scaling
Scaling decisions made after observing that load has already changed.
Predictive Scaling
Scaling decisions made before load changes, using forecasts or historical patterns.
Scale Out vs. Scale Up — the two directions
These two ideas are the foundation of everything else in this guide, so let’s slow down. Picture a small shop with one checkout counter.
- Scaling up (vertical) means replacing that one counter with a faster, better-staffed counter — the same number of checkout lines, but each one processes people quicker.
- Scaling out (horizontal) means opening three more checkout counters next to the first — the same speed per counter, but more counters working in parallel.
Cloud auto-scaling almost always favours horizontal scaling, because there’s a hard ceiling on how big one machine can get (you eventually run out of bigger hardware to buy), but there’s effectively no ceiling on how many machines you can run side by side — and adding a new small machine is faster and safer than resizing a live one.
| Aspect | Vertical Scaling | Horizontal Scaling |
|---|---|---|
| How it works | Bigger single machine | More machines in parallel |
| Upper limit | Hits hardware ceiling | Practically unlimited |
| Downtime risk | Often requires a restart | Can add / remove live, zero downtime |
| Complexity | Simple — same code, bigger box | Needs load balancing, stateless design |
| Typical use | Databases, legacy monoliths | Web servers, APIs, microservices |
Architecture & Components
An auto-scaling system is not one single piece of software — it’s a small ecosystem of cooperating parts. Here’s what they are and what job each one does.
Load Balancer
Distributes incoming requests across all healthy instances so no single one is overwhelmed while others sit idle.
Metrics Collector
Continuously gathers CPU, memory, request rate, latency, and custom application metrics from every running instance.
Auto-Scaler / Controller
The “brain” — evaluates metrics against policies and decides whether to scale out, scale in, or do nothing.
Instance Group / Cluster Manager
The component that actually launches new instances or terminates existing ones on the controller’s instruction.
Health Checks
Periodic pings that confirm an instance is alive and able to serve traffic before the load balancer sends it real users.
Image / Template
A pre-baked snapshot (AMI, container image, VM template) describing exactly what a new instance should look like when launched.
A thermostat has a sensor (metrics collector), a target temperature (threshold), a decision unit (controller), and a furnace / AC (instance group) that it turns on or off. Auto-scaling is the same loop, just measuring server load instead of room temperature.
Internal Working
At its heart, every auto-scaler runs a loop called the control loop — a pattern borrowed from control theory (the same maths used in cruise control and thermostats). It repeats, forever, roughly every 15–60 seconds:
Observe
Collect the current value of the chosen metric(s) — e.g., “average CPU across all instances is 82%.”
Compare
Check the observed value against the configured target / threshold — e.g., target is 60%, we’re at 82%, so we’re over.
Decide
Calculate how many instances are needed to bring the metric back near target, respecting min / max bounds and cooldowns.
Act
Instruct the cluster manager to launch (or terminate) the calculated number of instances.
Wait & Repeat
Enter the cooldown period, then loop back to step 1.
A Concrete Formula
Kubernetes’ Horizontal Pod Autoscaler (HPA) uses a simple, well-known formula to decide the new number of instances:
desiredReplicas = ceil( currentReplicas × ( currentMetricValue / desiredMetricValue ) )

# Example:
# currentReplicas      = 4
# currentMetricValue   = 82   (average CPU %)
# desiredMetricValue   = 60   (target CPU %)
desiredReplicas = ceil( 4 × (82 / 60) ) = ceil(5.46) = 6
In plain English: “if we’re running 4 instances and they’re 37% over our target load, we probably need about 37% more instances” — so we round up to 6.
A Minimal Java Simulation
Here’s a simplified Java class that mimics the same core decision logic — not production code, but enough to see the loop with your own eyes.
public class SimpleAutoScaler {

    private int currentInstances;
    private final int minInstances;
    private final int maxInstances;
    private final double targetCpuPercent;

    public SimpleAutoScaler(int initial, int min, int max, double targetCpu) {
        this.currentInstances = initial;
        this.minInstances = min;
        this.maxInstances = max;
        this.targetCpuPercent = targetCpu;
    }

    // Called every polling interval (e.g. every 30 seconds)
    public int evaluate(double observedAvgCpu) {
        double ratio = observedAvgCpu / targetCpuPercent;
        int desired = (int) Math.ceil(currentInstances * ratio);

        // Never go below min or above max — these are our safety rails
        desired = Math.max(minInstances, Math.min(maxInstances, desired));

        if (desired != currentInstances) {
            System.out.printf("Scaling from %d to %d instances (CPU=%.1f%%)%n",
                    currentInstances, desired, observedAvgCpu);
            currentInstances = desired;
        }
        return currentInstances;
    }
}Without a cooldown, this loop can “flap” — scale out, see CPU drop, immediately scale back in, see CPU spike again, scale out again — wasting resources on constant instance churn. This oscillation is often called thrashing.
Smoothing the Signal: Why Raw Metrics Aren’t Enough
A single noisy reading of CPU usage is not trustworthy on its own. A garbage-collection pause in a Java application, a brief network hiccup, or one unusually large request can all cause a momentary spike that doesn’t represent real, sustained demand. For this reason, production auto-scalers almost never act on a single data point. Instead, they use a sliding window average — for example, “the average of the last five 60-second samples” — so that one outlier reading can’t trigger an unnecessary and costly scaling event.
This is conceptually the same idea as a moving average in a stock chart: it smooths out short-term noise so the underlying trend becomes visible. Some systems go a step further and use exponentially weighted moving averages (EWMA), which give more importance to recent samples while still discounting brief spikes — reacting faster to genuine, sustained trends while still ignoring one-off blips.
Extending the Java Simulation with Window Smoothing
Building on the earlier example, here’s how a sliding window might be layered on top of the same decision logic:
import java.util.LinkedList;
import java.util.Queue;

public class SmoothedAutoScaler {

    private final Queue<Double> recentSamples = new LinkedList<>();
    private final int windowSize;
    private final SimpleAutoScaler decisionEngine;

    public SmoothedAutoScaler(int windowSize, SimpleAutoScaler engine) {
        this.windowSize = windowSize;
        this.decisionEngine = engine;
    }

    // Called every time a new raw CPU reading comes in
    public void recordSample(double rawCpuPercent) {
        recentSamples.add(rawCpuPercent);
        if (recentSamples.size() > windowSize) {
            recentSamples.poll(); // drop the oldest sample
        }
    }

    // Called on the scaling loop's fixed interval, using the smoothed value
    public int tick() {
        double average = recentSamples.stream()
                .mapToDouble(Double::doubleValue)
                .average()
                .orElse(0.0);
        return decisionEngine.evaluate(average);
    }
}
Notice that this doesn’t change the core decision formula at all — it simply feeds the decision engine a cleaner, more trustworthy input. This separation of concerns (signal smoothing vs. decision logic) mirrors how real cloud auto-scalers are built internally.
Data Flow & Lifecycle of a Scaling Event
Let’s trace one complete scale-out event, end to end, the way it actually happens in a real cloud environment.
The Stages, Explained
- Trigger detection — the metrics system notices a sustained breach of the threshold (usually requiring the breach to persist for a short window, not just one noisy sample).
- Decision — the auto-scaler computes how many new instances are needed, bounded by min / max limits.
- Provisioning — the cluster manager launches new instances from a pre-built image or container definition. This is often the slowest step — a virtual machine can take 30–90 seconds to boot; a container can take 1–5 seconds.
- Warm-up / readiness — the new instance runs its startup routine (loading configuration, connecting to a database, “warming” in-memory caches) and must pass health checks before it’s trusted with real traffic.
- Registration — the load balancer adds the new instance to its rotation and starts sending it a share of traffic.
- Cooldown — the system pauses further scaling decisions briefly so it can observe the effect of the change before reacting again.
- Scale-in (later) — when demand drops, the reverse happens: the load balancer stops sending an instance new traffic, lets in-flight requests finish (called connection draining or graceful shutdown), and only then terminates it.
If it takes 90 seconds for a new server to become ready, but your traffic spike hits in 10 seconds, auto-scaling alone can’t save you in time — this is exactly why techniques like pre-warmed instance pools, predictive scaling, and lightweight containers exist.
Types of Auto-Scaling
“Auto-scaling” is really an umbrella term covering several distinct strategies. Real systems often combine more than one.
1. Reactive (Dynamic) Scaling
The system watches live metrics and reacts once a threshold is crossed. This is the most common form — e.g., “add an instance whenever average CPU exceeds 70% for 3 minutes.”
2. Scheduled Scaling
Capacity changes at fixed, known times, regardless of live metrics — e.g., a food-delivery app scaling up every day at 11:45 a.m. and 6:45 p.m. ahead of lunch and dinner rushes, because the pattern is predictable and repeats daily.
3. Predictive Scaling
Machine-learning models study historical traffic patterns (daily cycles, weekly cycles, seasonal trends) and pre-scale before the predicted spike arrives, rather than waiting to react to it. AWS Predictive Scaling and Google Cloud’s forecasting-based autoscaler are examples.
4. Vertical Auto-Scaling
Instead of adding more instances, the system resizes existing ones — giving a database server more RAM automatically as its working data set grows, for example. Kubernetes’ Vertical Pod Autoscaler (VPA) is a well-known implementation.
5. Scale-to-Zero (Serverless)
Taken to its logical extreme: when there’s truly no traffic, run zero instances and pay nothing. The very first request “cold-starts” a new instance on demand. This is the model behind AWS Lambda, Google Cloud Functions, and Knative.
Combining Strategies in Practice
Real production systems rarely rely on just one of these five strategies in isolation. A typical e-commerce platform might use scheduled scaling to pre-provision extra capacity ahead of a known flash sale at noon, reactive scaling to handle whatever unexpected extra demand shows up on top of that forecast, and scale-to-zero for background functions like generating a weekly report that only needs to run once. Thinking of these as a toolbox rather than a single choice is usually the right mental model — the question isn’t “which type of auto-scaling should we use?” but “which combination best fits each individual component of our system?”
| Type | Trigger | Best for | Weakness |
|---|---|---|---|
| Reactive | Live metric threshold | Unpredictable, variable load | Lag between spike and response |
| Scheduled | Calendar / clock time | Known daily / weekly patterns | Blind to unexpected spikes |
| Predictive | Forecast model | Recurring but complex patterns | Needs historical data, can mispredict |
| Vertical | Live metric threshold | Stateful single-node systems (DBs) | Often needs a restart, hard ceiling |
| Scale-to-zero | Presence / absence of requests | Bursty, infrequent workloads | “Cold start” delay on first request |
Advantages, Disadvantages & Trade-offs
Advantages
- Pay roughly for what you use, not your worst-case peak.
- Automatically absorbs traffic spikes without human intervention.
- Reduces on-call burden and 3 a.m. manual firefighting.
- Improves fault tolerance — a crashed instance can be auto-replaced.
- Enables true elasticity for seasonal or viral businesses.
Disadvantages
- Added architectural complexity (stateless design, health checks, load balancing).
- Scaling lag — new capacity isn’t instant, especially for VMs.
- Risk of “thrashing” if thresholds and cooldowns are misconfigured.
- Harder to reason about cost — bills can spike unexpectedly with runaway scaling.
- Not all components scale easily (e.g., traditional relational databases).
Key Trade-offs to Weigh
- Responsiveness vs. stability — scaling faster reacts to spikes quicker, but is more prone to overreacting to noisy, short-lived blips.
- Cost vs. headroom — a lower scale-out threshold (e.g., 50% CPU) leaves safety margin but costs more; a higher one (e.g., 85%) saves money but leaves less buffer for sudden spikes.
- Simplicity vs. sophistication — reactive threshold-based rules are easy to understand and debug; predictive ML-based scaling can perform better but is a black box when it goes wrong.
Performance & Scalability
Good auto-scaling isn’t just “add more machines” — it directly affects latency (how fast a single request is answered) and throughput (how many requests the system can handle per second).
Little’s Law — the math behind capacity planning
A classic formula from queueing theory that auto-scaling systems implicitly rely on:
L = λ × W

# L = average number of requests "in the system" (being processed)
# λ = arrival rate (requests per second)
# W = average time each request takes to process

# Example: if requests arrive at 200/sec and each takes 0.5 sec to process,
# you need enough capacity to handle 200 × 0.5 = 100 requests "in flight" at once.
This tells you, mathematically, how many concurrent workers / instances you need for a given traffic rate and processing time — the theoretical foundation behind every scaling formula.
Bottlenecks Auto-Scaling Doesn’t Fix by Itself
Auto-scaling works best when the component being scaled is stateless — meaning it doesn’t hold onto data that only it knows about between requests. Stateful components (databases, in-memory caches, WebSocket connections) need special handling, covered later in this guide.
Latency vs. Throughput: Two Different Goals
It’s tempting to think “more instances always means a faster system,” but latency (the time for one request to complete) and throughput (the total number of requests handled per second) don’t always move together. Adding instances mainly increases throughput — the system can now process more requests in parallel. It doesn’t necessarily make any single request faster, unless the bottleneck was queuing delay caused by too few workers competing for too much incoming work.
In fact, if scaling out adds new instances that then compete for a shared, unscaled resource — like a database connection pool with a fixed maximum size — throughput can plateau or even worsen, because more processes are now fighting over the same limited number of connections. This is a classic example of Amdahl’s Law in practice: a system’s overall speedup from adding parallel workers is capped by whatever portion of the work still has to happen serially, through a single shared resource.
Concurrency Considerations Within Each Instance
Auto-scaling adds instances across a fleet, but each individual instance also has an internal concurrency model that affects how efficiently it uses the CPU it’s given. A Java web server, for example, might use a thread pool where each incoming request is handled by a worker thread pulled from a fixed-size pool:
ExecutorService requestPool = Executors.newFixedThreadPool(200);

requestPool.submit(() -> {
    // handle one incoming HTTP request
    processRequest(request);
});
If that pool size (200, in this example) is too small, requests queue up waiting for a free thread even though the instance’s CPU may have spare capacity — and the auto-scaler, watching CPU, won’t necessarily notice the problem, because CPU usage looks low while requests are actually stuck waiting. This is exactly why many teams pair CPU-based scaling with a second metric like request latency or queue depth: CPU alone can hide concurrency bottlenecks that live entirely inside a single instance.
High Availability & Reliability
Auto-scaling and high availability (HA) are close cousins, but they solve different problems. HA is about surviving failure; auto-scaling is about matching capacity to demand. Together, they make a system both resilient and efficient.
How Auto-Scaling Improves Reliability
- Self-healing — if an instance fails a health check, the auto-scaler can terminate it and launch a fresh replacement automatically.
- Multi-zone spread — cloud auto-scaling groups typically distribute instances across multiple data-centre “availability zones,” so a single zone outage doesn’t take down the whole service.
- Graceful degradation — with enough headroom, a spike in traffic slows the system down gradually rather than crashing it outright.
Risks If Done Poorly
If every new instance boots at once and immediately tries to connect to the same database or cache, it can overwhelm that downstream system — sometimes causing the very outage auto-scaling was meant to prevent. Staggered startup and connection pooling help avoid this.
If a database can’t handle the traffic being sent by newly-scaled app servers, the app servers may all queue up waiting on slow database responses, appearing “unhealthy,” triggering even more scale-out — worsening the underlying database bottleneck instead of fixing it.
Security Considerations
Auto-scaling widens your infrastructure’s surface area dynamically, which brings a few security concerns that a fixed, static fleet doesn’t have.
- Image / template hygiene — every new instance is a clone of a base image. If that image has a vulnerability or outdated dependency, every scaled-out copy inherits it instantly.
- Secrets management — new instances need credentials (database passwords, API keys) at boot time; these must come from a secure secrets manager, never baked into the image itself.
- Cost-based denial of service — an attacker who can trigger unlimited scale-out (e.g., by flooding an endpoint) can drive your cloud bill sky-high even if the service itself doesn’t crash. This is sometimes called a “financial DoS” attack.
- Least-privilege IAM roles — the auto-scaler and new instances should only have the minimum cloud permissions needed, so a compromised instance can’t be used to spin up unrelated resources.
- Network exposure — every new instance is a new potential entry point; consistent firewall / security-group rules must apply automatically to every instance, not be configured by hand each time.
Always set a hard maxInstances ceiling on any auto-scaling policy. It’s your last line of defense against both runaway bugs and cost-based attacks — no scaling policy should be allowed to grow without limit.
It’s also worth remembering that every new instance briefly exists in a more vulnerable state than a long-running one: it’s mid-boot, still loading configuration and secrets, and hasn’t yet had a chance to receive the latest security patches applied manually to older instances. This is exactly why the “golden image” approach — rebuilding and re-testing the base template regularly, rather than patching individual live servers by hand — matters so much in an elastic environment; a stale image means every single new instance launches already out of date, silently reintroducing a vulnerability that was supposedly fixed weeks ago.
Monitoring, Logging & Metrics
You cannot auto-scale what you cannot measure. Observability is the foundation the entire system stands on.
Common Metrics Used to Trigger Scaling
| Metric | What it measures | Good for |
|---|---|---|
| CPU utilization | How busy the processor is | Compute-heavy workloads |
| Memory utilization | RAM usage per instance | Memory-heavy caches, JVM apps |
| Request rate | Requests per second | Web APIs, general web traffic |
| Queue length | Pending jobs waiting to be processed | Background workers, batch pipelines |
| Latency (p95 / p99) | Response time at the slow tail | User-experience-sensitive services |
| Custom app metric | Anything business-specific | Domain-specific load, e.g. active game rooms |
What Good Observability Looks Like
- Metrics — numeric time-series data (CPU %, req/sec) collected at regular intervals.
- Logs — detailed event records for debugging what happened during a specific scaling event.
- Traces — end-to-end views of a single request as it passes through multiple services, useful for finding which component is actually the bottleneck.
- Alerts — notifications when scaling hits its max limit, or when scaling events happen abnormally often (a sign of thrashing).
- Dashboards — visualising instance count over time next to traffic and latency, so engineers can sanity-check the auto-scaler’s decisions after the fact.
Always log every scaling decision along with the metric values that triggered it. When something goes wrong at 3 a.m., that log is the difference between a 5-minute fix and a 3-hour investigation.
Debugging a Scaling Incident, Step by Step
When a scaling policy misbehaves — either scaling too slowly during a real spike, or thrashing unnecessarily during normal traffic — a consistent debugging approach saves hours of guesswork:
- Pull up the instance-count graph next to the raw metric graph (e.g., CPU) for the same time window, and visually confirm they move together the way the policy intends.
- Check the scaling event log for the exact metric values recorded at each decision point, not just “scaled from 4 to 6.”
- Look for a gap between when the metric crossed the threshold and when new capacity actually became healthy — that gap is your real-world reaction time, and it’s often longer than engineers assume.
- Cross-reference downstream dependency graphs (database CPU, cache hit rate) to rule out the possibility that the bottleneck was never the layer being auto-scaled in the first place.
Deployment & Cloud Implementations
Every major cloud and orchestration platform ships its own flavour of auto-scaling. The concepts are identical; the names differ.
AWS Auto Scaling Groups (ASG)
Manages EC2 virtual-machine fleets with min / max / desired capacity and scaling policies (target tracking, step, scheduled, predictive).
Kubernetes HPA
Horizontal Pod Autoscaler adjusts the number of pod replicas for a deployment based on CPU, memory, or custom metrics.
Kubernetes VPA
Vertical Pod Autoscaler adjusts CPU / memory requests for existing pods instead of changing their count.
Kubernetes Cluster Autoscaler
Adds or removes entire worker nodes (VMs) when pods can’t be scheduled due to insufficient cluster capacity.
Google Cloud MIG
Managed Instance Groups automatically resize based on CPU, load-balancer capacity, or custom Cloud Monitoring metrics.
Azure VM Scale Sets
Azure’s equivalent to AWS ASGs — automatically scales groups of identical VMs based on defined rules.
AWS Lambda / Cloud Functions
Fully serverless scale-to-zero-and-beyond — the platform manages instance count entirely; you write only the function code.
KEDA (Kubernetes Event-Driven Autoscaling)
Extends Kubernetes scaling to react to event sources like message-queue depth (Kafka, SQS, RabbitMQ), not just CPU / memory.
A Minimal Kubernetes HPA Definition
apiVersion: autoscaling/v2
kind: HorizontalPodAutoscaler
metadata:
  name: checkout-service-hpa
spec:
  scaleTargetRef:
    apiVersion: apps/v1
    kind: Deployment
    name: checkout-service
  minReplicas: 3
  maxReplicas: 30
  metrics:
    - type: Resource
      resource:
        name: cpu
        target:
          type: Utilization
          averageUtilization: 65
  behavior:
    scaleDown:
      stabilizationWindowSeconds: 300   # cooldown before scaling in
Notice the same core ideas from earlier sections appearing directly as configuration: minReplicas / maxReplicas are the safety rails, averageUtilization: 65 is the threshold, and stabilizationWindowSeconds is the cooldown.
Infrastructure as Code: Defining Scaling Declaratively
In modern deployments, scaling policies are almost never configured by clicking through a cloud console — they’re written as code (using tools like Terraform or AWS CloudFormation), version-controlled, reviewed, and applied automatically. This means a scaling policy can be tested, rolled back, and audited exactly like application code. A simplified Terraform snippet for an AWS Auto Scaling Group might look like this:
resource "aws_autoscaling_policy" "scale_out" {
  name                   = "target-tracking-cpu"
  autoscaling_group_name = aws_autoscaling_group.web.name
  policy_type            = "TargetTrackingScaling"

  target_tracking_configuration {
    predefined_metric_specification {
      predefined_metric_type = "ASGAverageCPUUtilization"
    }
    target_value = 60.0
  }
}

resource "aws_autoscaling_group" "web" {
  min_size                  = 2
  max_size                  = 20
  desired_capacity          = 3
  vpc_zone_identifier       = [subnet_a, subnet_b, subnet_c]  # spread across zones
  health_check_type         = "ELB"
  health_check_grace_period = 60
}
Defining infrastructure this way is what makes disaster recovery realistic: if an entire region were to go down, the exact same Terraform code could be re-applied against a different region to rebuild the whole scaling setup in minutes, rather than someone trying to remember which console settings to click.
Databases, Caching & Load Balancing
Auto-scaling the stateless layer (web servers, APIs) is the easy 80%. The stateful layer — databases and caches — is the hard 20%, because data can’t just be thrown away or duplicated casually.
Databases
- Read replicas — add more read-only copies of the database to handle growing read traffic; writes still go to one primary.
- Sharding / partitioning — split data across multiple database instances by a key (e.g., user-ID range), so each shard handles a fraction of total load.
- Managed elastic databases — services like Amazon Aurora Serverless or DynamoDB auto-scale read / write capacity automatically, abstracting away manual replica management.
- Connection pooling — as more app instances come online, each opens new database connections. Without a pooling layer (like PgBouncer for PostgreSQL) sitting in front of the database, a large scale-out event can exhaust the database’s maximum connection limit even though the database’s actual CPU and memory are nowhere near their limit.
- Vertical headroom first — because a primary database is often much harder to split than an application server, many teams simply give the primary database more CPU / RAM (vertical scaling) as the first line of defence, reserving sharding for once that ceiling is truly reached.
A useful mental model: the stateless application layer scales like a crowd of interchangeable workers — any of them can pick up any task. The database, by contrast, scales more like a single, specialised librarian who knows exactly where every book is; you can hire assistants (read replicas) to help with lookups, or split the library into wings (sharding), but you can’t just clone the librarian’s memory instantly.
Caching
A cache (like Redis or Memcached) reduces load on the database by storing frequently-requested data in fast memory. As app servers scale out, the cache layer often needs to scale too, using consistent hashing so cache keys are spread evenly and predictably across cache nodes even as nodes are added or removed.
Load Balancing
The load balancer is the unsung hero of auto-scaling — it must discover new instances the moment they’re healthy, and stop sending traffic to instances the moment they’re marked for removal. Common algorithms include:
| Algorithm | How it decides |
|---|---|
| Round robin | Cycles through instances in order, one request each |
| Least connections | Sends the next request to whichever instance has the fewest active connections |
| Weighted | Sends more traffic to larger / more powerful instances |
| Consistent hashing | Routes based on a hash of the request (e.g., user ID), useful when cache locality matters |
APIs & Microservices
In a microservices architecture, an application is broken into many small, independently-deployable services (e.g., a “checkout” service, an “inventory” service, a “notifications” service) instead of one giant monolith. Auto-scaling becomes more powerful here — each service can scale independently, based on its own load, rather than one blunt scaling rule for the whole application.
Above, the Inventory service might be scaled to 8 replicas because it’s read-heavy and hit constantly, while Notifications stays at 1 because it processes an asynchronous queue at its own pace. This kind of independent, per-service scaling is a major reason companies adopt microservices in the first place.
API Design Considerations
- Statelessness — APIs should not store session data in local memory; use a shared store (Redis, database) so any instance can serve any request.
- Idempotency — since instances can be added / removed mid-request, retried requests (from load-balancer failover) should be safe to repeat without side effects.
- Backpressure — APIs should be able to signal “I’m at capacity” (e.g., HTTP 429 Too Many Requests) rather than silently failing, giving auto-scaling time to catch up.
- Rate limiting — protects downstream services from being overwhelmed by a sudden, massive fan-out of newly-scaled callers.
Advanced Topics: Consensus, Consistency & Failure Recovery
So far, most of this guide has treated scaling as a fairly local decision: watch a metric, add or remove an instance. But once a system grows large enough to run across many machines and multiple data centres, several deeper distributed-systems questions start to matter.
The CAP Theorem, and What It Means for Scaled Systems
The CAP theorem states that a distributed data store can only guarantee two of the following three properties at the same time, during a network failure:
- Consistency (C) — every read receives the most recent write, or an error.
- Availability (A) — every request receives a (non-error) response, even if it’s not the most recent data.
- Partition tolerance (P) — the system keeps working even if network messages between nodes are lost or delayed.
Since real networks do experience partitions, partition tolerance is effectively mandatory, which means every distributed database really has to choose between prioritising consistency or availability when a network split occurs. This matters directly for auto-scaling: when you scale out a stateful service across multiple nodes or data centres, you inherit this trade-off. A system tuned for availability (like many NoSQL databases) will happily keep accepting writes on both sides of a network split, then have to reconcile conflicting data afterwards. A system tuned for consistency will refuse some requests during the split rather than risk serving stale or conflicting data.
Consensus: How a Cluster Agrees on “How Many Instances Right Now?”
In a large auto-scaling system, multiple controller replicas may exist for redundancy — so what stops two of them from both deciding, at the same moment, to scale out, and doubling the intended capacity? This is where consensus algorithms like Raft or Paxos come in. They allow a group of distributed nodes to agree on a single, authoritative value (like “the current desired instance count is 12”) even if some nodes are slow, crashed, or temporarily unreachable. Kubernetes itself relies on etcd, which uses the Raft consensus algorithm, to store the one true state of the cluster that all controllers — including the Horizontal Pod Autoscaler — read from and write to.
Partitioning & Replication in Scaled Data Stores
Two closely related techniques let stateful systems grow past the limits of a single machine:
- Partitioning (sharding) — splitting data across multiple nodes by some key, so each node holds only a fraction of the total data and load. A common scheme is consistent hashing, which minimises how much data has to move when a node is added or removed — critical for a data layer that itself needs to auto-scale.
- Replication — keeping multiple copies of the same data on different nodes, so a single node failure doesn’t lose data and read load can be spread across replicas. Replication can be synchronous (safer, slower) or asynchronous (faster, small risk of losing the most recent writes on failure).
Failure Recovery in an Elastic System
Because instances in an auto-scaled system come and go constantly, failure isn’t an edge case — it’s a routine, expected event the system must handle gracefully. Two techniques dominate here:
Self-Healing
- Health checks detect a failed instance within seconds.
- The cluster manager terminates it and launches a replacement automatically.
- The load balancer stops routing to it immediately on failure detection.
Graceful Degradation
- Non-critical features (recommendations, analytics) are shed first under extreme load.
- Core functionality (checkout, login) is protected and kept running.
- Circuit breakers stop calling failing dependencies instead of piling up retries.
Disaster recovery adds one more layer on top: regular backups of stateful data, and the ability to rebuild an entire fleet of instances from scratch — configuration, images, and scaling policies included — in a new region if an entire data centre becomes unavailable. Because a well-designed auto-scaling group is defined declaratively (as code, not as manually clicked settings), this “rebuild from nothing” recovery is often just a matter of re-running the same automation in a new location.
Design Patterns & Anti-Patterns
Helpful Patterns
Target Tracking
Define a target value for one metric (e.g., “keep CPU at 60%”) and let the system automatically compute how many instances that requires — simpler than hand-writing step rules.
Predictive Pre-Warming
Use forecasts to launch extra capacity minutes before a known event (e.g., a marketing email blast) rather than reacting after users arrive.
Circuit Breaker
When a downstream dependency (like a database) is overwhelmed, temporarily stop calling it and fail fast, preventing cascading failure while capacity catches up.
Bulkhead
Isolate resources per component so one overloaded service can’t exhaust shared resources (like connection pools) needed by others.
Warm Pool
Keep a small number of pre-booted, idle instances ready to absorb sudden spikes instantly, bypassing the usual boot-time delay.
Anti-Patterns to Avoid
Common Mistakes
- No cooldown — causes thrashing (rapid scale out / in cycles).
- No max limit — a bug or attack can scale infinitely and blow up your cloud bill.
- Scaling the wrong metric — e.g. scaling on CPU when the real bottleneck is database connections.
- Stateful instances — storing session / user data in local memory breaks when that instance is removed.
- Ignoring dependency limits — scaling app servers without checking if the database or third-party API can handle the extra load.
Best Practices & Common Mistakes
- Design for statelessness first. Every instance should be disposable and replaceable at any moment — if killing any single instance right now, without warning, would lose data or break a user’s session, that’s a design problem to fix before relying on auto-scaling.
- Set sane min / max bounds. Never leave a scaling policy unbounded. A minimum keeps enough capacity around for baseline reliability even during a quiet period or a metrics outage; a maximum is your safety rail against runaway costs from bugs or abuse.
- Use multiple metrics carefully. Combine CPU with request latency or queue depth for a fuller picture, but avoid conflicting signals — if one metric says “scale out” and another says “scale in” at the same time, define clearly which one wins, rather than letting the system flap between the two.
- Test scale-out and scale-in separately, including simulated failure of new instances during boot. It’s easy to test that adding capacity works; it’s just as important, and often skipped, to test that removing capacity doesn’t drop in-flight requests or lose queued work.
- Tune cooldowns to your instance boot time — the cooldown should be at least as long as it takes a new instance to become healthy, otherwise the scaler will keep adding more capacity on top of capacity that simply hasn’t finished starting up yet, overshooting the real need.
- Monitor cost alongside performance. A dashboard showing “instance count vs. dollars per hour” prevents nasty billing surprises, and makes it obvious at a glance when a policy is behaving abnormally compared to historical norms.
- Load test before trusting it in production. Simulate real spike shapes (sudden, gradual, sustained) to validate your policy actually behaves as expected — a policy that looks correct on paper can still respond too slowly, or overreact, when faced with a real traffic curve.
- Plan for the slowest dependency. Your auto-scaler is only as good as the weakest link it can’t scale (often the database) — scaling the front door wide open while the back room stays the same size just moves the bottleneck, it doesn’t remove it.
- Document the “why” behind every threshold. A target of 65% CPU or a cooldown of 300 seconds should have a written reason behind it (from a load test, an incident, or a capacity model), so future engineers can adjust it with confidence instead of guessing.
Real-World Industry Examples
FAQ, Summary & Key Takeaways
Does auto-scaling always save money?
Usually, yes, compared to a fixed fleet sized for peak load — but only if it’s configured correctly. A misconfigured policy (no max limit, too-sensitive thresholds) can actually increase costs through constant churn or runaway scale-out.
Can auto-scaling replace load testing?
No. Auto-scaling reacts to real load, but load testing tells you whether your system, database, and downstream dependencies can actually handle the scaled-up traffic before it happens for real.
Is auto-scaling only for the cloud?
It’s most common in cloud environments because resources can be provisioned on demand, but on-premises data centres can implement similar concepts with pre-purchased spare hardware and orchestration tools like Kubernetes.
What’s the difference between auto-scaling and load balancing?
Load balancing distributes existing traffic across existing instances. Auto-scaling changes how many instances exist in the first place. They work together, but solve different problems.
Why do new instances sometimes fail right after scaling out?
Often the “thundering herd” problem — many new instances hitting a database or dependency at once — or insufficient warm-up time before health checks pass.
How fast can auto-scaling actually respond?
It depends heavily on what’s being scaled. Virtual machines typically take 30 seconds to a few minutes to boot and become healthy. Containers (like Kubernetes pods) can often be ready in a few seconds, since the underlying host is already running and only the application process needs to start. Serverless functions can respond in milliseconds to a few seconds for a “cold start,” and are effectively instant for requests that arrive while a function instance is still warm.
Should every application use auto-scaling?
Not necessarily. A small internal tool with steady, predictable, low traffic may get little benefit from the added complexity of auto-scaling and might be simpler and cheaper to run on a single fixed-size instance. Auto-scaling earns its complexity when traffic is variable, growth is uncertain, or availability truly matters.
What happens to in-progress requests when an instance is scaled in?
A well-behaved system uses connection draining (sometimes called a graceful shutdown): the load balancer stops sending the instance new requests immediately, but lets any requests already in progress finish normally before the instance is terminated, usually within a configurable grace period.
Summary
Auto-scaling is the practice of automatically adjusting the amount of compute a system uses to match its real, measured demand — growing when load rises, shrinking when load falls, and doing so without a human clicking buttons in the middle of the night. It emerged from decades of painful experience with over-provisioning, under-provisioning, and manual firefighting, and today it is a foundational practice at organisations of every size, from solo developers on the free tier of a cloud provider to global platforms running tens of thousands of microservices.
Key Takeaways
- Auto-scaling automatically adjusts computing capacity to match real demand — no manual intervention required.
- Horizontal scaling (more instances) is generally preferred over vertical scaling (bigger instances) for its flexibility and lack of a hard ceiling.
- Every auto-scaler runs a control loop: observe a metric, compare to a threshold, decide, act, then cool down.
- Reactive, scheduled, predictive, vertical, and scale-to-zero are the five major strategies — most real systems mix several.
- Stateless design is the prerequisite that makes horizontal auto-scaling safe and effective.
- Databases and other stateful systems require different techniques — replicas, sharding, and managed elastic services.
- Good observability (metrics, logs, traces, alerts) is not optional — it’s the foundation the whole system depends on.
- Always set hard min / max bounds to protect against both technical thrashing and cost-based abuse.

