What Is Infrastructure Cost Optimization?
A complete, beginner-friendly walkthrough of how engineering teams keep cloud and infrastructure bills under control — from core ideas to production-grade practice, with real examples from Netflix, Amazon, Spotify, Airbnb and more.
Introduction & History
Imagine you rent a giant warehouse to store boxes for your toy business. At first you rent a small room. As your business grows, you keep renting more and more space — but you never go back and check whether you still need all of it. A year later, you are paying for five rooms, but only using two. The other three are full of empty boxes and old furniture nobody uses anymore. You are paying rent for space you do not need.
Infrastructure cost optimization is the practice of doing the opposite of that story. It means constantly checking what computing resources — servers, storage, databases, networking — a company is paying for, and making sure it is only paying for what it actually needs, while still keeping everything fast, reliable and safe.
In the world of software, “infrastructure” means all the computing stuff that keeps an application running: virtual machines (rented computers), storage disks, databases, networks, load balancers and more. Companies used to buy and own physical servers sitting in a room called a data center. Today, most companies rent this infrastructure from cloud providers like Amazon Web Services (AWS), Microsoft Azure and Google Cloud Platform (GCP) — paying by the hour, minute, or even by the second, similar to how you pay a taxi by the mile.
1.1 A Short History
On-premise data centers
Companies bought physical servers up front. Capacity was fixed, expenses were sunk, and the classic answer to “we might need more traffic later” was to over-buy hardware “just in case”.
AWS launches EC2 & S3
Pay-as-you-go computing arrives. You can rent a server for an hour and give it back when you are done. Cost stops being a one-off purchase and becomes a running meter.
Cloud adoption grows
Elastic scaling becomes possible. Whole start-up ecosystems are born on the assumption that infrastructure appears in minutes and disappears just as quickly.
Cloud bills spiral
“Cloud waste” becomes a boardroom topic. Companies realise that the same elasticity that made growth easy also made forgotten servers, orphaned disks and runaway auto-scaling silently expensive.
FinOps Foundation formed
Cost optimisation becomes a formal discipline with its own vocabulary, certifications and cross-functional practices linking engineering, finance and product together.
AI workloads & GPU costs
The rise of large-model training and inference makes GPU spend one of the fastest-growing lines on any modern cloud bill. Cost optimisation becomes mission-critical, not optional.
Before the cloud, if a company wanted more computing power, it had to buy physical servers — a slow, expensive and rigid process that could take weeks or months. Because buying hardware was so painful, companies would buy far more than they needed “just in case”, leading to expensive, underused data centers.
When AWS launched its EC2 (Elastic Compute Cloud) service in 2006, it changed everything. Suddenly, companies could rent a server for an hour and give it back when they were done, similar to renting a bicycle instead of buying one. This was revolutionary — but it also created a brand new problem: it became too easy to spin up resources, and just as easy to forget about them. Bills started growing out of control, and companies realised they needed a deliberate, ongoing practice to manage cloud spending. That practice is what we now call infrastructure cost optimisation, and more broadly, “FinOps” (a mix of “Finance” and “DevOps”).
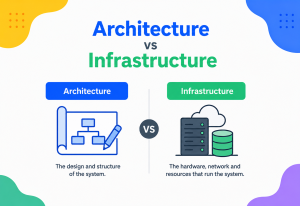
Infrastructure cost optimisation is like being a smart driver who checks tire pressure, avoids unnecessary trips, and takes the highway instead of a longer backroad — not to make the car slower or unsafe, but to get where you are going while spending less on gas.
Problem & Motivation
Why does this topic matter so much? Because cloud spending has become one of the largest and fastest-growing expenses for modern companies — often second only to salaries. And unlike salaries, cloud bills can silently balloon without anyone noticing, because a single engineer can click a few buttons and create thousands of dollars of monthly cost in seconds.
2.1 The Core Problems That Cost Optimization Solves
Idle Resources
Servers running 24/7 even though nobody uses them at night or on weekends — like leaving all the lights on in an empty office.
Oversized Machines
Renting a giant truck to deliver a single envelope. Many servers are far bigger (and pricier) than the workload actually requires.
Orphaned Storage
Disks and backups left behind after a project ends — nobody remembers to delete them, so the bill keeps arriving.
Lack of Visibility
Nobody can tell which team, product or feature is responsible for which cost, so nobody feels accountable for the waste.
No Pricing Strategy
Paying full “walk-in” price for resources instead of using discounts available for planning ahead or being flexible.
Runaway Scaling
Auto-scaling systems that expand aggressively during traffic spikes but never scale back down.
These problems are dangerous not because cloud computing is inherently wasteful, but because it is elastic and invisible. Unlike a factory where extra machines are physically visible taking up floor space, wasted cloud resources are just numbers on a dashboard that few people check daily. Studies from FinOps industry surveys consistently estimate that 25–35% of cloud spend is wasted — money spent on resources providing no real business value.
2.2 Why It Matters to the Business
Every dollar of avoidable infrastructure spend is a dollar that could have gone toward hiring, R&D, marketing, or (bluntly) profit. At scale, a 20% reduction in cloud bill can be the difference between a healthy quarter and a layoff round. That is why boards now ask the same tough questions about cloud spend that they ask about marketing spend: “what did we get for it?”
Whether you are a backend engineer, a DevOps engineer, or a solutions architect, understanding cost optimisation makes you far more valuable. Companies increasingly expect every engineer — not just a dedicated “cost team” — to write cost-aware code and design cost-aware systems.
Core Concepts
Before diving deeper, let us build a vocabulary. Each term below is explained simply, with a “what / why / analogy” structure so that a beginner and a senior engineer can pull useful meaning from the same paragraph.

3.1 Rightsizing
What. Matching the size (CPU, memory) of a server to the actual workload it runs.
Why. Oversized servers waste money; undersized ones crash or slow down.
Analogy. Buying shoes in your actual size — not two sizes too big “just in case”, and not too small so your feet hurt.
3.2 Elasticity & Auto-scaling
What. Automatically adding more servers when traffic increases, and removing them when traffic drops.
Why. You pay only for what is needed at each moment, rather than always paying for peak capacity.
Analogy. A restaurant that calls in extra waiters only during the dinner rush, then lets them go home once things quiet down.
3.3 Reserved & Committed Use Pricing
What. Promising the cloud provider you will use a certain amount of resources for 1–3 years, in exchange for a discount (often 30–70% cheaper).
Why. Cloud providers reward predictability the same way a gym rewards an annual membership over daily drop-ins.
Analogy. A phone contract vs paying full price for a phone month to month.
3.4 Spot / Preemptible Instances
What. Spare, unused capacity that cloud providers sell at a steep discount (up to 90% off) — but they can take it back with little warning.
Why. Great for workloads that can be interrupted and retried, like batch processing.
Analogy. Standby airline tickets — very cheap, but you might get bumped if a full-fare passenger needs the seat.
3.5 Storage Tiering
What. Moving rarely-used data to cheaper, slower storage, and keeping frequently-used data on fast, expensive storage.
Why. Not all data needs to be instantly accessible.
Analogy. Keeping this season’s clothes in your closet, and off-season clothes in a cheaper storage unit.
3.6 Tagging & Cost Allocation
What. Labeling every resource with metadata like team name, project or environment (e.g. team=payments, env=staging).
Why. You cannot optimise what you cannot measure or attribute to an owner.
Analogy. Writing names on food containers in a shared office fridge, so everyone knows whose lunch is whose.
3.7 FinOps
What. A cultural practice that brings engineering, finance and business teams together to make data-driven spending decisions.
Why. Cost optimisation is not a one-time cleanup — it is a continuous, cross-team discipline.
Analogy. A household budget meeting where everyone in the family discusses spending together, instead of one person secretly managing all the money.
3.8 Total Cost of Ownership (TCO)
What. The full cost of running something — not just the server bill, but engineering time, licensing, support and risk.
Why. The cheapest-looking option on paper is not always the cheapest overall.
Analogy. A cheap used car that needs constant repairs may cost more over five years than a slightly pricier reliable one.

Architecture & Components
Infrastructure cost optimisation is not a single tool — it is a system made of several moving parts working together, similar to how a home budgeting system involves your bank, your budgeting app, your receipts, and your own decisions.
4.1 Key Architectural Components
Cost & Usage Data Source
Raw billing exports from the cloud provider — the “receipts” of everything you have spent.
Tagging Layer
Metadata rules that map every dollar spent back to a team, product, or environment.
Visualisation / Dashboards
Tools like AWS Cost Explorer, Azure Cost Management, GCP Billing Reports, or third-party tools like Kubecost, CloudHealth or Spot.io.
Recommendation Engine
Algorithms that detect underused resources, suggest rightsizing, or flag anomalies such as sudden spend spikes.
Automation Layer
Scripts, schedulers, or policy engines that automatically shut down idle resources or resize instances during safe windows.
Governance Layer
Budgets, alerts and approval workflows that prevent overspending before it happens instead of only reporting it afterwards.
A cost optimisation system without visibility is like trying to lose weight without ever stepping on a scale. You need the “measurement layer” (tagging + dashboards) before the “action layer” (automation) can be trusted.
Internal Working
Let us go one level deeper and see how a typical automated cost-optimisation system actually decides what to do. Understanding the internal loop makes the difference between blindly trusting a recommendation and being able to challenge one that does not fit your workload.
5.1 Step-by-Step: How a Rightsizing Recommendation Is Generated
- Collect metrics — CPU, memory, disk I/O and network usage are gathered for each server over a period (commonly 14 days).
- Compute percentiles — instead of looking at the average (which hides spikes), tools look at the 95th or 99th percentile usage, so brief traffic bursts are not ignored.
- Compare against instance catalog — the system checks if a smaller (cheaper) machine type could still handle that peak usage with a safety buffer.
- Estimate savings — the price difference between the current machine and the recommended one is calculated.
- Score confidence — the system estimates how safe the change is (e.g. “low risk” if usage has been very stable).
- Present or auto-apply — depending on policy, this becomes a suggestion for a human, or an automatic action during a low-traffic maintenance window.
Here is a simplified Java example that mimics the core logic of a rightsizing checker — comparing a server’s peak CPU usage against thresholds to suggest a smaller instance size:
public class RightsizingAdvisor {

    // A very simplified instance catalog: name -> vCPU capacity
    private static final Map<String, Integer> INSTANCE_CATALOG = Map.of(
        "large",  8,
        "medium", 4,
        "small",  2
    );

    public String recommend(String currentInstance, double p95CpuUsagePercent) {
        int currentVcpu = INSTANCE_CATALOG.get(currentInstance);
        // Estimate the vCPUs actually needed, with a 30% safety buffer
        double neededVcpu = (currentVcpu * (p95CpuUsagePercent / 100.0)) * 1.3;

        String bestFit = currentInstance;
        for (Map.Entry<String, Integer> entry : INSTANCE_CATALOG.entrySet()) {
            if (entry.getValue() >= neededVcpu && entry.getValue() < currentVcpu) {
                bestFit = entry.getKey();
            }
        }
        return bestFit.equals(currentInstance)
            ? "No change needed - instance is well-sized."
            : "Recommend downsizing from " + currentInstance + " to " + bestFit;
    }
}
This is, of course, a simplified version. Real-world tools (like AWS Compute Optimizer) analyse weeks of granular metrics, factor in memory and network as well as CPU, and account for seasonal traffic patterns (e.g. an e-commerce site’s Black Friday spike) so they do not recommend downsizing right before a predictable surge.

5.2 How Auto-scaling Works Internally
Data Flow & Lifecycle
Cost optimisation follows a repeating lifecycle — it is never “done” once, because usage patterns constantly change as products grow, features launch and traffic shifts. Understanding the loop is what turns cost optimisation from a one-off cleanup into a durable engineering discipline.
Measure — collect billing & usage data
Pull raw cost and usage reports from the cloud provider, tagged by team, service and environment. Without accurate raw data, everything downstream is a guess.
Allocate — attribute cost to owners
Map every dollar to a responsible team so there is clear accountability, not a shared “mystery bill” that nobody feels personally responsible for.
Analyse — find waste & inefficiency
Detect idle resources, oversized machines, orphaned storage and missed pricing opportunities. Rank them by likely savings and by the risk of acting on them.
Optimise — take action
Rightsize, shut down, switch pricing models, or redesign architecture. Every action either lowers cost, protects reliability, or (ideally) both.
Govern — set guardrails
Add budgets, alerts and approval policies to prevent future waste before it happens, so the next iteration of the loop starts from a healthier baseline.
Repeat — continuous cycle
Because workloads change constantly, this loop runs monthly, weekly, or even in near-real time for mature teams — not once a year at budgeting season.
The FinOps Foundation formally describes this as three repeating phases: Inform (visibility), Optimise (take action) and Operate (continuously govern). It is a loop, not a one-time project — each turn of the loop should leave the organisation slightly cheaper and slightly more informed than the last one.
Advantages, Disadvantages & Trade-offs
Every engineering discipline is a trade-off. Cost optimisation done well pays for itself many times over; done badly it damages the very systems it was supposed to protect. Naming the trade-offs out loud is what keeps teams honest.
Advantages
- Directly increases company profit margins.
- Frees budget for innovation and new hiring.
- Improves engineering discipline and system design quality.
- Reduces environmental impact (fewer idle servers = less energy waste).
- Builds a culture of accountability and ownership.
Disadvantages / Risks
- Over-aggressive cost cutting can hurt performance or reliability.
- Reserved commitments reduce flexibility if plans change.
- Requires ongoing engineering time — it is never “finished”.
- Can create friction between engineering speed and cost discipline.
- Poorly tuned automation can shut down resources still in use.
7.1 Common Trade-offs
| Trade-off | Choosing cost savings | Choosing safety / performance |
|---|---|---|
| Reserved vs on-demand | Cheaper, but locked in for 1–3 years | Flexible, but pays a premium |
| Spot vs on-demand | Up to 90% cheaper | Guaranteed, uninterrupted capacity |
| Aggressive auto-scaling down | Lower idle cost | Risk of scaling too slowly under sudden spikes |
| Cold storage tiers | Much cheaper storage | Slower retrieval time |
Performance & Scalability
Cost and performance are often seen as opposites, but the best cost optimisation actually improves performance, because it forces teams to build efficient systems instead of masking inefficiency by throwing more hardware at a problem.
8.1 Techniques That Improve Both Cost and Performance
Horizontal Auto-scaling
Adding / removing small servers based on demand keeps latency low during spikes while cutting idle cost off-hours.
Caching
Serving repeated requests from fast memory (like Redis) instead of hitting the database every time reduces both cost and response time.
Efficient Algorithms
A faster algorithm needs less CPU time to do the same job — directly lowering compute cost.
Asynchronous Processing
Queueing non-urgent work (like sending emails) instead of doing it instantly reduces peak resource demand.
However, there is a real tension: aggressive scale-down policies can hurt performance if they remove capacity too eagerly right before a traffic spike. This is why good systems use predictive scaling (learning traffic patterns in advance) rather than purely reactive scaling (waiting until CPU usage crosses a threshold).
Setting auto-scaling to react only to average CPU usage can miss real user pain — a system might have low average CPU but high latency due to a slow downstream dependency. Combine multiple signals (latency, queue depth, error rate) — not cost signals alone — when deciding to scale.
High Availability & Reliability
A dangerous myth is that cost optimisation means “removing the safety net”. In reality, good cost optimisation protects reliability by removing wasteful redundancy while keeping necessary redundancy.
9.1 Balancing Savings With Reliability
- Spot instances for stateless work only. Use interruptible, cheap capacity for workloads that can restart cleanly (batch jobs, CI/CD builds) — never for your primary database.
- Right-sized redundancy. You may need 3 availability zones for a critical payment service, but a low-traffic internal tool might only need 1.
- Graceful degradation. Design systems to serve a simplified experience under cost-driven capacity limits, rather than crashing entirely.
- Cost-aware disaster recovery. A “warm standby” (partially running backup) can be far cheaper than a fully duplicated environment, while still enabling fast recovery.
Never apply cost cuts uniformly across a system. Classify workloads by criticality first (critical, important, best-effort), then apply far more aggressive cost optimisation to the least-critical tier. A single tier of optimisation applied to every service will always overshoot somewhere and undershoot somewhere else.
Security
Cost optimisation and security are more connected than people expect. Forgotten, unused resources are not just wasteful — they are also security risks, because nobody is patching or monitoring something nobody remembers exists.
Orphaned Resources = Attack Surface
An old, unpatched test server left running for cost reasons is also an easy target for attackers.
Least-Privilege Automation
Cost automation tools that can shut down or resize infrastructure need carefully scoped permissions to avoid accidental (or malicious) misuse.
Data Deletion Policies
Deleting old backups to save storage cost must follow compliance rules (e.g. some data must be retained for legal reasons even if unused).
Spend Anomalies as Breach Signals
A sudden spike in compute cost can be an early sign of cryptomining malware or a compromised account — cost monitoring is also a security signal.
Attackers who gain access to cloud credentials often spin up large numbers of GPU / CPU instances to mine cryptocurrency. Cost anomaly alerts are frequently the first sign an account has been compromised — treat unexplained cost spikes as a potential security incident, not just a billing nuisance.
Monitoring, Logging & Metrics
You cannot optimise what you cannot see. Monitoring is the foundation that makes every other technique possible, and getting the right metrics in front of the right people is often more valuable than any single automation.
11.1 Key Metrics to Track
| Metric | What it tells you |
|---|---|
| Cost per service / team | Who is spending what, enabling accountability |
| Utilisation (CPU, memory, disk) | Whether resources are appropriately sized |
| Idle time percentage | How much capacity sits unused |
| Cost per unit of business value (e.g. per API call, per user) | Whether efficiency improves as the business scales |
| Anomaly / spike alerts | Unexpected cost jumps that need investigation |
| Coverage of committed pricing | What % of usage is covered by discounts vs full price |
11.2 Tooling Landscape
Native Cloud Tools
AWS Cost Explorer, Azure Cost Management, GCP Billing Reports — built-in, free starting points that every team should turn on before buying anything else.
Kubernetes-focused
Kubecost, OpenCost — attribute cost per pod, namespace or team inside a cluster where the underlying nodes hide the true owners.
Multi-cloud Platforms
CloudHealth, Spot.io, Vantage, Cloudability — unify cost visibility across providers so a single dashboard covers AWS, Azure and GCP together.
Observability Integration
Combining cost data with Grafana / Datadog dashboards alongside performance metrics for a full picture — so cost and latency are debated in the same conversation, not in separate silos.
Deployment & Cloud
Different cloud providers offer different pricing levers. Understanding them lets you choose the right tool for the right workload — and stop paying full price for capacity you already know you will use.
AWS
Savings Plans, Reserved Instances, Spot Instances, Compute Optimizer, S3 Intelligent-Tiering.
Azure
Reserved VM Instances, Azure Hybrid Benefit, Spot VMs, Azure Advisor recommendations.
GCP
Committed Use Discounts, Preemptible / Spot VMs, sustained-use discounts (automatic), Recommender API.
Multi-cloud / Hybrid
Adds flexibility and avoids vendor lock-in, but multiplies the complexity of cost visibility and tooling — the extra freedom costs you engineering time to manage.
12.1 Infrastructure-as-Code & Cost Guardrails
Modern teams bake cost checks directly into their deployment pipelines using Infrastructure-as-Code (IaC) tools like Terraform. Before infrastructure is even created, automated policy checks (using tools like Infracost or OPA / Conftest) can estimate the monthly cost of a proposed change and flag it in a pull request — catching an oversized database instance before it is ever deployed, not after the bill arrives.
“Shift-left” means catching problems earlier in the process. Applied to cost, it means engineers see estimated costs while writing code and infrastructure definitions — not a month later in a finance report when it is too late to do anything but explain themselves.
Databases, Caching & Load Balancing
These three components are frequently among the most expensive parts of an infrastructure bill, and each has its own optimisation playbook. Getting them right is usually where the biggest, most defensible savings live.
13.1 Databases
- Rightsizing. Databases are often over-provisioned “just in case”, even though most workloads have predictable patterns.
- Read replicas vs bigger primary. Adding read replicas to handle read-heavy traffic is often cheaper than continuously growing a single giant instance.
- Storage lifecycle. Archiving old rows or partitioning by date lets you move cold data to cheaper storage.
- Serverless databases. Options like Aurora Serverless or DynamoDB on-demand scale to zero, avoiding cost during idle periods — ideal for spiky or unpredictable workloads.
13.2 Caching
Caching (storing frequently accessed data in fast memory, e.g. Redis or Memcached) reduces the number of expensive database queries. Fewer database queries mean the database can be smaller — a direct, compounding cost saving. A good analogy: keeping snacks in your desk drawer (cache) so you do not have to walk to the store (database) every time you are hungry.
13.3 Load Balancing
Load balancers distribute traffic across multiple servers. From a cost perspective, they are what makes horizontal auto-scaling possible — enabling you to run several small, cheap servers instead of one giant, expensive one, and to add or remove servers seamlessly as demand shifts.
APIs & Microservices
Breaking a large application into many small independent services (microservices) offers flexibility, but it introduces its own cost patterns worth understanding — some helpful, some easy to miss until the bill arrives.
Cost benefits of microservices
- Each service can be scaled and rightsized independently.
- Only the busy services need more resources, not the whole app.
- Teams can pick cost-efficient tech per service (e.g. serverless for spiky ones).
Cost risks of microservices
- More services = more baseline “always-on” overhead per service.
- Network calls between services add latency and sometimes data-transfer cost.
- Harder to get a unified cost picture across dozens / hundreds of services.
A useful concept here is the API call cost — every request between microservices, especially across regions, can carry a small data-transfer fee. At small scale this is negligible, but at billions of calls per month, an inefficient “chatty” architecture (many small calls instead of a few larger, batched ones) becomes a measurable cost driver.
For APIs with unpredictable, spiky traffic, serverless functions (like AWS Lambda or Google Cloud Functions) can be cheaper than always-on servers, because you pay per invocation rather than per hour — similar to paying per ride instead of owning a car you rarely drive.
Design Patterns & Anti-patterns
A handful of patterns keep showing up in well-run cost programmes because they solve recurring problems well. An equally short list of anti-patterns keeps showing up in expensive ones. Recognising both by name saves a great deal of money.
15.1 Helpful Patterns
Scale-to-Zero
Non-production environments (dev, staging) automatically shut down outside business hours.
Spot Fleet Diversification
Mixing several instance types for spot workloads reduces the chance all of them get reclaimed at once.
Cost-Aware Circuit Breaker
Systems that throttle or degrade gracefully instead of scaling infinitely when costs would spike beyond a safe budget.
Tiered Storage Lifecycle
Automated rules that move data from hot → warm → cold → archive storage as it ages.
15.2 Anti-patterns to Avoid
“Just in case” over-provisioning
Sizing every resource for an imagined worst case that rarely or never happens.
Set-and-forget resources
Creating a resource for a one-time task and never revisiting or deleting it.
Cost tunnel vision
Cutting costs so aggressively that reliability or user experience suffers, causing greater business harm than the savings.
No ownership tagging
Untagged resources that nobody feels responsible for cleaning up.
Best Practices & Common Mistakes
Nearly every serious cost problem in a mature company can be traced back to violating one of a small set of principles. Reading through this list before designing a system will save you far more money than reading it after your first surprise bill.
16.1 Best Practices
- Tag everything, consistently. Enforce tagging at resource-creation time, not as an afterthought.
- Set budgets and alerts. Get notified the moment spend trends outside expectations — do not wait for the monthly invoice.
- Automate the boring stuff. Auto-shutdown for dev / test environments should require no human action.
- Review regularly, not once. Schedule recurring cost reviews (e.g. monthly) as a standing team ritual.
- Balance commitment with flexibility. Reserve only your predictable baseline usage; keep variable demand on-demand or spot.
- Make cost visible to engineers. Show cost dashboards alongside performance dashboards so cost becomes part of everyday engineering thinking.
16.2 Common Mistakes
Traffic patterns, team structures and product usage constantly change. A rightsizing exercise done once, two years ago, is likely wildly out of date today.
Engineers make the decisions (instance types, architecture, scaling rules) that determine 90% of the bill. Excluding them from cost conversations guarantees waste.
A flat “reduce everything by 20%” mandate, applied without understanding which systems are critical, can quietly damage the most important parts of the business.
Real-World & Industry Examples
Almost every well-known engineering-driven company runs on some flavour of the practices in this guide. Here are a few of the most instructive examples, followed by the common lesson they all reinforce.
Blended spot & reserved fleets
Netflix pioneered large-scale use of spot / reserved instance blends and built internal tools to automatically balance cost, availability and performance across its massive AWS footprint — famously open-sourcing tools like Scryer for predictive auto-scaling.
“Cost per unit of work”
Internal Amazon teams use rigorous cost-per-unit-of-work metrics, pushing engineering teams to treat efficiency (cost per request, per customer) as a core engineering metric, not just a finance concern.
Cluster consolidation
Airbnb has publicly discussed consolidating infrastructure, improving utilisation of shared clusters and building internal cost-visibility tooling to help hundreds of engineering teams see their own footprint.
Cost-aware developer platform
Spotify invested in “cost-aware” internal developer platforms so that when engineers provision new services, sensible, cost-efficient defaults are baked in automatically.
Consolidating microservices
Uber has spoken publicly about consolidating from many small, inefficient services toward better-utilised, rightsized infrastructure as its microservices footprint grew into the thousands.
TCO-driven repatriation
Dropbox famously moved a large portion of its storage infrastructure from public cloud to its own custom-built data centres, dramatically cutting long-term storage costs at its specific massive scale — an example of TCO analysis favouring a non-cloud approach.
None of these companies treat cost optimisation as a one-off project. In every case, it is an ongoing engineering discipline supported by internal tooling, dashboards and cultural buy-in from engineers — not just a spreadsheet exercise run by finance once a year.
Frequently Asked Questions
A short set of the questions people ask most often about infrastructure cost optimisation when they first encounter it — useful in interviews as well as in real design reviews.
Is infrastructure cost optimisation only for large companies?
No. Even a small start-up can waste 30% of a small cloud bill. The dollar amounts are smaller, but the percentage waste — and the habits that create it — are strikingly similar at any scale.
Does cost optimisation always mean things get slower?
Not if done correctly. Good cost optimisation removes waste, not necessary capacity. Poorly done cost cutting — cutting blindly without understanding workload criticality — is what causes slowdowns.
What is the difference between cost optimisation and FinOps?
Cost optimisation is the set of techniques (rightsizing, reserved pricing, etc.). FinOps is the broader organisational culture and process that makes those techniques happen continuously, involving engineering, finance and leadership together.
Should I always use spot instances to save money?
Only for workloads that can tolerate interruption — batch jobs, CI pipelines, stateless workers. Never for stateful, latency-sensitive, or critical systems like your primary database.
How often should we review our cloud costs?
Automated anomaly alerts should run continuously; a manual, deeper review with engineering leads is commonly done monthly, with a broader strategic review (reservation planning, architecture changes) quarterly.
Can AI help with cost optimisation?
Increasingly yes — machine learning models can detect usage anomalies, forecast future spend and recommend rightsizing far faster and more precisely than manual review, though human judgment is still essential for risk decisions.
Summary & Key Takeaways
Infrastructure cost optimisation is the ongoing discipline of ensuring that computing resources — servers, storage, databases, networking — are sized, priced and managed in a way that matches actual business need, without sacrificing the reliability, performance or security the business depends on. It emerged as cloud computing made resources instantly available (and instantly forgettable), and it has since grown into a formal cross-team discipline known as FinOps.
The core insight running through every chapter above is that cost is not an accounting concern glued on at the end of a project. It is an engineering property of the system, decided by dozens of small daily choices — instance types, scaling rules, storage tiers, cache hit rates, retention policies, tags. Get those choices right, and the bill takes care of itself. Get them wrong, and no amount of finance-side scrutiny will ever fully catch up.
Key Takeaways
- Cost optimisation is a continuous cycle — measure, allocate, analyse, optimise, govern, repeat — not a one-time cleanup.
- Visibility (tagging + dashboards) must come before automation; you cannot fix what you cannot see.
- Techniques like rightsizing, reserved / spot pricing, auto-scaling and storage tiering each solve a different type of waste — use them together, not in isolation.
- Cost and reliability are not opposites — good cost optimisation protects necessary redundancy while eliminating wasteful redundancy.
- Every engineer, not just a dedicated “cost team”, influences the bill through everyday design and coding decisions.
- Industry leaders like Netflix, Amazon and Spotify treat this as core engineering practice, backed by internal tooling and culture — not an afterthought.

