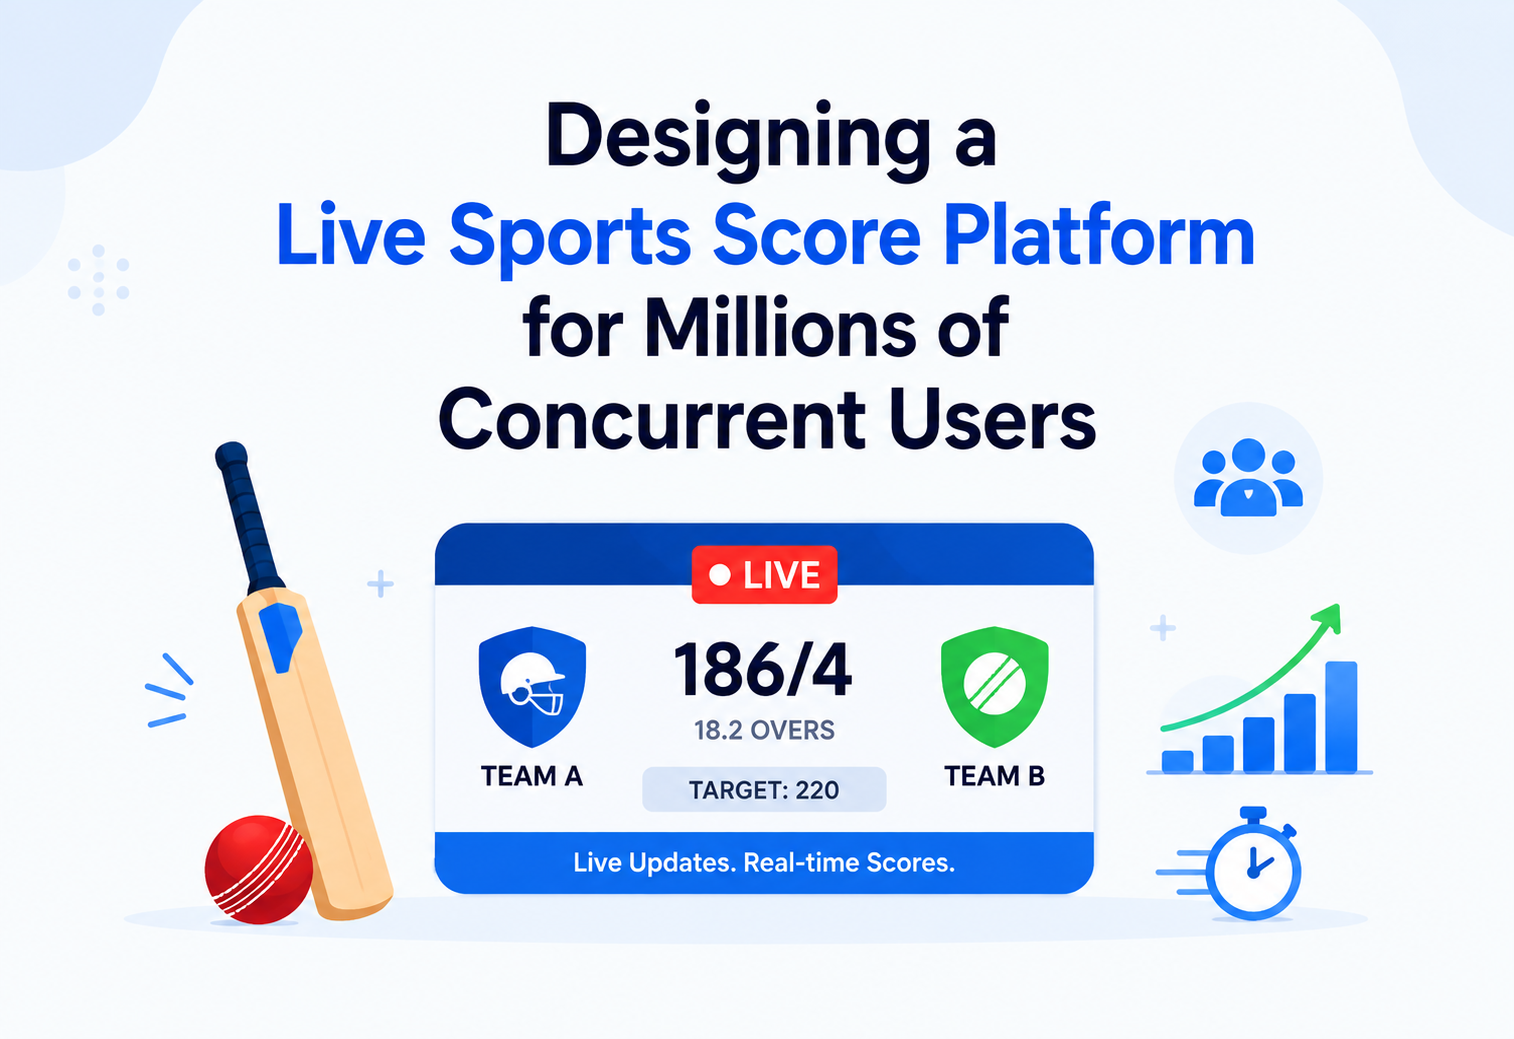
Designing a Live Sports Score Platform for Millions of Concurrent Users
A complete, ground-up walkthrough of how to build a real-time score and stats system that can serve tens of millions of fans watching the same cricket final, football derby, or NBA playoff game at the exact same second — covering architecture, data flow, databases, caching, scaling, reliability, and the trade-offs behind every decision.
Introduction and History
Millions of people, one final over, one whistle, one instant — every phone in the world must show the same number within a second or two of the real-world event.
Picture the last over of a T20 World Cup final, or the final two minutes of a Super Bowl. Tens of millions of people, spread across every timezone, are staring at their phones at the exact same moment, refreshing the same scoreboard. One team scores. One wicket falls. One touchdown happens. And within a second or two, every single one of those phones must show the same number, the same event, the same story — without the app crashing, without the page freezing, and without draining anyone’s battery or data plan.
That is the problem a live sports score platform exists to solve. It is one of the most demanding real-time systems in the industry, because it combines three hard problems at once: massive concurrency (millions of readers), extremely low latency (seconds matter, sometimes fractions of a second), and unpredictable, spiky traffic (a quiet Tuesday afternoon can turn into ten million active users the moment a final whistle is thirty minutes away).
1.1 A Short History of How Live Scores Got Here
Teletext, Radio, and the Meta-Refresh Era
Live scores lived on teletext and radio commentary. The first web-based scoreboards were simple HTML pages that refreshed every 30–60 seconds using a browser meta-refresh tag or a JavaScript timer that called a server endpoint. This is called polling, and it worked fine when only a few thousand people were watching at once.
The Smartphone Boom and the Cracks in Polling
As smartphones and mobile data became common, sports apps exploded in popularity. Polling every device every few seconds started to buckle the moment audiences crossed a few million concurrent users, because every single poll request is a full round trip to a server, and the server has to process it even if nothing changed.
The Push Era — WebSockets and SSE
Companies moved toward push-based architectures — WebSockets (RFC 6455, standardised in 2011), Server-Sent Events (SSE), and mobile push notifications — where the server tells the client something changed, instead of the client repeatedly asking. HTTP/2 multiplexing and cheaper cloud infrastructure made this practical at scale.
Distributed, Event-Driven, Multi-Region Platforms
Today’s live sports platforms (the kind built by major broadcasters, sports data companies, and streaming platforms) are distributed, event-driven systems spanning multiple data centres and CDNs, built to absorb sudden 50x–100x traffic spikes within minutes and to recover from partial outages without most users ever noticing.
Think of a stadium announcer versus a rumour spreading through the crowd. In the old “polling” model, every single fan has to keep tapping the shoulder of the person next to them and asking “what’s the score now? what’s the score now?” — millions of taps, most of them wasted because nothing changed. In the modern “push” model, there is one stadium announcer with a microphone connected to speakers everywhere in the stadium. The moment something happens, the announcer says it once, and everyone hears it within a second, without anyone having to ask.
- “Why can’t we just use simple polling for a live score app?” — Be ready to explain the server load maths: if 10 million clients poll every 5 seconds, that is 2 million requests per second even when nothing has changed.
- “What changed in the industry that made push-based real-time systems more practical?” — Mention WebSocket standardisation (RFC 6455, 2011), HTTP/2 multiplexing, and cheaper, more elastic cloud infrastructure.
1.2 Why This Topic Keeps Showing Up in System Design Interviews
Interviewers love this problem because it is not really about sports at all — it is a stand-in for any “one event, millions of watchers” system: stock ticker apps, election result trackers, live auction platforms, multiplayer game leaderboards, and breaking-news alert systems. If you understand how to design this, you understand a whole category of real-time fan-out systems. That is exactly why we will spend as much time on the reasoning behind each decision as on the decision itself.
A simple version of this problem is a classroom quiz app where the teacher clicks “reveal answer” and every student’s tablet should update at the same time. With five students, the teacher’s laptop could just message each tablet directly. With five million students across the country, that direct-messaging approach falls apart — and the exact same reasoning that fixes the classroom-quiz-at-scale problem is what powers a live sports platform.
Large broadcasters and sports-data companies operating during marquee tournaments (World Cups, the Olympics, major league playoffs) publicly discuss handling tens of millions of concurrent live-score requests during peak minutes — traffic that can be over a hundred times their typical weekday load. This is precisely the scenario this design targets.
Problem and Motivation
Before drawing a single box on an architecture diagram, we need brutal clarity on the actual problem — and on the numbers that make it hard.
A system design interview — and a real production system — lives or dies on this clarity.
2.1 Functional Requirements
- Show the current score of a live match (cricket, football, basketball, etc.) updated within 1–3 seconds of the real-world event.
- Show a ball-by-ball or play-by-play commentary feed.
- Show live statistics: possession percentage, run rate, player stats, win probability.
- Support millions of users watching the same match concurrently.
- Work across web, iOS, and Android clients.
- Degrade gracefully — if real-time push fails, fall back to a slightly-delayed but still-correct score.
2.2 Non-Functional Requirements — Where the Real Difficulty Lives
| Requirement | Target | Why It’s Hard |
|---|---|---|
| Concurrency | 5–50 million concurrent viewers on a single match | Traffic is not evenly spread across matches — one final can carry 80% of total load. |
| Latency | Event-to-client under 2–3 seconds | Fans compare their app to the TV broadcast and to Twitter; being “behind” feels broken even if data is technically correct. |
| Burstiness | 50x–100x traffic spike within 10–20 minutes before kickoff | Auto-scaling has to be pre-warmed; reactive scaling alone is too slow. |
| Consistency | Every user must see the same score at (roughly) the same time | A user with a stale score screenshots it and shares it — visible inconsistency destroys trust fast. |
| Availability | 99.95%+ during live windows | Downtime during a World Cup final is a headline news event, not just an SLA breach. |
| Cost efficiency | Elastic — pay for the spike, not for idle capacity 350 days a year | Most days have modest traffic; provisioning for peak year-round is wasteful. |
Most systems can trade off either consistency or latency and be fine. A live score platform cannot — it needs near-real-time delivery and everyone-sees-the-same-truth consistency, at a scale where a single naive database write pattern (every event triggering a write fan-out to millions of open connections) would collapse instantly.
- “What are your assumed numbers — how many concurrent users, how many events per second per match?” — always state and write down assumptions before designing (a good default: 10M concurrent viewers, ~1 scoring event every few seconds in cricket, sub-second in fast sports like basketball).
- “Which requirement would you relax first under extreme load — consistency, latency, or availability?” — a strong answer: momentarily relax strict global ordering guarantees before ever sacrificing availability, and use monotonic per-client ordering to avoid the score going “backwards.”
2.3 Worked Capacity Estimation — Why Doing the Maths Matters
Before choosing any technology, it helps enormously to put real numbers on the table. Let’s estimate the load for one marquee match with 10 million concurrent viewers:
| Quantity | Naive Polling (every 3s) | Push-Based Delivery |
|---|---|---|
| Requests/second at peak | ~3.3 million/sec | Near zero steady-state; bursts only on real events |
| Bandwidth for a 2KB payload | ~6.6 GB/sec sustained | Only sent when state actually changes, and only as a small delta |
| Server-side CPU work | Millions of redundant “no change” checks per second | Work done once per real event, fanned out cheaply via Pub/Sub |
This single comparison is usually enough to convince any interviewer — and any engineering team — that a push-based, event-driven architecture is not a “nice to have” for this problem, it is the only approach that survives contact with real-world scale.
Imagine a stadium of 80,000 people, and imagine if every single fan had to individually walk up to the scoreboard operator every 3 seconds to ask “what’s the score?” The operator would do nothing else all match. Instead, the scoreboard itself updates once, and everyone simply looks up. Push-based delivery is that same shared scoreboard, generalised to a network of millions of screens instead of one physical board.
2.4 Estimating Storage Requirements
It’s also worth sizing the durable storage side of the problem, since interviewers often probe this too. A single football match might generate a few hundred discrete events (goals, cards, substitutions, key plays); a cricket match can generate several thousand ball-by-ball events. If each event, with metadata, averages around 500 bytes stored:
events_per_match  ≈ 3,000 (cricket, ball-by-ball)
storage_per_match ≈ 3,000 * 500 bytes ≈ 1.5 MB
matches_per_day (global platform, all sports) ≈ 500
daily_storage     ≈ 500 * 1.5 MB ≈ 750 MB/day
annual_storage    ≈ 750 MB * 365 ≈ ~270 GB/year (raw events only)
This number looks almost trivially small compared to the bandwidth and connection numbers above — and that asymmetry itself is an important insight: this system’s hard constraint is concurrency and latency, not storage volume. Recognising which resource is actually the bottleneck is one of the most valuable skills in system design, because it tells you where to spend your engineering effort and where not to over-engineer.
2.5 Defining Out-of-Scope Items Clearly
Just as important as defining requirements is stating what is deliberately out of scope for this design, to keep the system focused: detailed video streaming of the match broadcast itself (a separate, video-specific system), in-app betting/odds calculation engines, and social features like comments or fan chat rooms. These are commonly adjacent systems that integrate with a live score platform but are not the live score platform itself.
Architecture and Components
The full end-to-end architecture — every box in this diagram names the actual component it represents, so you can trace exactly how a single request and a single live event move through the system.
3.1 Component-by-Component Breakdown
CDN Edge Node
Caches static assets (app shell, images, logos) and short-TTL cacheable API responses (e.g., pre-match squad lists) close to the user, cutting latency and origin load.
DNS + GeoDNS Routing
Routes a user’s request to the nearest healthy region based on geography, so an Indian user hits a Mumbai or Singapore region, not one in Virginia.
Global Load Balancer
A Layer 7 load balancer that distributes traffic across regions, doing health checks and failing over an entire region if it becomes unhealthy.
Regional Load Balancer
Distributes traffic across many instances of the API Gateway within one region, using algorithms like round robin, least connections, or weighted routing.
API Gateway
The single front door for all client requests: handles authentication, rate limiting, request routing to the correct microservice, and request/response transformation.
Match Score Service
Owns the canonical current score/state of a match. Every score update is written here first before being broadcast anywhere else.
Stats Aggregation Service
Computes derived statistics (run rate, possession %, win probability) from raw events, often using a stream processor.
Commentary Service
Manages ball-by-ball or play-by-play text commentary, often authored by human editors alongside automated event descriptions.
WebSocket Gateway
Maintains millions of persistent, bidirectional connections and pushes score updates to clients the instant they are published, without the client asking.
SSE Gateway (fallback)
Server-Sent Events channel used as a fallback for clients/networks where WebSockets are blocked (some corporate proxies, older TVs).
Message Broker (Kafka)
Durable, ordered event log that decouples the ingestion pipeline from every downstream consumer (score service, stats service, notification service).
Redis Cluster
In-memory cache holding “the current score right now” for instant reads, and used as a Pub/Sub bus to fan out updates to gateway nodes.
Primary DB + Read Replicas
PostgreSQL (or similar) stores the durable, authoritative history of every match event; read replicas absorb the heavy read traffic from services and APIs.
Time-Series DB
Optimised for storing and querying stats-over-time (e.g., run rate progression) efficiently for graphs and historical analysis.
Push Notification Service
Sends OS-level push notifications for major events (goals, wickets, match end) to users who don’t have the app open.
Ingestion Service
Adapts raw data from the external source (official data feed, stadium sensors, on-ground scorers) into a normalised internal event format.
- “Why do you need both a global and a regional load balancer?” — Global handles cross-region failover and geo-routing; regional handles fine-grained load distribution among many gateway instances within a data centre.
- “Why introduce a message broker like Kafka instead of services calling each other directly?” — Decoupling: the ingestion pipeline shouldn’t need to know or care how many downstream consumers exist, and Kafka gives durability/replay if a consumer crashes.
- “Why is there both Redis and a durable database?” — Redis serves the hot path (instant reads of “current state”) at very low latency; the database is the source of truth and supports complex queries, audits, and recovery.
3.2 Understanding the API Gateway — What, Why, Where
What it is: The API Gateway is a single, well-guarded front door that every client request must pass through before reaching any internal service. Why it exists: Without it, every microservice would need to independently implement authentication, rate limiting, and request logging — duplicating effort and creating inconsistent security. Where it’s used: Virtually every modern large-scale web platform (banking apps, e-commerce checkouts, social feeds) uses this pattern, not just sports platforms.
Think of an office building’s single reception desk. Visitors don’t wander the halls looking for the department they need — they check in once at reception, get a badge, and are then directed to the right floor. The API Gateway is that reception desk for every request entering the system.
A student project with three tiny services (login, profile, and posts) might let the browser call each service’s URL directly. At sports-platform scale, the API Gateway additionally shields internal services from being called directly, enforces per-user rate limits so no single account can flood the system, and can even reject malformed requests before they consume any backend resources.
3.3 Understanding the Load Balancer — What, Why, Where
What it is: A component that distributes incoming traffic across multiple servers so no single machine is overwhelmed. Why it exists: A single server, no matter how powerful, has a hard ceiling on how many requests or connections it can handle; load balancers let a system scale horizontally by adding more machines behind them. Where it’s used: Every layer of this design that has more than one instance of a service — from the very first global entry point down to individual microservices — sits behind some form of load balancer.
A supermarket with ten checkout counters and one queue manager directing customers to whichever counter is free next, instead of everyone crowding one cashier. A small blog with two web servers behind a load balancer for redundancy is the software equivalent. At production scale, this platform’s regional load balancer spreads millions of simultaneous connections across dozens or hundreds of WebSocket Gateway instances, continuously checking each instance’s health and connection count.
3.4 Understanding the Message Broker (Kafka) — What, Why, Where
What it is: A durable, ordered log of events that producers write to and multiple independent consumers read from, each at their own pace. Why it exists: Without it, the ingestion pipeline would need to know about — and directly call — every single downstream service that cares about a new event, tightly coupling everything together and making the system fragile to any one consumer being slow or down. Where it’s used: Between the Ingestion Service and every internal consumer (Match Score Service, Stats Aggregation Service, Notification Service) in this design.
A notice board outside a village post office. The postmaster pins up one notice; anyone in the village can walk by and read it whenever they like, at their own pace, without the postmaster needing to personally visit every house. A to-do list app might use a simple queue for background email sends; at production scale, Kafka here holds every match event durably for a configurable retention window, so if the Stats Aggregation Service crashes and restarts, it can replay missed events instead of silently losing data.
3.5 Understanding the Redis Cache and Pub/Sub Layer — What, Why, Where
What it is: An in-memory data store used both to cache the “current score right now” for instant reads, and as a lightweight publish/subscribe messaging bus. Why it exists: Reading directly from a disk-backed database for every single client request would be far too slow and would overload the database at this scale; keeping the hottest, most-requested piece of data (the live score) in memory makes reads extremely fast. Where it’s used: Sits between the Match Score Service (which writes updates) and the WebSocket/SSE Gateways (which need to know instantly when something changes).
A whiteboard at the front of a newsroom showing “breaking news right now,” which every reporter glances at instead of calling the archive department for the latest headline every time. In production, a single Redis Cluster keyed by matchId can serve the current score of a World Cup final to gateway nodes handling tens of millions of connections, all reading the same tiny, frequently-updated value.
Internal Working of the System
Follow one score event, end to end — from a scorer’s tap on the ground all the way to ten million phones lighting up.
Follow a single event — say, “India scored a boundary” — end to end through this system:
- Event source: An on-ground scorer, an official data-feed provider, or a stadium sensor produces the raw event:
{ matchId, eventType: FOUR, batsman, over: 18.4, time: T }. - Ingestion Service receives the raw event over HTTP or a data-feed protocol, validates it against an internal schema, and publishes it to the Kafka topic
match-events, keyed bymatchIdso all events for one match land on the same partition and preserve order. - Kafka durably stores the event and hands it to multiple consumers in parallel: the Match Score Service, the Stats Aggregation Service, and the Notification Service.
- Match Score Service updates the durable database (Postgres) with the new event and updates the current-state row for that match:
current_score = 156/3 (18.4 overs). This is a small, fast write. - Match Score Service then writes the updated current state into Redis under key
match:{id}:state, andPUBLISHes a small message on Redis Pub/Sub channelmatch:{id}:updates. - Every WebSocket Gateway node holding subscribers for that match is subscribed to that Redis channel and receives the update within milliseconds.
- Each gateway node serialises the update once and pushes it to every client currently subscribed to that match — potentially tens of thousands or hundreds of thousands per node.
- Notification Service, on major events (goals, wickets, match end), sends OS-level push notifications via APNs/FCM to users who have subscribed to alerts but don’t currently have the app open.
- Stats Aggregation Service, meanwhile, uses a stream processor (e.g., Kafka Streams / Flink) to compute derived numbers — run rate, projected total — and writes them to a Redis key that the same gateway broadcasts alongside score updates.
4.1 Publish/Subscribe: The Core Pattern That Makes Fan-Out Cheap
The whole system revolves around Publish/Subscribe: one producer publishes an event to a channel, and many independent subscribers receive it. Kafka is the durable, ordered log for the entire pipeline (great for replay, recovery, and downstream services joining later). Redis Pub/Sub is the fast, in-memory, ephemeral fan-out layer between the score service and the many gateway nodes, chosen for speed rather than durability.
Pub/Sub is like an FM radio broadcast. The station transmits once, and any number of tuned-in radios receive it simultaneously. The station doesn’t care how many radios there are; it doesn’t call each one. Adding a new listener costs nothing at the broadcast side. That is exactly why this pattern scales to millions of concurrent subscribers on the read side without becoming exponentially more expensive to serve.
4.2 The Score Event Schema
Every event travelling through the system follows a well-defined schema so producers and consumers can be developed independently without ambiguity:
{
  "eventId": "evt_20260315_1846_00042",
  "matchId": "match_2026_wc_final",
  "sport": "cricket",
  "eventType": "FOUR",
  "sequenceNumber": 42,
  "timestamp": "2026-03-15T18:46:12.145Z",
  "payload": {
    "batsman": "player_kohli",
    "bowler": "player_starc",
    "over": 18.4,
    "runs": 4
  },
  "producerVersion": "ingestion-v3.2"
}
Two fields are worth calling out. eventId is a globally unique identifier used for deduplication if the same event happens to be delivered twice. sequenceNumber is a monotonically increasing number per match, used by every downstream consumer — and even the client — to detect out-of-order or missing events.
 You may likeDesigning a Photo-Sharing System That Serves Billions of Images in Under 100ms, Globally
4.3 The Ingestion Producer — Real Code
Here is a realistic Kafka producer that publishes score events, showing the key production concerns: keying by matchId for ordering, acknowledgement level for durability, and idempotent producer setting to avoid double-writes on retry:
public class ScoreEventPublisher {
    private final KafkaProducer<String, ScoreEvent> producer;

    public ScoreEventPublisher(Properties props) {
        // Durability + no duplicates on retry, at the cost of a tiny bit of throughput.
        props.put("acks", "all");
        props.put("enable.idempotence", true);
        props.put("max.in.flight.requests.per.connection", 5);
        this.producer = new KafkaProducer<>(props);
    }

    public void publish(ScoreEvent event) {
        // Keying by matchId sends all events for the same match to the same partition,
        // which preserves per-match ordering even under high throughput.
        ProducerRecord<String, ScoreEvent> record =
            new ProducerRecord<>("match-events", event.getMatchId(), event);

        producer.send(record, (metadata, error) -> {
            if (error != null) {
                log.error("Failed to publish event {}", event.getEventId(), error);
            }
        });
    }
}
4.4 The WebSocket Gateway — Handling Millions of Live Connections
This is a simplified sketch of what a WebSocket Gateway node looks like, showing the two critical pieces: mapping matchId to the set of connected sessions currently watching that match, and pushing an update out to all of them the moment Redis notifies the node:
public class MatchWebSocketHandler extends TextWebSocketHandler {

    // matchId -> set of currently connected client sessions watching that match
    private final Map<String, Set<WebSocketSession>> matchSubscribers = new ConcurrentHashMap<>();

    @Override
    public void handleTextMessage(WebSocketSession session, TextMessage message) {
        // Client sends { "action": "subscribe", "matchId": "..." }
        SubscribeRequest req = parse(message.getPayload());
        matchSubscribers
            .computeIfAbsent(req.getMatchId(), k -> ConcurrentHashMap.newKeySet())
            .add(session);
    }

    // Called by the Redis Pub/Sub listener when a new event arrives for a match.
    public void broadcast(String matchId, String payload) {
        Set<WebSocketSession> subs = matchSubscribers.get(matchId);
        if (subs == null) return;
        TextMessage msg = new TextMessage(payload);
        for (WebSocketSession s : subs) {
            if (s.isOpen()) {
                try { s.sendMessage(msg); }
                catch (IOException e) { /* let session cleanup handle it */ }
            }
        }
    }
}- “How does the same event end up on the right subset of clients out of millions of connected users?” — The gateway maintains an in-memory subscription map from
matchIdto the set of sessions watching that match; the Redis Pub/Sub message for that match reaches the gateway node, which then looks up the set and pushes to only those sessions. - “What happens if a WebSocket Gateway node crashes with a million connections open?” — Clients detect disconnect and reconnect (with backoff plus jitter to avoid a thundering herd), the load balancer routes them to a healthy node, and each new node subscribes to the relevant Redis channels on demand.
4.5 The Stream Processor — Turning Raw Events into Live Insights
The Stats Aggregation Service runs as a stream-processing job (Kafka Streams, Apache Flink, or similar). It consumes the same match-events topic and continuously computes derived numbers — run rate, projected total, current partnership — without touching the primary database. Here’s a simplified consumer showing the shape of that work:
@KafkaListener(topics = "match-events", groupId = "stats-service")
public void consume(ScoreEvent event) {
    MatchStats current = stateStore.get(event.getMatchId());
    MatchStats updated = current.apply(event);
    stateStore.put(event.getMatchId(), updated);

    // Publish only the delta the client actually needs to render.
    StatsDelta delta = current.diff(updated);
    redisTemplate.convertAndSend(
        "match:" + event.getMatchId() + ":stats", delta
    );
}
4.6 Idempotency — Why It Matters and How It’s Enforced
In a distributed system, events will occasionally be delivered more than once — a network retry, a broker replay after a consumer crash, a producer that didn’t receive an ack and re-sends. Without a guard against duplicates, the Match Score Service could count a single boundary twice as eight runs. The fix is to make every write idempotent: the same event applied twice produces the same result as applying it once. This is done by storing the eventId alongside the current state and rejecting any event whose ID has already been processed, which is a small, cheap check per event compared to the cost of getting the score wrong on live TV.
Idempotency is like pressing a floor button in an elevator. Pressing button 5 once lights it up; pressing it four more times doesn’t send the elevator to the fifth floor five times over. The system remembers the button is already lit and treats the extra presses as no-ops. That is precisely how idempotent event processing behaves at the software level.
4.7 What Happens on the Client Side
The client-side story is worth pausing on. The client isn’t a passive receiver — it plays an active role in the reliability story:
class LiveScoreClient {
  constructor(matchId) {
    this.matchId = matchId;
    this.lastSeq = 0;
    this.connect();
  }
  connect() {
    this.ws = new WebSocket("wss://api.example.com/live");
    this.ws.onopen = () => this.ws.send(JSON.stringify({
      action: "subscribe", matchId: this.matchId, lastSeq: this.lastSeq
    }));
    this.ws.onmessage = (e) => {
      const evt = JSON.parse(e.data);
      // Guard against out-of-order or duplicate deliveries.
      if (evt.sequenceNumber <= this.lastSeq) return;
      this.lastSeq = evt.sequenceNumber;
      this.render(evt);
    };
    this.ws.onclose = () => this.reconnectWithBackoff();
  }
  reconnectWithBackoff() {
    const wait = Math.min(30, Math.pow(2, this.attempts++)) * 1000
                 + Math.random() * 1000; // jitter
    setTimeout(() => this.connect(), wait);
  }
}
Three ideas are baked in on the client: sequence-number guards so the score never appears to jump backwards, tell the server what we last saw on reconnect so the server can resend anything missed, and exponential backoff with jitter so a million clients that disconnect together do not all reconnect at the exact same millisecond.
4.8 Testing Strategy for the Internal Path
- Unit tests for the event schema, sequence-number logic, and idempotent apply function — because getting the small logic right is what protects the score from ever going backwards on any user’s screen.
- Integration tests with an embedded Kafka broker (Testcontainers) to prove that a burst of duplicate events still results in a single, correct update to the current state.
- Load tests that hold millions of WebSocket connections simultaneously and measure the p99 latency from event publish to client receipt — this is the single number the whole platform is judged on.
Data Flow and Lifecycle
Zooming in on the exact millisecond-by-millisecond path a single event takes, and the state a match transitions through over its lifetime.
5.1 Snapshot + Delta — The Client Connection Pattern
When a client first connects, the gateway returns a full snapshot (“the current score is 156/3, over 18.4, run rate 8.44”) via a single REST call, then starts streaming small delta updates over WebSocket. This is important: sending the full state to millions of clients on every tiny event would be enormously wasteful.
You will meet this exact pattern again in video streaming (keyframes + inter-frames), collaborative editing (initial doc + operational transforms), and multiplayer games (world state + tick-diffs). Recognising it here means you already understand a family of solutions across many domains.
- “What’s the difference between at-most-once, at-least-once, and exactly-once delivery, and which does this system need?” — For live scores, at-least-once with idempotency handling on the consumer side gives effectively exactly-once semantics from the client’s perspective, which is what you want — strict exactly-once at the broker layer is much harder and rarely worth it.
5.2 Match Lifecycle States — Not All Time Windows Behave the Same
A match itself flows through distinct states, and the system’s behaviour is subtly different in each. Understanding this is what separates a naive implementation from a production-grade one:
SCHEDULED: Metadata only (teams, venue, kickoff time); light traffic. PRE_MATCH: Pre-warming kicks in — scale gateway pool, warm caches, freeze deployments. LIVE: Peak fan-out; every degradation ladder and circuit breaker is armed. PAUSED: A special sub-state (rain break, halftime, injury delay) — the platform stays fully warm but the update rate temporarily drops, which itself is not a signal of a bug. COMPLETED: Final score cached with a long TTL; commentary and highlights become the primary content. ARCHIVED: Data moves to cheaper cold storage; only occasional historical queries remain.
Without an explicit PAUSED state, a monitoring system watching “event rate per match” would page the on-call engineer during every rain break, treating a legitimate pause as an ingestion outage. Modelling PAUSED explicitly turns a source of false pages into a first-class, easily-visualised piece of information for the operations team.
5.3 Consistency Model in Practice
The Match Score Service treats the primary database as the source of truth (strong consistency for the write path), while the read path is eventually consistent through the Redis cache. The lag is typically well under a second, and the client’s sequence-number check ensures it never displays a stale event after already having displayed a newer one. This is the classic and correct trade-off for a system where availability and low read latency matter more than global strict linearizability across every reader on the planet.
Think of a radio and a TV broadcasting the same match. The radio commentary may be one or two seconds ahead of the TV video feed, but neither is “wrong” — each is internally consistent (the announcer never contradicts himself), and both eventually converge on the same reality of what happened on the pitch. Eventual consistency, done well, feels exactly like this to the end user.
Databases, Caching & Load Balancing
Which store owns which data, why the cache exists at multiple layers, and how load is spread across servers to keep every layer honest.
6.1 The Data Storage Layer
| Data | Store | Why |
|---|---|---|
| Match events history (durable, ordered) | PostgreSQL (primary) + Read Replicas | Strong consistency, ACID guarantees, mature ecosystem, excellent for the “source of truth.” |
| Current match state (hot, in-memory) | Redis Cluster | Sub-millisecond reads, ideal for “latest score right now” served to millions of concurrent readers. |
| Time-series stats (run rate over time) | Time-Series DB (e.g., InfluxDB, TimescaleDB) | Optimised for time-bucketed queries and downsampling, cheaper than a general-purpose DB for this shape. |
| User profiles & preferences | PostgreSQL (separate DB from match data) | Separation of concerns — independent scaling and independent security posture. |
| Highlights, images, videos | Object Storage (S3-like) + CDN | Large binary blobs don’t belong in a database; object storage plus CDN is cheaper and faster to serve. |
6.2 The Caching Strategy (Multiple Layers)
CDN Cache
Static assets (logos, images, JS bundles) and short-TTL cacheable API responses (pre-match squad lists, team logos) live at the CDN edge, close to users.
Application Cache (Redis)
“Current state” per match, keyed by matchId, refreshed on every event. Serves the read path for both APIs and WebSocket initial-snapshot fetches.
Client-side Cache
The mobile/web client caches the last-known score with its sequence number, so on brief disconnects it can display stale-but-correct data instead of a blank screen.
Hot-key Protection
The final over of a World Cup final is a “hot key.” The design handles this by replicating that key across multiple Redis shards or fronting it with a small local in-process cache in each gateway node.
6.3 Load Balancing Strategy
- Global (GeoDNS / Anycast): Route users to the nearest healthy region.
- Regional (L7 LB, e.g., NGINX / Envoy / cloud LB): Distribute HTTP and WebSocket traffic across many API Gateway and WebSocket Gateway instances using algorithms like least connections (great for long-lived WebSocket connections).
- Sticky sessions for WebSockets: Not by IP hash (that’s brittle), but by connection ID / token, so a reconnecting client can be routed to a warm node with existing subscription state where possible.
- “How do you invalidate the cache when a match ends?” — The Match Score Service transitions the match into COMPLETED state, writes the final snapshot with a long TTL (or infinite), and the write-through pattern means subsequent reads return the correct final state.
- “What happens if Redis goes down mid-match?” — Gateways fall back to reading from the primary DB or a read replica (slower path, degraded but still working); the client experience is a slight increase in delivery latency, not a total outage.
6.4 Sharding and Partitioning
Sharding refers to splitting a single logical data store across multiple physical machines so that no single machine holds all the data or handles all the traffic. In this design, Redis and Kafka are both sharded by matchId: this keeps all data for a single match (state, cache entries, event stream) on one shard, which preserves per-match ordering, while spreading the platform’s overall load across dozens or hundreds of shards. The database side uses a similar strategy, with match-events partitioned by match date so that queries for “what happened during the 2026 final” hit exactly one partition rather than scanning years of history.
6.5 Replication for Read Scaling and Durability
Every durable store in this design uses replication: PostgreSQL primary-replica for read scaling and failover, Kafka broker replicas (configurable via replication factor) so no single node failure loses events, and Redis replicas for both reads and failover. Replication trades a small amount of storage cost for a huge amount of resilience — a single machine failure becomes a routine, self-healing event instead of an incident.
Replication is like a public library keeping multiple identical copies of a bestselling book. If one copy is lost or being read, other patrons can still borrow the same book from a different shelf without waiting. Losing one physical copy doesn’t take “the book” out of circulation.
6.6 Cache Invalidation — The “Hardest Problem in Computer Science”
Cache invalidation is famously one of the hardest problems in software engineering. In this design, it is handled deliberately in two ways: write-through from the Match Score Service, meaning every event that updates the database also updates the cache in the same code path, so the two never drift more than a few milliseconds apart; and TTL as a safety net, so even if a bug causes the write path to skip a cache update, the cache entry naturally expires and gets refreshed from the source of truth within seconds. The write-through discipline is the primary line of defence; the TTL is the backup, not the main tool.
6.7 Time-Series Data Deserves Its Own Store
Data like “run rate at every over of every match this season” is time-series data: naturally ordered by timestamp, mostly written once and read many times, and best served by downsampling old data (e.g., keeping one point per hour for last year, but every point for the last 24 hours). A general-purpose relational database can technically store this, but a purpose-built time-series database compresses it far better and answers time-bucketed queries much faster, at a fraction of the cost per gigabyte at scale.

Storing time-series stats in a normal SQL database is like keeping a decade of heart-rate readings in an Excel spreadsheet — it technically works, but it’s slow to query, huge to store, and there are purpose-built tools (a fitness watch’s dedicated storage) that were designed exactly for this shape of data and handle it far more gracefully.
6.8 Object Storage and Full-Text Search
Two supporting stores round out the data layer. Object storage (S3-compatible) holds large binary content — match highlight clips, team crests, player photos — and is fronted by the CDN so downloads are served from edge locations, not from origin. Full-text search (Elasticsearch or similar) powers user-facing search across matches, players, and commentary text, decoupled from the primary database so heavy search queries never compete with the score-write path.
6.9 Consistency Model per Data Type
Different data types get different consistency guarantees in this system, and that is deliberate rather than accidental: match events use strong consistency (a scored goal must never be lost or double-counted); live current state uses read-your-writes consistency for the writing service and eventual consistency for read replicas (a lag of a second or two is fine for a stats widget); and historical highlights and archived match data use very loose consistency because those change rarely, and stale-by-minutes is completely acceptable.
APIs and Microservices Design
Every service in this design is deliberately small and focused, exposing a clean, well-versioned API to the outside world and a well-defined event contract to the inside world.
7.1 Core Services and Their Responsibilities
| Service | Owns | Exposes |
|---|---|---|
| Match Score Service | Current score, event history, match state machine | REST: GET /matches/{id}, GET /matches/{id}/events |
| Stats Aggregation Service | Run rate, possession, projected totals, win probability | REST: GET /matches/{id}/stats |
| Commentary Service | Text commentary, key moments feed | REST: GET /matches/{id}/commentary |
| Notification Service | User subscriptions, push delivery via APNs/FCM | REST: POST /notifications/subscribe |
| User Profile Service | Followed teams, notification preferences | REST: GET /users/{id}/preferences |
| WebSocket / SSE Gateway | Real-time push delivery, subscription management | WebSocket: wss://api.example.com/live |
7.2 A Sample REST + WebSocket Exchange
GET /matches/match_2026_wc_final HTTP/1.1
Authorization: Bearer <token>

200 OK
{
  "matchId": "match_2026_wc_final",
  "status": "LIVE",
  "score": { "IND": "156/3 (18.4 ov)", "AUS": "Yet to bat" },
  "lastEventSeq": 42
}

// Then client opens: wss://api.example.com/live
>> { "action": "subscribe", "matchId": "match_2026_wc_final", "lastSeq": 42 }
<< { "matchId": "match_2026_wc_final", "seq": 43, "delta": { "runs": 6, "over": 18.5, "batsman": "player_kohli", "eventType": "SIX" } }
7.3 REST vs. WebSocket — When to Use Each
REST is used for the “pull” parts: initial page load, historical queries, snapshots on connect. WebSocket is used for the “push” parts: continuous score updates during a live match. Using WebSocket for a one-off historical query would be overkill; using REST for continuous updates would be far too slow. Matching the protocol to the interaction pattern is one of the most common ways good designs go wrong when done carelessly.
- “Would you use REST or gRPC between the internal microservices?” — gRPC is a strong fit internally (binary protocol, streaming, strongly typed contracts), while REST/JSON at the public API layer gives easier client compatibility — the two aren’t mutually exclusive.
7.4 API Versioning — A Small Detail That Prevents Big Outages
Public APIs are versioned in the URL (/v1/matches/…, /v2/matches/…) so that a breaking change — say, renaming a field or altering the semantics of an existing one — can be rolled out on /v2 while /v1 remains stable for existing clients that haven’t yet upgraded. Millions of installed mobile apps rarely all upgrade the same day, and forcing them to would create a real support nightmare, so explicit versioning protects both the platform team and the users.
7.5 Idempotency Keys on Writes
Any endpoint that mutates state (subscribing to notifications, updating user preferences, submitting a score correction) accepts an optional Idempotency-Key header. If the same key arrives twice (because the client retried after a network blip), the server recognises it as a duplicate and returns the original result rather than performing the operation again — the same idempotency principle discussed earlier, but exposed as a first-class API primitive.
7.6 Service Discovery — How Services Find Each Other
In a large microservices deployment, the address of any given service instance is constantly changing as instances scale in and out. Service discovery is the piece that keeps this manageable: services register themselves with a registry (e.g., Consul, Eureka, or Kubernetes’ built-in service DNS) when they come up, and callers look up the current healthy instances by logical name rather than IP address. This makes the system genuinely elastic — new instances can appear or disappear without any manual configuration change on the caller’s side.
Service discovery is like calling the receptionist at a large office to ask which meeting room the sales team is in today, rather than memorising a fixed room number that may have changed. The receptionist always knows the current location and updates callers seamlessly.
In a Kubernetes-based deployment, this comes essentially for free: services are addressed by DNS names like match-score-service.default.svc.cluster.local, and Kubernetes itself keeps that name pointing at the currently healthy pods.
7.7 A Real REST Endpoint Implementation Sketch
@RestController
@RequestMapping("/v1/matches")
public class MatchSnapshotController {

    private final RedisTemplate<String, MatchState> redis;
    private final MatchRepository db;

    @GetMapping("/{id}")
    public MatchSnapshot getSnapshot(@PathVariable String id) {
        // Try the hot cache first (sub-millisecond).
        MatchState state = redis.opsForValue().get("match:" + id + ":state");
        if (state != null) return MatchSnapshot.from(state);

        // Cache miss: read from the durable source of truth and repopulate.
        MatchState fromDb = db.findById(id)
                              .orElseThrow(() -> new NotFoundException(id));
        redis.opsForValue().set("match:" + id + ":state", fromDb, Duration.ofMinutes(5));
        return MatchSnapshot.from(fromDb);
    }
}Performance and Scalability
Where the bottlenecks actually are — and the concrete moves that keep the system fast and elastic under a 100x spike.
8.1 Horizontal Scaling at Every Tier
Every stateless tier — API Gateway, Match Score Service, Stats Aggregation Service, WebSocket Gateway — can be scaled horizontally by simply adding more instances behind the load balancer. The scaling signals are tier-specific: the WebSocket Gateway scales on concurrent connections, the stream processor scales on Kafka consumer lag, and the API Gateway scales on CPU and request rate.
8.2 Predictive (Scheduled) Pre-Warming vs. Reactive Auto-Scaling
Predictive: Because match schedules are known in advance, the platform can scale up capacity 30–60 minutes before kickoff based on the known fixture list, rather than waiting for load to spike. Reactive: On top of that baseline, standard auto-scaling (based on CPU, connection count, queue depth) handles unexpected surges — for instance, an unexpectedly dramatic final drawing extra last-minute viewers. This two-layer approach absorbs the sharp part of the spike (with pre-warmed capacity ready in advance) and cushions the residual demand automatically.
8.3 Reducing Payload Size — Small Wins That Add Up at Scale
- Push only deltas, not full state, on every update.
- Use compact wire formats (Protocol Buffers or MessagePack) internally between services; JSON is used only at the client edge for compatibility.
- Reuse persistent connections and enable compression (permessage-deflate for WebSocket, gzip for HTTP), especially for mobile clients on slower or metered networks.
8.4 Database Write Scaling
The Match Score Service writes to the primary DB, but the design deliberately keeps the write rate manageable. Only events are written — not per-user-view records — and derived stats live in Redis and the time-series DB, off the hot write path. This keeps the primary DB well below its write ceiling even during peak matches.
- “How would you handle a 100x spike in ten minutes?” — Pre-warm gateway and stream-processor pools ahead of match time using the schedule; combine with reactive auto-scaling for residual variance; keep the write path narrow so bursts are absorbed by the cache and gateway layers, not by the database.
- “Where’s the single biggest bottleneck?” — The WebSocket Gateway’s per-node connection capacity, gated by OS-level file descriptor limits and per-connection memory footprint.
8.5 A Worked Example — How Many Gateway Nodes for 10M Concurrent Users?
target_concurrent_connections = 10,000,000
per_node_safe_max             = 100,000  // proven in load tests
raw_nodes_needed              = 10,000,000 / 100,000 = 100 nodes

// Add headroom for failure isolation, rolling deploys, regional splits.
safety_headroom               = 1.5x
nodes_for_burst_capacity      = 100 * 1.5 = 150 nodes at peak

// Multi-region split (say, 3 regions):
per_region_nodes              = 150 / 3 = 50 nodes per region

// Between matches, keep a baseline; scale up on schedule.
baseline_per_region           = 10 nodes  (~1M idle connections capacity)
scale_up_delta                = 40 nodes per region, launched at T-30 minutes
This is a deliberately simple model, and the exact numbers per node depend on OS tuning, kernel parameters, event-loop implementation, and message frequency. The point of walking through it is that every number in the plan should trace back to a measured single-node capacity, never to a hopeful guess — an interviewer will (rightly) probe you on where each number came from.
8.6 Little’s Law — The Queuing Insight Behind Every Capacity Plan
Little’s Law states that the average number of items in a stable system equals the arrival rate multiplied by the average time each item spends in the system (L = λW). Applied here: if a gateway node holds 100,000 concurrent WebSocket connections, and the average session lasts an hour, and the platform wants to support 10 million total concurrent sessions, the maths above falls out directly rather than being guessed. Any time you sit down to size a large real-time system, this identity is one of the first tools to reach for — it turns fuzzy hand-waving into a checkable calculation.
8.7 Connection Pooling and Reuse
Between internal services, database connections and outbound HTTP calls are pooled: each service holds a small, bounded pool of ready-to-use connections rather than opening and closing a new connection for every request. This matters enormously at scale because TCP-handshake + TLS-handshake overhead per request is real (measurable milliseconds), and multiplying that overhead by billions of daily internal requests quickly becomes both a latency and a compute cost problem. Pooling eliminates that overhead almost entirely.
8.8 Compression on the Wire — Which Kind, and Where
Different tiers use different compression strategies. Between internal services, compact binary formats (Protocol Buffers, MessagePack) are used because they are more space-efficient than JSON and much faster to parse. Between the platform and browser/mobile clients, JSON with gzip/br HTTP compression — and permessage-deflate for WebSocket — strikes a healthier balance between size, CPU cost, and client-side compatibility. Compression trades CPU for network bandwidth, which is typically a very good trade at scale because bandwidth is often the more expensive resource on high-fan-out systems.
8.9 Latency Budget — Where Every Millisecond Actually Goes
| Hop | Typical p99 target |
|---|---|
| Ingestion → Kafka | < 50 ms |
| Kafka → Match Score Service consume | < 100 ms |
| Match Score Service → DB write + Redis update | < 100 ms |
| Redis Pub/Sub → WebSocket Gateway | < 50 ms |
| WebSocket Gateway → every subscribed client | < 200 ms (network dependent) |
| Client-side render | < 100 ms |
| End-to-end event → screen | < 2 s p99 target |
Breaking the number down this way is what turns a target like “under 2 seconds” into something an engineering team can actually attack: if end-to-end p99 starts drifting to 3 seconds, the same table tells you exactly which hop to look at first, rather than staring at a single opaque number.
High Availability and Reliability
Live sports platforms are judged during their worst five minutes, not their best day — reliability engineering here is the whole game.
9.1 Multi-Region Active-Active Deployment
The platform runs the same full stack in multiple regions simultaneously (active-active), each serving traffic from users nearest to it. If one region fails, GeoDNS shifts its traffic to a healthy region — users see a brief reconnect, not an outage.
9.2 Graceful Degradation Ladder
| Failure | What Users See |
|---|---|
| WebSocket blocked / broken | Automatic fallback to SSE, then to short-interval REST polling. |
| Redis latency spike | Serve last-known score from an in-memory local cache on gateway nodes. |
| Stats Service down | Score continues; stats widget shows “stats temporarily unavailable” instead of crashing the whole screen. |
| Full region failure | GeoDNS reroutes to next-nearest region; clients reconnect within seconds. |
The rule of thumb across every layer: users should never see a blank error screen during a live match. Showing a slightly-stale score with a subtle “reconnecting…” badge is dramatically better than a spinning wheel of doom. A live sports platform that shows “something went wrong” during a World Cup final does more damage to the brand than one that shows a score three seconds behind — users will forgive latency, but they will not forgive being locked out of the match entirely.
9.3 Circuit Breakers — Preventing Cascading Failures
Every service-to-service call is wrapped in a circuit breaker (Resilience4j, Hystrix, or similar). If the Stats Service is failing, the Match Score Service’s calls to it “trip the breaker” after a threshold and start returning a cached-or-empty stats response instantly — without waiting for a timeout on every call — so one downstream failure never turns into a full-platform hang.
@CircuitBreaker(name = "statsService", fallbackMethod = "cachedOrEmpty")
public Stats getStats(String matchId) {
    return statsClient.fetch(matchId);
}

private Stats cachedOrEmpty(String matchId, Throwable ex) {
    return statsCache.getIfPresent(matchId)
                     .orElse(Stats.emptyPlaceholder());
}- “What if the primary database fails during a live match?” — A read replica is promoted (either automatically via a hosted DB failover feature, or via a well-tested runbook if you’re running self-managed Postgres), the write path pauses briefly and buffers to Kafka (which is durable and won’t lose events), and once the new primary is up, the buffered writes drain out — users see a brief delay in updates, not lost events.
- “What’s your RPO and RTO target?” — RPO near zero (Kafka retains events durably even during a DB failover); RTO in single-digit minutes for a full region failover.
9.4 Bulkheads — Isolating Failure Domains
Named after the watertight compartments in a ship’s hull, the bulkhead pattern allocates separate resource pools (thread pools, connection pools, queues) per downstream dependency, so that one slow dependency saturating its pool doesn’t starve the pools used by every other dependency. In practice: the Match Score Service’s calls to the Stats Service use a different thread pool from its calls to the Notification Service, so a slow Notification Service can never lock up score updates.
A ship’s bulkheads mean that if one compartment floods, the rest of the ship still floats. Without them, a single hull breach sinks the whole vessel. The same idea applies to service resource pools — keeping failure contained is often the difference between a small incident and a full-platform outage.
9.5 Chaos Engineering as a Regular Practice
Mature real-time platforms don’t just design for failure — they regularly and deliberately practise it in production or in near-production environments, using tools like Chaos Monkey to randomly kill instances, or by scheduled game-day exercises that simulate regional outages. The goal isn’t to break things for its own sake — it’s to confirm, ahead of a real incident, that automated failover, degradation ladders, and on-call runbooks actually work end to end. It is far, far better to discover a broken failover during a Tuesday afternoon chaos exercise than during a World Cup final.
9.6 Backup and Point-in-Time Recovery
Beyond replication, the durable data stores keep periodic backups (typically daily full backups plus continuous point-in-time-recovery streams for Postgres). Kafka’s log-based retention itself acts as a form of short-term backup for events; longer-term historical events are additionally archived to cold object storage. Combined, these give the platform a well-defined recovery path for a wide range of disaster scenarios — from a single bad database write that needs to be rolled back, to a full-region loss requiring a multi-hour rebuild.
9.7 Region Synchronisation and User Reconnect Behaviour
Cross-region replication of events and durable state is asynchronous by default — making it synchronous would cripple write latency because of the physical round-trip time between distant regions. During a healthy operation, replication lag is measured in single-digit seconds; during a full region failover, users who were connected to the failed region reconnect and may briefly see a score that is a few seconds behind the leading region, until their new region catches up via replication. The sequence-number logic on the client ensures the score still never appears to go backwards on any single user’s screen, even during this transition.
Region sync during failover is like a referee handing over the whistle to a linesman when he has to leave the field — the linesman may be a moment behind on the last play, but the match doesn’t stop, and both officials converge on the same understanding of the state within seconds. Users experience continuity of the match, even as the underlying infrastructure quietly rebalances behind the scenes.
9.8 What Actually Counts as an Acceptable Failure
Not every failure is worth engineering against at the same cost. The design deliberately treats different failure classes with different levels of investment: a single-instance failure inside a region must be completely invisible to users (self-healing, sub-second); a single-region outage may cause a brief reconnect (a few seconds); and a multi-region simultaneous outage — extraordinarily rare and typically caused by a shared upstream provider incident — is treated as a high-severity incident where the goal is fast, honest communication with users rather than pretending nothing is wrong. Being explicit about which failure classes get invisible recovery, which get graceful degradation, and which get honest communication is itself a design decision, not an afterthought.
Security Considerations
A live sports platform is a huge, high-visibility target — the security layer has to hold up under attack and heavy legitimate traffic at the same time.
10.1 The Core Threats and Their Mitigations
- TLS everywhere: All client-server traffic (REST, WebSocket, SSE) is encrypted with TLS 1.2+.
- AuthN & AuthZ at the gateway: Short-lived JWTs issued after login; every request’s token is verified at the API Gateway before hitting any internal service.
- Rate limiting per client: The API Gateway enforces per-user and per-IP rate limits to prevent both accidental floods and deliberate abuse.
- DDoS protection at the edge: CDN and edge providers absorb volumetric attacks well before they reach origin infrastructure.
- Anti-scraping controls: Bot-detection and challenge patterns protect the read APIs from being drained by competitors or resellers.
- Ingestion source validation: Only whitelisted, authenticated data-feed providers can publish events — a spoofed score event is one of the most dangerous possible attacks on a system like this.
- Signed WebSocket subscriptions: Clients must present a signed token when subscribing to a match, preventing anonymous mass-subscription attacks aimed at exhausting gateway resources.
- “How do you prevent a malicious actor from publishing fake score events?” — The ingestion path only accepts events from authenticated, whitelisted data providers over mutual TLS; every event carries a signature verifiable by the ingestion service before being published to Kafka.
- “What about DDoS during the last two minutes of a final?” — Multiple layers: CDN-scale absorption at the edge, rate limiting at the gateway, and pre-warmed capacity so a burst of legitimate load doesn’t look identical to an attack.
10.2 Reconnect Storms — A Security-Adjacent Concern
A partial outage — say, one WebSocket Gateway node crashing with 500,000 connections open — can produce a “reconnect storm” where 500,000 clients all attempt to reconnect within the same second, sometimes with retries stacked on top. This looks nearly indistinguishable from a DDoS attack. The defence is client-side: mandatory exponential backoff with jitter on reconnect so the load is naturally smeared over 30–60 seconds instead of arriving as a single spike, plus server-side rate limits that catch misbehaving clients even if the app’s reconnect logic has a bug.
public long nextDelayMillis(int attempt) {
    long base = Math.min(30_000L, (long)(Math.pow(2, attempt) * 500));
    long jitter = ThreadLocalRandom.current().nextLong(0, 1_000);
    return base + jitter;
}
10.3 Data Privacy for User Profile Data
While match score data is public, user profile data (followed teams, notification preferences, account details) is personal data and is handled separately — encrypted at rest, access-logged, and scoped so that services which don’t need it (like the Commentary Service) never have access to it in the first place, following the principle of least privilege at the data layer, not just the network layer.
10.4 Threat Model Summary
| Threat | Mitigation |
|---|---|
| Volumetric DDoS during a high-visibility final | Edge-level DDoS scrubbing, anycast routing, rate limiting at multiple layers |
| Spoofed or malicious score events | Authenticated, whitelisted data sources; signed payloads; strict schema validation |
| Credential stuffing / account takeover on user accounts | Rate-limited login attempts, anomaly detection, short-lived tokens |
| Scraping of live data at scale by third parties | Per-account and per-IP rate limits, API key requirements for programmatic access |
| Internal lateral movement after a service compromise | Least-privilege service credentials, network segmentation, mutual TLS between services |
- “How would you prevent a competitor from scraping your entire live feed in real time and republishing it?” — API keys with strict per-key rate limits, contractual terms of service, and monitoring for anomalous, bot-like read patterns; acknowledge that fully preventing scraping of a public-facing feed is extremely difficult, and the realistic goal is friction and detection, not perfect prevention.
Monitoring, Logging & Metrics
If you can’t measure it during a live match, you can’t fix it during a live match — observability is a first-class part of the design, not an afterthought.
11.1 The Metrics That Actually Matter for This System
| Metric | Why It Matters |
|---|---|
| Event-to-client latency (p50/p95/p99) | The single most important number — how long from real-world event to a fan seeing it. |
| Active WebSocket connections per node | Tracks the real bottleneck resource for the delivery layer, driving auto-scaling decisions. |
| Message broker consumer lag | If the stream processor falls behind the broker, scores will visibly lag — this must be near zero during live windows. |
| Cache hit ratio (Redis) | A drop signals either a cold cache after deploy or a hot-key overload risk. |
| Error rate per service | Standard service health; watched per-service, not just globally, to isolate which component is degrading. |
| Reconnect rate | A sudden spike often signals a gateway node issue or network-level problem before users even report it. |
11.2 Distributed Tracing
Because a single event crosses five or more services (ingestion → broker → stream processor → score service → cache → gateway → client), distributed tracing (e.g., using trace IDs propagated through Kafka headers and HTTP headers) is essential to answer “why did this specific goal take 6 seconds to reach users instead of 2?”
- “What would you alert on 30 minutes before a major final that you wouldn’t alert on during a quiet Tuesday match?” — Tighter latency thresholds, connection-saturation warnings well before hard limits, and consumer-lag alerts with lower tolerance, since the blast radius of any delay is far larger.
11.3 SLIs, SLOs, and Error Budgets
Service Level Indicator (SLI): a measured metric, like “percentage of score updates delivered within 3 seconds.” Service Level Objective (SLO): the target for that metric, like “99.5% of updates within 3 seconds, measured over a rolling 30 days.” The gap between 100% and the SLO is the error budget — a small, intentional allowance for imperfection that gives engineering teams room to ship changes and take calculated risks without needing literal perfection, while still holding the system accountable to a clear, measurable bar.
11.4 Real-User Monitoring vs. Synthetic Monitoring
Two complementary approaches are used: synthetic monitoring runs automated “fake users” continuously hitting the platform from multiple regions to catch problems before real users do, while real-user monitoring instruments the actual client apps to report their real, experienced latency and error rates — since a synthetic check from a data-center-adjacent monitoring probe can look perfectly healthy even while real users on congested mobile networks are struggling.
11.5 Runbooks Tied to Alerts
Every paging alert links directly to a runbook describing likely causes and first response steps, so that an on-call engineer paged at 2am during a late-night international match doesn’t have to reason from first principles under pressure — they follow a tested checklist first, then escalate if needed.
11.6 A Live “Match Control Room” Dashboard
During any high-profile match, a dedicated real-time dashboard is kept open by the on-call team, showing the handful of metrics that matter most in one glance: current total concurrent connections, end-to-end p99 latency, consumer lag, and error rate per core service. This is deliberately a small, curated view rather than every possible metric the platform tracks — during an active incident, a wall of a hundred graphs is far less useful than five graphs that answer “is it currently working, and if not, where is the problem.” Anything beyond that small set is one click away for deeper investigation, but is not part of the primary at-a-glance view.
Deployment and Cloud
How the platform actually gets shipped, scaled, and cost-controlled — including the operational rituals that keep peak days boring.
- Containerization: Every microservice runs as a container (Docker), orchestrated by Kubernetes, allowing independent scaling per service based on its own metric (connections for the gateway, CPU for stats processing, queue depth for the stream processor).
- Blue-green / canary deployments: Deployments during a live match window are frozen except for critical hotfixes, which go out via canary releases — a small percentage of traffic first, monitored closely, before full rollout.
- Infrastructure as Code: Entire regional stacks are defined declaratively so a new region (or a full disaster-recovery region) can be stood up predictably and quickly.
- Multi-CDN strategy: Using more than one CDN provider avoids a single CDN’s regional outage taking down the whole platform’s static and cached traffic.
- Pre-match runbooks: Before any high-profile match, on-call teams execute a pre-warming and readiness checklist — scaling group sizes, cache warm-up, feature-flag freezes.
- “Would you deploy a code change five minutes before kickoff of a World Cup final?” — Generally no, except a validated, tested critical fix behind a canary — the risk of an untested deploy destabilizing the platform at peak load outweighs almost any benefit.
12.1 Cost Optimisation Without Sacrificing Peak Readiness
Running peak capacity 365 days a year for load that only occurs during a handful of marquee matches would be enormously wasteful. Instead, the platform uses a tiered approach: a modest, always-on baseline fleet handles routine daily matches, autoscaling groups absorb moderate variation, and a scheduled pre-warming job — driven directly by the published match calendar — temporarily scales the fleet up ahead of known high-profile fixtures, then scales back down within a few hours after the match ends. Spot or reserved-instance pricing strategies are often layered in for the predictable baseline, while the elastic burst capacity uses on-demand pricing.
12.2 Feature Flags for Live-Window Safety
New features (a redesigned stats widget, a new notification type) are rolled out behind feature flags that can be toggled off instantly without a redeploy, giving on-call teams a fast, safe way to disable something suspicious mid-match without touching the core score-delivery path at all.
12.3 Choosing Where to Place Regions
Region placement is driven primarily by where the audience actually is, not simply by where infrastructure is cheapest. A platform whose primary audience is concentrated in South Asia, Europe, and North America would prioritise regions physically close to those populations, since network round-trip time is bounded by the speed of light — no amount of clever software design can fully compensate for a user being physically far from every available region. Secondary factors include each region’s regulatory requirements around data residency, which can also influence where certain user data must be stored.
12.4 Rollback Strategy
Every deployment pipeline supports an immediate, automated rollback to the last known-good version if key health metrics (error rate, latency) degrade past a defined threshold within minutes of a rollout — removing the need for a human to make a judgment call under pressure during a live window, when speed matters most.
Design Patterns and Anti-Patterns
Every architectural choice above traces back to a small set of well-known patterns — and being able to name the ones you’re avoiding is often as important as the ones you’re using.
13.1 Patterns Used in This Design
| Pattern | Where It’s Used |
|---|---|
| Publish/Subscribe | Kafka event broker, Redis Pub/Sub fan-out to gateways |
| CQRS (Command Query Responsibility Segregation) | Writes go through the Match Score Service and database; high-volume reads are served from Redis/cache, separated from the write path |
| Circuit Breaker | Service-to-service calls (e.g., Score Service calling Stats Service) |
| Snapshot + Delta | Client connection lifecycle — fetch full state once, then stream small changes |
| Backpressure / Rate Limiting | API Gateway, subscription rate limits |
| Bulkhead | Isolating resource pools per service so one overloaded dependency can’t exhaust shared thread pools platform-wide |
13.2 Anti-Patterns to Avoid
✗ Chatty Polling at Short Intervals
Aggressive polling (every 1–2 seconds) from millions of clients recreates the exact load problem push architectures are built to avoid.
✗ One Giant Shared Database Connection Pool
Letting every microservice share one connection pool means one slow service can starve connections needed by the critical score-write path.
✗ Synchronous Fan-Out on Write
Having the write path directly and synchronously call every downstream consumer (instead of publishing to a broker) couples services tightly and makes the write path only as fast as the slowest consumer.
✗ No Graceful Degradation Path
Treating every downstream failure as a hard error instead of degrading gracefully turns a minor stats-service blip into a full outage of the score screen.
- “Why CQRS here specifically?” — Read and write patterns are wildly asymmetric (millions of reads per single write), so separating them lets each side scale and be optimised independently.
13.3 The Observer Pattern, Generalised to Distributed Systems
At a code-design level, WebSocket subscription management is essentially the classic Observer design pattern (a subject notifies all registered observers of a state change) implemented at massive, distributed scale. Recognising this connection is useful: the same reasoning you’d use to design a small in-process event-listener system in a single Java application scales up — with the addition of a message broker and a cache — to millions of network-connected observers.
13.4 More Anti-Patterns Worth Naming
✗ Ignoring Backpressure
If the Stream Processor can’t keep up with event volume and there’s no backpressure mechanism, it will either crash from memory exhaustion or silently drop events — both unacceptable for score data.
✗ Tight Coupling to One Data Source Format
Hardcoding assumptions about one official data feed’s exact format makes it painful to add a second data provider later, or to switch providers if one becomes unreliable during a live match.
✗ Skipping the Adapter Layer at Ingestion
If internal services consume the external data source’s raw format directly instead of a normalised internal schema, a single upstream provider change can ripple through every downstream service simultaneously.
✗ Overusing Strong Consistency by Default
Reaching for the strongest available consistency guarantee everywhere “to be safe” quietly caps how far the read path can scale, when most of that data doesn’t actually need it.
Naming anti-patterns explicitly, and not just the patterns being used correctly, is a habit worth building deliberately. In interviews and in real design reviews alike, being able to say “here is what we are avoiding, and here is specifically why” is often more convincing than simply listing the technologies chosen, because it demonstrates that the design came from reasoning about trade-offs rather than from following a checklist.
Advantages, Disadvantages & Trade-offs
A grown-up look at what this design gives you, what it costs, and where the tension between competing goods actually sits.
✓ Advantages
Handles extreme, spiky concurrency; sub-2-second latency; graceful degradation instead of hard failure; independent scaling per component; strong observability for fast incident response; each piece of the system can evolve and be replaced independently as technology or scale requirements change.
⚠ Disadvantages
High operational complexity (many moving services); eventual consistency between cache and database requires careful reasoning; significant infrastructure cost even with elasticity; requires disciplined pre-match operational rituals; a steep learning curve for engineers newly joining the team, since understanding one bug often requires tracing across five or more services.
It’s worth being explicit that this architecture is deliberately over-engineered for a small platform with a modest, steady user base — the complexity only earns its keep once concurrency and traffic burstiness reach the scale described throughout this guide. A smaller sports app serving a few thousand concurrent users would be well served by a much simpler design: a single well-tuned server, a straightforward database, and short-interval polling or a basic WebSocket setup without the full multi-region, multi-service architecture described here. Recognising when not to build all of this is as much a sign of good judgment as knowing how to build it when the scale genuinely demands it.
14.1 Key Trade-off: Strong Consistency vs. Availability During Partition
Under the CAP theorem, during a network partition this system deliberately favours availability over strict consistency — it is far better for a small subset of users to briefly see a score that is one event behind than for the entire app to become unavailable. Monotonic ordering per client (never showing the score “go backwards”) is maintained even while strict global real-time consistency is temporarily relaxed.
14.2 Key Trade-off: Cost vs. Pre-Warmed Capacity
Pre-warming infrastructure ahead of a predicted spike costs real money for capacity that may go unused if a match turns out to be lower-interest than forecast. The alternative — pure reactive scaling — risks dropped connections and a bad user experience during the exact moments that matter most for brand trust. Most mature platforms accept the extra cost as the price of reliability during headline events.
- “If you had to cut cost by 30%, what would you change first?” — A strong answer discusses tiering: full pre-warming only for top-tier “marquee” matches, reactive-only scaling for lower-interest matches, since not all matches carry equal risk/reward.
14.3 Key Trade-off: Microservices Flexibility vs. Operational Overhead
Splitting the system into many small services gives independent scaling and deployment, but it also means more network hops per request, more places for a bug to hide, and a real need for investment in tooling (tracing, service meshes, on-call runbooks) that a simpler monolith wouldn’t require. For a team without strong platform-engineering maturity, a smaller number of well-designed services — rather than dozens of tiny ones — is often the more pragmatic starting point, evolving toward finer-grained services only as scale genuinely demands it.
14.4 Key Trade-off: Build vs. Buy for the Real-Time Delivery Layer
Building a custom WebSocket Gateway gives full control over connection management and cost at extreme scale, but managed real-time messaging services exist and can meaningfully reduce operational burden for teams at a smaller scale, at the cost of less fine-grained control and potentially higher per-connection pricing once volume grows very large. The right choice depends heavily on the team’s existing scale and in-house infrastructure expertise.
Best Practices and Common Mistakes
The habits that separate a live sports platform that shrugs off a World Cup final from one that becomes the trending outage on social media.
15.1 Best Practices
- Always design the client to degrade gracefully to a “last known good” state instead of an error screen.
- Use monotonically increasing sequence numbers so clients can always detect and discard out-of-order or duplicate messages.
- Pre-warm infrastructure ahead of known high-profile matches using the published schedule.
- Separate the read path and write path (CQRS) so read scaling never threatens write correctness.
- Keep push payloads minimal — send deltas, not full state, on every update.
- Load test at 2–3x your highest historical peak before every major tournament, not just once a year.
15.2 Common Mistakes
- Under-provisioning connection capacity because load testing used average traffic instead of worst-case simultaneous-final traffic.
- Ignoring thundering-herd reconnects — when a gateway node restarts, thousands of clients reconnecting simultaneously without jittered backoff can overwhelm the load balancer.
- Treating all matches as equal in capacity planning, instead of tiering infrastructure investment by expected audience size.
- Coupling the stats pipeline to the critical score-write path, so a slow stats calculation delays the core score update.
- Skipping schema validation at ingestion, allowing a single malformed event from a data source to corrupt downstream state.
- Not testing the client’s reconnect logic under real network conditions — a reconnect strategy that works perfectly on a fast office Wi-Fi connection can behave very differently on a spotty mobile network during a packed stadium event, where thousands of nearby phones are competing for the same cell tower bandwidth.
- Treating monitoring as an afterthought added right before launch, rather than building observability in from the very first service, which makes early incidents far harder to diagnose precisely when the team has the least experience operating the new system.
15.3 A Short Principle to Hold Onto
Nearly every best practice in this section traces back to one underlying idea: design for the worst five minutes of the year, not the average day. A live sports platform is judged almost entirely by how it behaves during its highest-stakes, highest-traffic moments — nobody remembers a quiet Tuesday match going smoothly, but everybody remembers a World Cup final scoreboard freezing. Every capacity plan, every degradation ladder, and every pre-match checklist in this guide exists in service of that single principle.
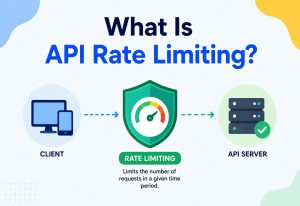
- “Tell me about a mistake a team might make the first time they build this kind of system.” — Load testing with average, not peak-concurrent-final, traffic is one of the most common and most costly mistakes teams make.
15.4 A Pre-Match Readiness Checklist, in Practice
| Time Before Kickoff | Action |
|---|---|
| T-24 hours | Confirm expected-audience tier for the match; schedule pre-warming job accordingly. |
| T-2 hours | Freeze non-critical deployments; verify all dashboards and alert thresholds are set for “live window” sensitivity. |
| T-30 minutes | Begin pre-warming scale-out; verify cache is warm; run a synthetic end-to-end latency check. |
| T-5 minutes | On-call team on standby; confirm regional health checks all green. |
| Kickoff | Active monitoring of connection counts, consumer lag, and p99 latency in real time. |
| Post-match | Scale back down; review any incidents; feed learnings back into the next readiness checklist. |
Real-World / Industry Examples
The same architectural shape shows up across every high-traffic, event-driven, one-to-many broadcast system in the industry — sports is just the loudest example.
Streaming Platforms During Marquee Sports Events
Large streaming and OTT platforms handling major sports finals rely heavily on multi-CDN strategies and pre-warmed, geo-distributed capacity to absorb tens of millions of concurrent viewers within a short pre-kickoff window.
Global E-Commerce and Cloud Providers
Large cloud infrastructure providers commonly cite live sports and major broadcast events as some of the most demanding traffic-spike scenarios their auto-scaling systems are designed to handle.
Ride-Hailing Style Event-Driven Backbones
The publish/subscribe, event-streaming backbone pattern used here mirrors the same core architecture used by large-scale ride-hailing and food-delivery platforms for real-time location and order-status updates — a different domain, but structurally the same real-time fan-out problem.
Social Media “Trending Event” Surges
Social platforms use similar pre-warming and multi-region failover practices around predictable, high-attention live events (major sports finals, elections) where traffic is both massive and time-boxed.
Note: these are illustrative, industry-general patterns rather than confirmed internal architectures of any specific company, since exact implementation details are typically not publicly disclosed.
16.1 Lessons the Industry Has Learned the Hard Way
Across many public post-incident write-ups from large-scale, high-traffic-event platforms (whether sports, elections, or product launches), a handful of recurring lessons show up again and again:
- Traffic forecasts are frequently wrong in the “too low” direction for genuinely unprecedented events — an unexpectedly close, high-drama match can draw far more last-minute viewers than any forecast predicted, which is why healthy safety margins (20–50% above the forecast) are standard practice, not paranoia.
- The failure mode is rarely one single component — it’s usually a chain: a downstream dependency slows down, retries pile up, thread pools fill, and a seemingly unrelated part of the system falls over minutes later. This is exactly why bulkheads and circuit breakers are treated as first-class design elements, not optional extras.
- Client-side behaviour matters as much as server-side design. A well-architected backend can still suffer if millions of clients all retry aggressively at once after a hiccup; disciplined client reconnect logic (backoff with jitter) is just as important as any server component.
- The last mile — the user’s actual network — is the least controllable part of the system, which is exactly why real-user monitoring, and not just server-side metrics, is essential for understanding what fans are truly experiencing.
16.2 How This Pattern Generalises Beyond Sports
Live Auctions and Stock Tickers
Same “one authoritative price/state, millions of watchers” shape, with an even tighter latency requirement in financial contexts where milliseconds carry real monetary value.
Election Result Tracking
A single, time-boxed, extremely high-attention event with a similarly unpredictable and massive traffic spike, and an even higher bar for consistency given the sensitivity of the data.
Multiplayer Game Leaderboards
Real-time state fan-out to many concurrent viewers/players, often layering in additional bidirectional interaction (player actions flowing back upstream), unlike a mostly one-directional sports scoreboard.
Breaking News Alerts
Push-notification-heavy rather than persistent-connection-heavy, since most users aren’t actively watching a live feed, making the Notification Service the dominant component instead of the WebSocket Gateway.
FAQ
The questions that come up most often, from beginners walking through this design for the first time and from interviewers probing the reasoning behind each choice.
Why not just use polling with a very short interval, like 1 second?
At millions of concurrent users, even a 1-second poll interval creates millions of requests per second hitting the origin continuously, the vast majority of which return “nothing changed.” This wastes enormous server capacity and battery/data on the client, and still can’t beat push-based delivery on latency.
What happens if two events arrive out of order?
Each event carries a monotonically increasing sequence number per match. Clients and services can detect an out-of-order arrival and either buffer briefly to reorder, or discard a stale duplicate, ensuring the displayed score never regresses.
Is strong consistency achievable across all users at all times?
Not perfectly, and that’s an intentional trade-off. The system favours availability and low latency, accepting that a small number of users might be one event behind for a very short window during network issues, rather than blocking everyone until perfect consistency is guaranteed.
How many WebSocket connections can one server realistically hold?
With proper OS-level tuning (file descriptor limits, efficient event loops, modest per-connection memory footprint), a single well-tuned server can often hold well over 100,000 concurrent connections, though the practical number depends heavily on message frequency and payload size per connection.
Why use both WebSocket and Server-Sent Events?
WebSocket is bidirectional and efficient but can be blocked by some restrictive networks/proxies. SSE is a simpler, HTTP-based, one-way fallback that works in more restrictive network environments, ensuring the platform still functions for those clients.
How is this different from a general chat application’s real-time architecture?
Structurally similar (both need low-latency fan-out), but sports platforms have a far more extreme “one writer, millions of readers” ratio on any given match, whereas chat apps typically have a more balanced write-to-read ratio across many independent small groups.
Why partition by matchId instead of, say, by user region?
Partitioning by matchId keeps all events for a single match together and strictly ordered, which is essential for correctness. Partitioning by user region would scatter a single match’s events across many partitions, making it far harder to maintain per-match event ordering.
What happens during a scheduled maintenance window if a match runs long (extra time, rain delay)?
Maintenance windows are never scheduled based on a match’s expected end time alone; the platform tracks each match’s live state and blocks any risky operational activity while a match remains in the LIVE or PAUSED state, regardless of how long it runs.
How do you handle multiple simultaneous high-profile matches on the same day?
Capacity planning treats each high-profile match as its own forecasted load, and pre-warming accounts for the combined total when schedules overlap — for example, two marquee league matches kicking off within the same hour are planned for as an additive peak, not independently.
Summary and Key Takeaways
We started with a simple, relatable moment — and worked all the way down to sequence numbers, circuit breakers, and connection-pool sizing.
We started with a simple, relatable moment — millions of fans staring at their phones during the last few minutes of a final — and worked all the way down to sequence numbers, circuit breakers, and connection-pool sizing. That journey mirrors how real system design should work: start from the human problem and the numbers behind it, and let those numbers honestly drive every architectural decision, rather than picking impressive-sounding technologies first and justifying them afterward.
If you take only one idea away from this entire guide, let it be this: a live sports platform is, at its heart, a fan-out problem, and every major design decision in this document exists to make that fan-out cheap, fast, and resilient at a scale where naive approaches collapse. Everything else — the choice of Kafka, the layered caching, the multi-region failover, the graceful degradation ladder — is simply the detailed engineering answer to that one core problem.
Key Takeaways
- A live sports score platform is fundamentally a real-time, event-driven fan-out problem — one write, millions of reads, delivered within seconds.
- The architecture separates concerns cleanly: ingestion → event broker → stream processing → source-of-truth database → cache → real-time delivery gateway → client.
- Push-based delivery (WebSocket, with SSE as fallback) replaces polling to avoid wasted, redundant load at scale.
- CQRS separates the low-volume write path from the extremely high-volume read path, letting each scale independently.
- Predictive pre-warming combined with reactive auto-scaling handles the extreme, predictable-timing traffic spikes unique to live sports.
- The system deliberately favours availability over strict consistency during network partitions, while preserving monotonic per-client ordering.
- Graceful degradation at every layer — falling back to slightly-stale-but-correct data — is preferred over any hard failure or blank error screen.
- Multi-region active-active deployment, circuit breakers, and bulkheads protect the platform from cascading failures during the highest-stakes moments.

