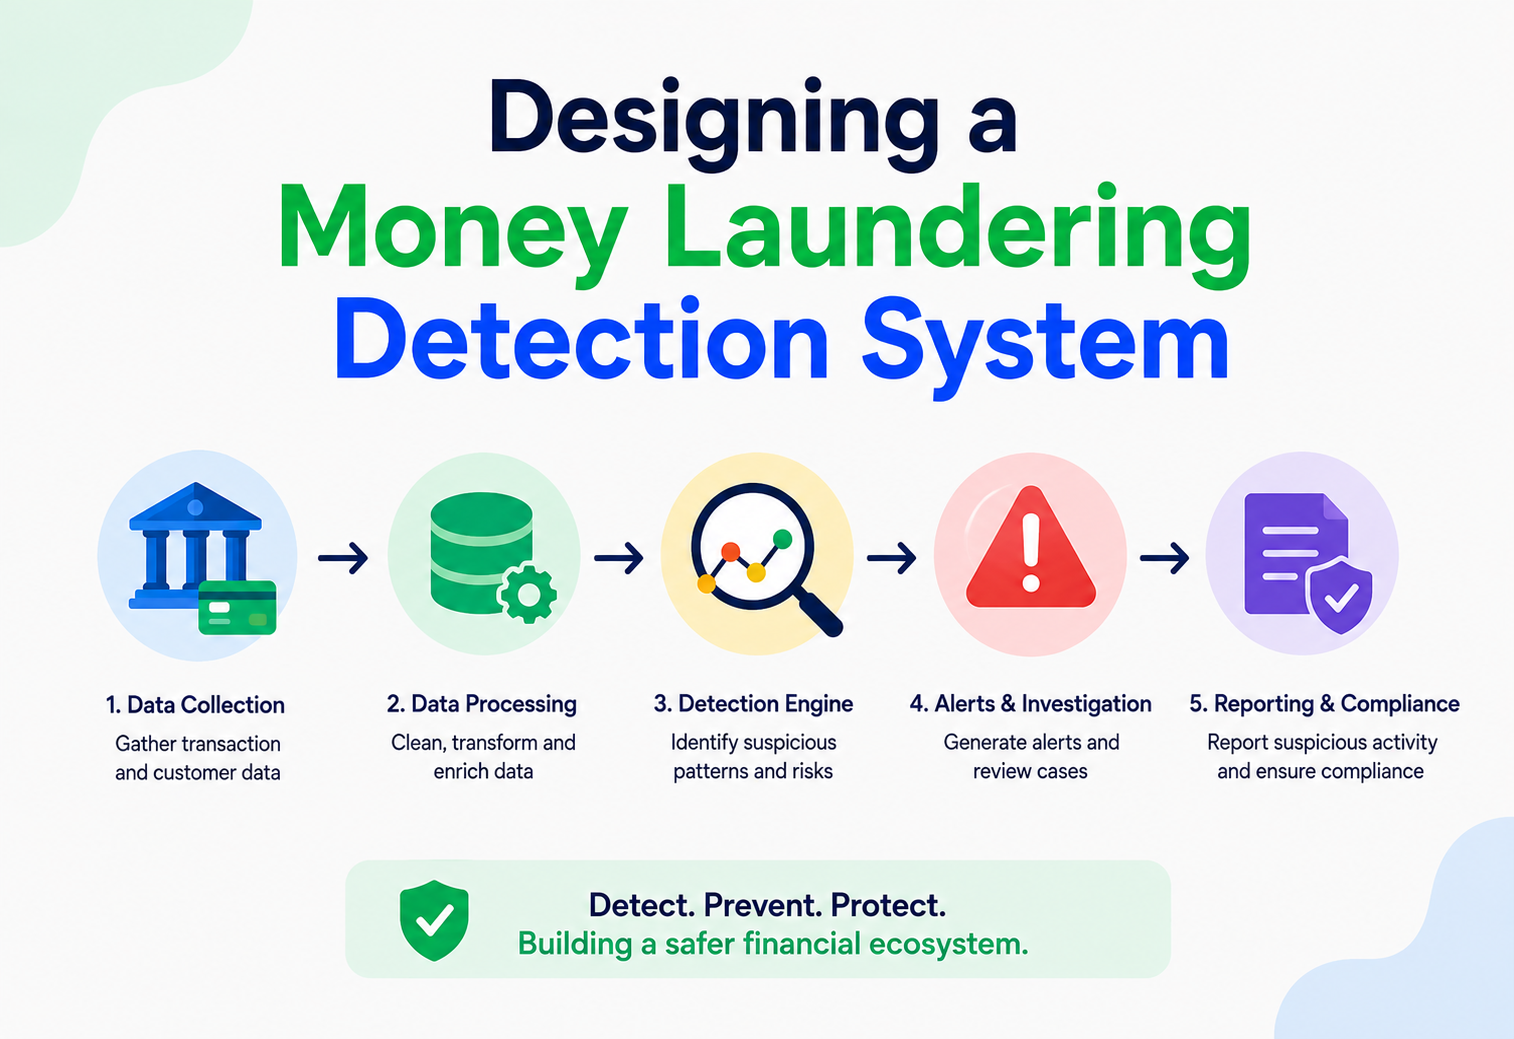
Designing a Money Laundering Pattern Detection System
A complete, beginner-to-production system design walkthrough: how to catch suspicious aggregate patterns hidden across millions of individually legitimate-looking transactions, in near real time, at massive scale — using streaming aggregation, graph-based network analysis, and machine learning working together.
Introduction and History
Imagine watching a single raindrop fall. It tells you almost nothing. Now imagine watching an entire storm from a satellite, and suddenly a clear, unmistakable pattern — a hurricane — emerges from millions of individual raindrops that, one at a time, looked completely ordinary. Detecting money laundering works the same way. A single transaction of 9,000 rupees sent from one account to another looks completely normal, the kind of thing that happens millions of times a day on any payment platform. But when the same account receives twenty separate 9,000-rupee deposits from twenty different people within three days, and then immediately forwards nearly all of it to an account in another country, a pattern emerges that a single transaction, viewed in isolation, could never reveal.
Money laundering — the process of disguising the origins of illegally obtained money so it appears to come from a legitimate source — has existed for as long as organised crime and financial systems have coexisted. The term itself is said to trace back to the practice of laundromats being used as fronts for illicit cash businesses in the early twentieth century, but the underlying activity, structuring transactions to hide their true origin, is far older. What has changed dramatically is scale and speed. In a paper-based banking era, investigators could review suspicious activity reports manually, over days or weeks. Today, a large digital payment platform processes millions of transactions every single minute, and criminals have adapted their techniques specifically to blend in with this ocean of legitimate activity — breaking large sums into many small transactions, called structuring or smurfing, and routing money through long, complex chains of accounts, called layering, precisely to avoid triggering any single, simple threshold rule.
Regulators worldwide, including bodies like the Financial Action Task Force (FATF), require financial institutions and many payment platforms to actively monitor for these patterns and file Suspicious Activity Reports (SARs) when warranted. Failing to do so is not just a reputational risk; it carries serious legal and financial penalties. This tutorial walks through, piece by piece, how to design a system capable of finding these aggregate patterns — patterns invisible in any single transaction — across the enormous, continuous flood of activity a modern payment platform generates.
“Why can’t this problem be solved with simple threshold rules, like flagging any transaction over a certain amount?” A good answer explains that sophisticated actors deliberately structure transactions to stay under any single known threshold, which is exactly why detection must look at aggregate behaviour over time and across related accounts, not just individual transaction amounts in isolation.
1.1 From Manual Review to Automated, Continuous Monitoring
It is worth understanding how this field evolved to appreciate why the architecture in this tutorial looks the way it does. In the earliest era of anti-money-laundering compliance, banks relied almost entirely on branch staff noticing unusual behaviour and filing paper reports — an approach that worked reasonably well when transaction volumes were modest and relationships between a bank teller and a regular customer were personal and direct. As transaction volumes grew through the twentieth century, and especially as electronic banking exploded from the 1990s onward, this manual, relationship-based approach became structurally impossible to sustain; no human reviewer could realistically notice a subtle pattern spread across thousands of accounts and millions of transactions. This drove the industry toward automated, rule-based transaction monitoring systems in the 1990s and 2000s, and more recently toward the combination of streaming analytics, graph-based network analysis, and machine learning covered throughout this tutorial — each evolutionary step driven by the same underlying pressure: transaction volume growing faster than any purely manual or simplistic automated approach could keep up with.
1.2 A Short Timeline of Anti-Money-Laundering Detection
Early–Mid 20th Century — Manual, Relationship-Based Detection
Bank branch staff notice unusual behaviour among familiar customers and file paper Suspicious Activity Reports. Detection is entirely human-driven, and depends on personal knowledge of each customer’s normal pattern.
1970s–1980s — The Regulatory Framework Emerges
Laws such as the US Bank Secrecy Act and, later, guidance from the Financial Action Task Force (FATF, established 1989) formalise the obligation to detect and report suspicious activity, turning AML from optional diligence into a legal requirement.
1990s–2000s — Rule-Based Transaction Monitoring
As electronic banking scales, banks deploy automated rule engines that flag transactions crossing fixed thresholds. Detection becomes computerised but is still fundamentally single-transaction-oriented.
2010s — Streaming, Graph, and Machine Learning
The rise of Kafka-style event buses, stream processors like Flink, and graph databases like Neo4j makes it economically feasible to reason about aggregate behaviour and network relationships continuously, catching patterns that rule engines alone structurally cannot.
Today — The Lambda-Style Hybrid Architecture
Modern platforms combine a real-time streaming path for fast-forming patterns with a slower, deeper batch path for complex, long-horizon patterns — the design this tutorial walks through end to end.
Problem and Motivation
Let’s carefully break down what makes this problem genuinely difficult, and distinct from many of the other systems covered elsewhere in this tutorial series.
2.1 The Core Problem: Signal Hidden in Aggregate, Not in Any Single Event
Unlike fraud detection on a single transaction — where a stolen card number or an impossible travel pattern can sometimes be spotted from that one event alone — money laundering patterns are, by design, invisible at the level of any individual transaction. The signal only exists in the relationship between many transactions: their timing, their amounts relative to known thresholds, the network of accounts involved, and how money flows through that network over hours, days, or weeks. A system that only evaluates transactions one at a time, no matter how sophisticated its rules, will structurally miss this entire category of pattern.
2.2 The Classic Laundering Patterns to Detect
- Structuring, or smurfing: Breaking a large sum into many smaller transactions, each individually below a regulatory reporting threshold, often spread across multiple accounts or time windows to avoid detection.
- Layering: Moving money rapidly through a long chain of accounts, sometimes across many institutions or countries, specifically to obscure the money’s original source before it reaches its final destination.
- Round-tripping: Money that eventually flows back, often through a complex, disguised path, to an account connected to its original sender — sometimes used to fabricate a false paper trail of legitimate business activity.
- Smurf networks or rings: A cluster of seemingly unrelated accounts that, when viewed as a network graph, reveal a tight, coordinated pattern of money moving in and out among themselves, often controlled by a single actor using many different identities.
- Sudden behavioural shifts: An account with years of small, predictable, personal transaction history suddenly beginning to receive and forward large sums in a pattern completely unlike its established behaviour.
A single deposit of 9,000 rupees is unremarkable. But if the same account receives nine separate 9,000-rupee deposits from nine different senders across three days — each individually below a hypothetical 10,000-rupee reporting threshold — and the combined 81,000 rupees is then transferred out within hours, the pattern across those nine events tells a very different story than any single deposit does.
Financial institutions and payment platforms are legally required, in most jurisdictions, to maintain transaction monitoring systems capable of detecting these aggregate patterns, and to file Suspicious Activity Reports with financial intelligence units when warranted — making this system not just a technical challenge but a genuine regulatory and legal necessity for any platform moving significant volumes of money.
2.3 Why This Is Especially Hard at Scale
- Enormous transaction volume: At a scale of millions of transactions per minute, the system must continuously maintain and update behavioural context for an enormous number of accounts simultaneously, not just process each transaction in isolation.
- Time-window reasoning: Patterns unfold over minutes, hours, or even weeks, requiring the system to maintain rolling historical context far beyond a single request-response interaction — unlike many of the other systems covered in this tutorial series.
- Network, not just individual, analysis: Detecting a smurf ring requires understanding relationships between many accounts, a fundamentally different kind of computation than checking one account’s balance or history alone.
- High cost of both false positives and false negatives: Flagging too many legitimate customers as suspicious overwhelms human investigators and damages customer trust, while missing genuine laundering activity carries serious legal and regulatory consequences.
- Adaptive adversaries: Unlike a shipping-cost calculation or a payment retry, the “opponent” here actively studies and adapts to known detection rules, meaning the system must evolve continuously — not be built once and left unchanged.
“How is this fundamentally different, from a systems design perspective, from the payment and transfer systems covered elsewhere in this tutorial series?” A strong answer highlights that those systems reason about a single request in isolation — needing correctness and speed for one operation at a time — while this system needs to reason about aggregate behaviour across time and across a network of related entities, fundamentally shifting the architecture toward streaming aggregation, graph analysis, and batch pattern mining, alongside the real-time components.
Architecture and Components
Let’s design the system, layer by layer, with every box explicitly labelled by the type of component it represents.
3.1 Component-by-Component Explanation
Upstream Payment Platforms
The various transfer, card-processing, and wallet systems within the marketplace or bank generate a continuous stream of transaction events. This monitoring system does not initiate transactions itself; it observes and analyses them as they happen, sitting alongside, not inside, the critical payment path.
API Gateway
The API Gateway authenticates and validates incoming transaction event submissions from upstream systems, as well as serving a separate, lower-volume API used by compliance analysts to query cases and account histories.
Global and Regional Load Balancers
Standard two-tier load balancing — exactly as used throughout this tutorial series — routes ingestion traffic to the nearest healthy region and then evenly across many Stream Ingestion Service replicas within that region.
Stream Ingestion Service
A stateless microservice that validates incoming transaction events for basic structural correctness and publishes them onto the Event Bus. This service deliberately does no analysis itself; its only job is fast, reliable ingestion.
Event Bus
A Kafka cluster serving as the durable, ordered backbone of the entire system. Every transaction event is published here once, and multiple independent downstream consumers — the Real Time Feature Engine and the Data Lake — read from it independently, allowing real-time and batch analysis to proceed without interfering with each other.
Real Time Feature Engine
An Apache Flink cluster, chosen specifically for its strength in stateful stream processing, continuously maintains rolling aggregates for every account: transaction counts and sums over sliding time windows, counts of distinct counterparties, and velocity metrics — updating these figures incrementally as each new transaction event arrives.
Feature Store
A Redis cluster holds the current, low-latency-accessible value of every account’s rolling behavioural features, allowing the Rule Engine to check an account’s recent aggregate behaviour in single-digit milliseconds rather than recomputing it from raw transaction history on every check.
Rule Engine
A stateless microservice that evaluates known structuring and velocity patterns against the current feature values for each account — such as “more than five transactions just below the reporting threshold within twenty-four hours” — flagging candidates for deeper analysis.
Graph Database
A Neo4j cluster stores the transaction network as a graph, where accounts are nodes and transactions are edges. This is essential for detecting layering and smurf-ring patterns, which are fundamentally about relationships and paths between accounts — a kind of query that graph databases are purpose-built to answer efficiently, unlike a traditional relational database.
ML Scoring Service
A stateless microservice hosting behavioural anomaly detection models, combining an account’s rolling features and its position in the transaction graph into a single risk score — catching subtler, less rule-like patterns that a fixed set of hand-written rules might miss.
Case Management Service
Creates and tracks investigation cases whenever a candidate pattern crosses a risk threshold, routing them into a queue for human compliance analysts, and recording every decision made along the way for audit purposes.
Case Database
A PostgreSQL cluster storing the full lifecycle of every alert and investigation — from initial flag through analyst review to final resolution, including a Suspicious Activity Report filing where warranted.
Batch Pattern Mining Service
An Apache Spark cluster that periodically re-analyses the full transaction history stored in the Data Lake, searching for slower-forming, more complex patterns spanning days or weeks that would be impractical to detect purely through real-time streaming aggregation alone.
Data Lake
An object storage cluster retaining the complete, immutable history of every transaction event, serving both the Batch Pattern Mining Service and regulatory record-keeping requirements — which often mandate retaining transaction data for several years.
Monitoring Stack
Prometheus and Grafana track ingestion lag, feature computation latency, and alert volume trends — essential for a system where a silent pipeline failure could mean genuinely suspicious activity goes completely undetected.
“Why does this architecture need both a streaming layer and a separate batch layer, rather than just one or the other?” A strong answer explains that the streaming layer catches fast-forming, well-understood patterns with low latency, while the batch layer can afford much more computationally expensive analysis over longer time windows and larger graphs — catching slower, more sophisticated patterns the streaming layer’s tighter latency budget cannot accommodate. This combination is a specific instance of the well-known Lambda architecture pattern.
3.2 Why This System Sits Beside, Not Inside, the Payment Path
It is worth being explicit about a deliberate architectural choice: this system observes transactions after they have already been authorised and processed by the underlying payment or transfer system, rather than sitting directly in the critical path that decides whether a transaction succeeds. This is different from the fraud detection systems that often do sit directly in the authorisation path, blocking a transaction in real time before it completes. The reasoning is that most laundering patterns can only be confidently identified by looking at aggregate behaviour across multiple transactions, which by definition cannot be known at the moment any single transaction is being authorised. Placing this system alongside the payment path, consuming transaction events after the fact, keeps the core payment systems — covered in earlier tutorials in this series — free to optimise purely for speed and correctness on a single transaction, while this system focuses entirely on the different, aggregate-shaped problem it exists to solve: generating alerts and cases for review rather than blocking decisions in the moment.
Internal Working
Let’s zoom into exactly how a structuring pattern — invisible in any single transaction — is detected across many events over time.
4.1 Maintaining Rolling Windows Incrementally
The Real Time Feature Engine cannot afford to recompute an account’s full transaction history from scratch every time a new transaction arrives; at millions of events per minute, this would be far too slow. Instead, it maintains incremental, sliding-window aggregates using Flink’s native stateful processing capabilities, updating a small, bounded state — such as a count and sum for the last twenty-four hours — with each new event, and automatically expiring old entries as the window slides forward, rather than ever scanning the complete history.
public class StructuringDetectionFunction
        extends KeyedProcessFunction<String, TransactionEvent, StructuringAlert> {

    private transient ValueState<RollingWindow> windowState;
    private static final BigDecimal REPORTING_THRESHOLD = new BigDecimal("10000");
    private static final int MIN_TRANSACTION_COUNT = 5;

    @Override
    public void processElement(TransactionEvent event, Context ctx,
                                Collector<StructuringAlert> out) throws Exception {
        RollingWindow window = windowState.value();
        if (window == null) {
            window = new RollingWindow();
        }

        window.addTransaction(event.getAmount(), event.getTimestamp());
        window.evictOlderThan(event.getTimestamp().minusHours(24));

        boolean belowThreshold = event.getAmount().compareTo(REPORTING_THRESHOLD) < 0;
        boolean nearThreshold  = event.getAmount()
            .compareTo(REPORTING_THRESHOLD.multiply(new BigDecimal("0.9"))) > 0;

        if (belowThreshold && nearThreshold &&
            window.getTransactionCount() >= MIN_TRANSACTION_COUNT) {
            out.collect(new StructuringAlert(event.getSenderId(),
                window.getTotalAmount(), window.getTransactionCount()));
        }

        windowState.update(window);
    }
}
4.2 Network Analysis for Layering and Smurf Rings
Once the Rule Engine flags a candidate account based on its rolling aggregates, it queries the Graph Database to understand that account’s position within the broader transaction network. A query might ask, “find all accounts within three hops that have also received or sent structured-looking amounts within the same time window,” a question that is natural and efficient to express as a graph traversal, but would require many slow, complex joins in a traditional relational database.
MATCH (source:Account {id: $accountId})-[t:TRANSACTED*1..3]-(related:Account)
WHERE t.timestamp > datetime() - duration('P3D')
  AND t.amount < 10000
WITH related, count(t) AS transactionCount, sum(t.amount) AS totalAmount
WHERE transactionCount >= 4
RETURN related.id, transactionCount, totalAmount
ORDER BY totalAmount DESC
4.3 Combining Signals With ML Scoring
Rules alone tend to be either too rigid — missing patterns just outside their exact defined thresholds — or too broad, generating overwhelming numbers of false positives. The ML Scoring Service combines the rule-based signal, the graph network context, and the account’s own long-term behavioural baseline into a single risk score using a supervised model trained on historically confirmed cases, giving compliance analysts a prioritised, ranked queue rather than an undifferentiated flood of equally weighted alerts.
“Why use a graph database instead of just storing account relationships in a regular relational database with foreign keys?” A strong answer explains that questions like ‘find all accounts within three hops with a suspicious pattern’ require traversing a variable, unknown number of relationship hops — which relational databases handle through increasingly expensive, deeply nested joins as the hop count grows — while graph databases are specifically architected to traverse relationships efficiently regardless of depth, making them the natural fit for this kind of network analysis.
4.4 Choosing Good Features Is Half the Battle
It is worth pausing to appreciate that the quality of this entire system rests heavily on the specific rolling aggregates and network features chosen — not just the sophistication of the rules or model applied on top of them. Useful features for this kind of detection typically go well beyond simple transaction count and sum, including the number of distinct counterparties an account has interacted with in a given window, how tightly clustered the timing of transactions is, whether transaction amounts cluster suspiciously close to known reporting thresholds, and how quickly incoming funds are subsequently forwarded onward (sometimes called funds velocity). Designing this feature set well is genuinely a collaborative effort between engineers who understand how to compute these values efficiently at scale, and compliance domain experts who understand which behavioural signals actually correlate with real laundering activity based on confirmed historical cases — and this collaboration, more than any single clever algorithm, is usually what separates an effective detection system from an ineffective one.
Data Flow and Lifecycle
Let’s trace the complete life of a structuring pattern, from the first individually unremarkable transaction to a filed Suspicious Activity Report.
Transaction Ingestion
Each transaction from any upstream payment platform is validated and published as an event onto the Kafka Event Bus — both for real-time processing and for permanent storage in the Data Lake.
Incremental Feature Update
The Real Time Feature Engine consumes each event and updates the sender and receiver accounts’ rolling behavioural aggregates, stored in the Redis Feature Store for fast subsequent access.
Rule Evaluation
After each update, the Rule Engine checks whether the account’s updated aggregates now cross any known suspicious pattern threshold — such as several near-threshold transactions within a short window.
Network Context Gathering
If a candidate pattern is flagged, the Rule Engine queries the Graph Database to understand the account’s broader transaction network, checking for connected accounts showing similarly suspicious behaviour.
Risk Scoring
The combined rule signal and network context are passed to the ML Scoring Service, which produces a single, calibrated risk score reflecting the full picture — not just one isolated signal.
Alert Creation
If the risk score exceeds a review threshold, the Case Management Service creates a new investigation case, capturing the full evidence trail: the specific transactions, accounts, and signals that triggered it.
Analyst Review
A human compliance analyst reviews the case through a dedicated dashboard, examining the underlying transaction and network evidence, and decides whether the pattern represents genuine suspicious activity or a false positive.
Resolution
Confirmed suspicious cases proceed to a formal Suspicious Activity Report filing with the appropriate financial intelligence unit; false positives are closed — and, importantly, this outcome is fed back to improve the ML model over time.
Parallel Batch Re-Analysis
Independently, the Batch Pattern Mining Service periodically re-scans the full transaction history in the Data Lake, catching slower, more complex patterns that unfolded over a longer time horizon than the real-time system’s window covers, and can itself create new cases or enrich the graph with newly discovered relationships.
An account receives nine separate transfers of 9,200 rupees each from nine different senders across three days — each individually just under a hypothetical 10,000-rupee threshold. The Real Time Feature Engine’s rolling window captures this rising count and sum. The Rule Engine flags it once the fifth such transaction arrives. The Graph Database reveals that six of the nine senders have also each sent similar near-threshold amounts to two other accounts in the past week, suggesting a coordinated ring rather than nine unrelated, coincidental transactions. The ML Scoring Service combines this network signal with the account’s own otherwise unremarkable history to produce a high risk score, and a case is created for analyst review within minutes of the pattern completing — not weeks later.
Advantages, Disadvantages and Trade-offs
| Aspect | Advantage | Disadvantage or Trade-off |
|---|---|---|
| Real-time streaming detection | Catches fast-forming patterns within minutes, enabling swift action | Limited to patterns detectable within a practical, bounded time window |
| Batch pattern mining | Can find slower, more complex, longer-horizon patterns missed by streaming alone | Introduces detection delay — sometimes hours or days — compared to the real-time path |
| Rule-based detection | Transparent, explainable, easy for regulators and analysts to understand and audit | Rigid; can be deliberately evaded by actors aware of the exact thresholds used |
| ML-based risk scoring | Catches subtler patterns rules alone would miss, adapts as new data arrives | Less transparent; requires careful explainability tooling for regulatory acceptance |
| Graph-based network analysis | Uniquely suited to detecting coordinated rings and layering chains | Graph traversal queries can be computationally expensive at very large scale |
Strengths of the Hybrid Design
- Coverage across pattern speeds — fast and slow, simple and complex, all handled by different but coordinated layers.
- Explainability where it matters — rules and captured features stay auditable for regulators even when ML augments detection.
- Independent scaling — the streaming, graph, batch, and case layers each scale to their own workload shape.
- Continuous improvement loop — analyst decisions feed back into retraining, so precision improves over time.
Real Costs to Accept
- Operational complexity — Kafka, Flink, Redis, Neo4j, PostgreSQL, Spark, and object storage each need dedicated expertise.
- Detection latency for deep patterns — the batch path is deliberately slower than the streaming path.
- Ongoing model and threshold maintenance — adversaries adapt, so detection logic must never stand still.
- Human analyst dependency — the pipeline’s effectiveness is capped by the analyst team’s realistic review capacity.
The central trade-off in this system is detection speed and precision versus depth and completeness. A purely real-time system with tight, narrow time windows will be fast but will structurally miss slower, more patient laundering schemes. A purely batch-oriented system could analyse arbitrarily deep, complex patterns but would introduce unacceptable detection delay for the faster-moving cases. This design deliberately combines both, giving up a small amount of architectural simplicity in exchange for coverage across the full spectrum of pattern speeds — a trade-off that is essentially mandatory given the regulatory and financial stakes involved.
Performance and Scalability
The design target for this system specifies millions of transaction events per minute — roughly 16,700 events per second sustained — with peaks potentially reaching several times that during periods of heavy platform-wide activity. Let’s examine how each layer holds up.
7.1 Partitioning the Streaming Layer by Account
The Real Time Feature Engine partitions its stream processing by account identifier, meaning all events for a given account are always routed to and processed by the same processing task, in order. This is essential for correctness — since rolling aggregates must be updated sequentially per account — and it also naturally enables horizontal scaling: adding more partitions and more Flink task slots spreads the overall workload across more parallel processing units, with each individual account’s state remaining small and independently manageable.
7.2 Keeping the Feature Store Fast
The Redis Feature Store must support extremely fast reads and writes, since every single transaction event triggers both a read of prior state and a write of updated state. It is deployed as a sharded, replicated cluster, with keys distributed by account identifier, and values kept small and bounded — storing only compact rolling summary statistics rather than raw transaction lists — keeping both memory usage and per-operation latency low even at very high throughput.
7.3 Scoping Graph Queries to Stay Fast
Unbounded graph traversals — exploring every possible path with no limit — can become extremely slow on a large, densely connected transaction network. The Rule Engine’s graph queries are deliberately scoped with a maximum hop count, typically two or three hops, and a bounded time window, keeping each individual query fast (typically well under a hundred milliseconds) even though the underlying graph itself may contain many millions of nodes and edges.
7.4 Only a Small Fraction of Traffic Reaches the Expensive Path
Just as earlier tutorials in this series rely on caching to ensure only a small fraction of requests reach the slowest, most expensive layer, this system relies on the Rule Engine’s fast threshold checks to ensure only a small fraction of transactions — typically well under one percent — ever trigger the more computationally expensive graph query and ML scoring steps. This means the vast majority of the millions-per-minute event volume flows through the cheap, purely additive rolling aggregate update, with the heavier analysis reserved for genuinely promising candidates.
7.5 Capacity Planning With Real Numbers
At a sustained rate of 16,700 events per second, with peaks toward 50,000, the Kafka Event Bus — partitioned appropriately across many brokers — comfortably handles this throughput, since Kafka is specifically designed for exactly this kind of high-volume, ordered event streaming. The Real Time Feature Engine’s Flink cluster is sized based on per-partition throughput, typically a few thousand events per second per processing slot, meaning a cluster of a few dozen to a few hundred slots comfortably covers peak load, scaled elastically as traffic patterns vary throughout the day. The Graph Database and ML Scoring Service, receiving only the small filtered fraction of flagged candidates, need to sustain a far lower query rate — often only tens to low hundreds of queries per second even at peak — a comparatively light load given the expensive nature of each individual query.
“What would you do if the Real Time Feature Engine started falling behind the incoming event rate — a scenario called consumer lag?” A strong answer discusses adding more Flink task slots and Kafka partitions to increase parallelism, monitoring consumer lag explicitly as a first-class metric, and, as a last resort, prioritising certain event types or accounts if the system must temporarily shed load, since silently falling behind on this specific system risks genuinely missing a laundering pattern as it happens, not just a minor user experience delay.
7.6 A Tiered Approach to Managing Load Under Extreme Spikes
During genuinely extreme traffic events — such as a platform-wide surge well beyond normal peak — it can be useful to design the system with graceful, tiered degradation rather than a single all-or-nothing failure mode. The cheapest, most essential tier — ingesting and durably persisting every transaction event to Kafka and the Data Lake — must never be sacrificed, since this is the permanent record the Batch Pattern Mining Service can always fall back to later. The next tier — updating rolling aggregates in the Feature Store — should be prioritised to stay as close to real time as possible, since this feeds the fastest-acting detection path. The most expensive tier — graph queries and ML scoring for flagged candidates — can, if genuinely necessary under extreme load, tolerate a brief, bounded processing delay measured in minutes without materially undermining the system’s overall effectiveness, since the underlying event data is never lost and can always be caught up once load subsides.
High Availability and Reliability
A pattern that goes undetected due to a system outage is not a minor inconvenience; it can mean a genuine regulatory failure and real financial crime going unnoticed, so this system is built for continuous, reliable operation.
8.1 Redundancy at Every Layer
Every stateless service runs multiple replicas across multiple availability zones. Kafka, Flink, Neo4j, and the Case Database all run in clustered, replicated configurations, so the loss of any single node does not interrupt the continuous flow of transaction monitoring.
8.2 Exactly-Once Processing Guarantees
Since this system’s entire purpose is accurate aggregate counting, it is important that a transaction event is neither lost nor double-counted — even across a service restart or a brief network partition. The Real Time Feature Engine uses Flink’s checkpointing mechanism, which periodically saves a consistent snapshot of all in-flight aggregation state, combined with Kafka’s exactly-once processing semantics, ensuring that a restart resumes exactly where processing left off, without either skipping events or replaying them and inflating counts.
8.3 Graceful Handling of Downstream Slowness
If the Graph Database or ML Scoring Service becomes temporarily slow or unavailable, flagged candidates are placed into a durable retry queue rather than being dropped, ensuring that a temporary downstream issue causes a delay in alert creation, never a silent loss of a genuinely suspicious pattern.
8.4 Disaster Recovery
The Data Lake, being the permanent, authoritative record of all transaction history, is replicated across regions and retained according to regulatory requirements — often several years. In the event of a full regional outage affecting the real-time pipeline, the Batch Pattern Mining Service can, once service is restored, re-process the affected time window from the durable Data Lake, ensuring no pattern is permanently missed due to a temporary infrastructure failure.
8.5 Testing Reliability on Purpose
Given the regulatory stakes, teams operating this kind of system run regular, deliberate tests injecting known synthetic laundering patterns — using clearly marked test accounts — into a staging environment that mirrors production, verifying end to end that the pipeline correctly detects them within an expected time window, rather than only trusting that the individual components work correctly in isolation.
“How would you know if the detection pipeline had a silent bug that was causing it to miss real patterns, given that you cannot simply wait for a regulator to tell you?” A strong answer proposes maintaining a library of known historical laundering pattern examples, replaying them regularly through the pipeline as a continuous integration test, and closely monitoring the overall alert volume trend over time for unexplained drops — which, combined with the exactly-once processing guarantees, gives meaningful, ongoing confidence that the pipeline remains healthy.
Security
This system handles some of the most sensitive data in the entire organisation — complete transaction histories and active law-enforcement-adjacent investigations — and security must reflect that sensitivity.
9.1 Strict Access Control
Access to case data, raw transaction histories, and the graph database is tightly scoped through role-based access control, limited specifically to compliance analysts and authorised systems, with every single access logged for audit purposes, since even internal, unauthorised browsing of this data represents a serious policy and, in many cases, legal violation.
9.2 Protecting the Detection Logic Itself
The specific thresholds and rules used for detection are themselves sensitive; if leaked, they would give bad actors a precise playbook for evading detection. Access to the Rule Engine’s configuration and the ML model’s exact feature weights is restricted to a small, trusted group, separate from the broader engineering organisation’s usual access patterns for less sensitive systems.
9.3 Data Retention and Privacy Compliance
Transaction and case data is subject to strict, often lengthy, regulatory retention requirements, while simultaneously needing to respect data privacy regulations governing personal financial information. The Data Lake and Case Database implement clear, automated retention and deletion policies aligned with applicable regulations in each jurisdiction the platform operates in, which can genuinely differ from one country to another.
9.4 Encryption and Audit Trails
All data is encrypted both in transit and at rest, and every action taken on a case — from creation through analyst review to final SAR filing — is recorded in an immutable audit trail, since regulators may require a complete, tamper-evident record of exactly how and when a suspicious pattern was identified and handled.
9.5 Insider Threat Considerations
Because this system’s purpose is specifically to detect illicit financial activity, it must also be resilient against an insider — someone with legitimate system access — attempting to suppress or delete evidence of a genuine pattern. Alert creation and case data are designed to be append-only and tamper-evident, so that even a user with elevated access privileges cannot quietly make a legitimate alert disappear without leaving a clear, auditable trace.
“How would you prevent someone with legitimate administrative access from quietly deleting or altering an alert to cover up suspicious activity?” A strong answer describes an append-only audit log architecture, where alerts and their status changes are never truly deleted or overwritten, only appended to, combined with separation of duties, so no single role has both the ability to create and to permanently erase case records without independent review.
9.6 Explainability as a Security and Compliance Requirement
It is worth treating explainability itself as a security-adjacent requirement, not merely a nice-to-have feature. When the ML Scoring Service flags an account as high risk, both the human analyst and, potentially, a regulator reviewing the platform’s compliance program afterward, need to understand which specific signals drove that score — not just trust an opaque number. This is why the system captures and stores the underlying rule triggers, network context, and key contributing features alongside every alert, not just the final risk score itself, ensuring that every automated decision remains genuinely explainable and defensible long after the moment it was made — which is essential both for maintaining analyst trust in the system and for satisfying regulatory expectations around explainable, auditable decision-making in automated financial compliance systems.
Monitoring, Logging and Metrics
Given that a silent failure here could mean genuinely missed criminal activity, monitoring must be especially thorough and specifically tuned to this system’s unique risks.
10.1 Key Metrics to Track
Consumer Lag
How far behind the Real Time Feature Engine is from the live event stream — a direct signal of whether detection is happening close to real time or falling dangerously behind.
Alert Volume Trend
Tracked over time and compared against historical baselines, since an unexplained sudden drop can indicate a silent pipeline failure rather than an actual decrease in suspicious activity.
False Positive Rate
The proportion of alerts analysts ultimately close as legitimate activity — an important signal for tuning rule thresholds and ML model calibration over time.
Case Aging
How long alerts sit in the analyst review queue before being addressed, important both operationally and for regulatory timeliness requirements.
Graph Query Latency
Since this is one of the more computationally expensive steps in the pipeline, watched closely to catch performance degradation before it affects detection speed.
SAR Filing Cadence
How many Suspicious Activity Reports are actually filed per week or month, compared against historical baseline — a downstream health signal for both the pipeline and the analyst review process.
10.2 Distributed Tracing
A trace ID follows each transaction event through ingestion, feature computation, rule evaluation, and, where applicable, graph analysis and scoring — letting engineers and even compliance analysts investigating a specific alert see the complete, precise evidence trail that led to its creation.
10.3 Structured, Immutable Logging
Every service emits structured logs, and, given the audit trail requirements discussed in the security section, case-related events are additionally written to a dedicated, append-only audit log, separate from general application logs, since these specifically need to be retained and remain unalterable for potentially many years.
10.4 Alerting and Service Level Objectives
A reasonable SLO for this system might state that consumer lag stays under two minutes during normal operation, and that alert volume does not deviate more than a defined percentage from its trailing thirty-day baseline without an identified, explained cause. Alerts fire immediately if consumer lag grows unexpectedly, or if alert volume drops sharply and unexpectedly, since both are strong, early signals that something in the pipeline may not be functioning correctly.
10.5 Dashboards Built for Different Audiences
An engineering dashboard tracks pipeline health, latency, and consumer lag — the detail needed to diagnose a technical issue. A compliance-and-risk-facing dashboard tracks alert volume, case aging, false positive rate, and SAR filing statistics over time, giving compliance leadership and, where required, regulators, clear visibility into how effectively the system is operating, separate from its underlying technical implementation.
“Why would a sudden, unexplained drop in alert volume be treated as seriously as a spike in errors elsewhere in the system?” A strong answer explains that unlike most systems, where fewer alerts might simply mean things are going well, in this specific system a sharp, unexplained drop is just as likely to indicate a silent pipeline failure — such as a broken consumer or a misconfigured rule — quietly causing genuine suspicious activity to go undetected, which is precisely the failure mode this entire system exists to prevent.
Deployment and Cloud
All services are packaged as containers and orchestrated with Kubernetes, with deployment practices reflecting the regulatory sensitivity of this system.
11.1 Careful, Gradual Rollouts for Detection Logic
Changes to the Rule Engine’s thresholds or the ML Scoring Service’s model are rolled out using a shadow deployment strategy: the new logic runs in parallel with the existing production logic, generating its own candidate alerts for comparison, without those candidate alerts actually being surfaced to analysts yet — allowing the team to measure the impact on alert volume and precision before fully switching over. This matters because an overly aggressive change could either flood analysts with false positives or, worse, silently suppress genuine detections.
11.2 Auto-Scaling the Streaming Layer
The Flink cluster’s parallelism, and the number of Stream Ingestion Service replicas, scale based on observed event throughput and consumer lag, allowing the system to absorb both predictable daily transaction volume patterns and unexpected spikes without falling behind.
11.3 Regional Deployment and Data Residency
Given strict, often country-specific regulatory requirements around where financial transaction data may be stored and processed, this system is often deployed with careful attention to data residency — sometimes requiring separate, regionally isolated deployments rather than a single, globally shared instance, unlike some of the other systems in this tutorial series that can more freely operate in an active-active multi-region configuration.
11.4 Infrastructure as Code
All infrastructure, including the Kafka, Flink, Neo4j, and database clusters, is defined in code using tools such as Terraform, ensuring every change is reviewable and reproducible — which matters particularly here given the compliance and audit obligations placed on this specific system.
“Why might a shadow deployment be especially important for changes to the Rule Engine or ML model, compared to a typical canary rollout used elsewhere?” A good answer notes that a bad canary rollout in most systems is quickly visible through error rates or customer complaints, but a detection-logic bug that silently suppresses true positives produces no obvious error signal at all; shadow deployment, comparing the new logic’s output against the existing production logic side by side before it ever affects real alerting, is specifically designed to catch this otherwise invisible failure mode.
Databases, Caching and Load Balancing
12.1 Why a Graph Database for Network Analysis
We chose Neo4j specifically because the core analytical question this system needs to answer repeatedly — “how are these accounts connected, and through what kind of pattern” — is fundamentally a graph traversal problem. Graph databases store relationships as first-class entities and are optimised for efficiently walking these connections to arbitrary depth, a capability that would require increasingly complex and slow multi-way joins in a traditional relational database as the relevant relationship depth grows.
12.2 Why Redis for the Feature Store
The Feature Store needs to support extremely high-throughput reads and writes of small, frequently updated values — exactly Redis’s core strength, as seen in other tutorials throughout this series. Rolling behavioural aggregates are compact, bounded in size, and need sub-millisecond access, making Redis a natural fit — distinct from the Graph Database’s role, which is reserved for the comparatively rarer, deeper relationship queries.
12.3 Why PostgreSQL for Case Management
Case and investigation data benefits from PostgreSQL’s strong consistency guarantees and rich support for structured, relational queries — such as “show me all open cases assigned to this analyst, sorted by risk score,” a query pattern that is a natural fit for a relational database, distinct from the network-shaped queries the Graph Database handles.
12.4 Object Storage for the Data Lake
The complete, immutable transaction history is stored in an object storage cluster, chosen for its ability to hold enormous, ever-growing volumes of historical data cost-effectively, serving the Batch Pattern Mining Service’s periodic, large-scale re-analysis without needing to keep years of raw transaction data in more expensive, latency-optimised storage.
12.5 Load Balancing Strategy
The same two-tier load balancing approach used throughout this tutorial series applies to the ingestion path: a Global Load Balancer routes to the nearest healthy region, and a Regional Load Balancer distributes traffic across Stream Ingestion Service replicas, ensuring ingestion itself — the entry point for every downstream analysis — remains fast and highly available even under peak transaction volume.
12.6 A Quick Side-by-Side of the Four Stores
| Store | Technology | Primary Workload | Access Pattern |
|---|---|---|---|
| Feature Store | Redis Cluster | Rolling behavioural aggregates per account | Very high-throughput small read+write per transaction event |
| Graph Database | Neo4j Cluster | Transaction network of accounts and transfers | Bounded, multi-hop graph traversal for flagged candidates only |
| Case Database | PostgreSQL Cluster | Alerts, investigations, analyst decisions | Structured relational queries, strong consistency, audit-safe |
| Data Lake | Object Storage | Full immutable transaction history | Large-scale scans for batch analysis and long-term retention |
“Could you use a single database technology for everything here instead of four different specialised systems?” A thoughtful answer explains that this system deliberately embraces polyglot persistence because its workloads are genuinely different in shape: high-throughput small-value updates, deep relationship traversal, structured transactional case records, and massive-scale historical batch analysis each have different optimal storage engines, and forcing all of them into one general-purpose database would meaningfully sacrifice performance somewhere in this pipeline.
12.7 Keeping the Graph Database Bounded and Manageable
Left unmanaged, a transaction graph capturing every account and every transaction across a large platform’s entire history would grow to an enormous, unwieldy size — making even well-scoped queries progressively slower over time. In practice, the Graph Database typically retains only a rolling window of the most recent relationship history, commonly ranging from ninety days to a year depending on regulatory and detection requirements, with older relationship data archived to the Data Lake, accessible to the Batch Pattern Mining Service for deeper historical analysis when specifically needed, but not kept live in the graph indefinitely. This keeps the graph’s working size manageable and query performance predictable, while still preserving the complete underlying history for the cases — thankfully rare — where a genuinely long-horizon investigation requires looking further back than the live graph’s rolling window covers.
APIs and Microservices
13.1 The Transaction Ingestion API
Request Body:
{
  "transactionId": "TXN-991823",
  "senderAccountId": "ACC-5001",
  "receiverAccountId": "ACC-6002",
  "amountCents": 920000,
  "currency": "INR",
  "timestamp": "2026-08-03T10:15:00Z"
}

Response Body:
{
  "status": "ACCEPTED",
  "transactionId": "TXN-991823"
}
13.2 The Case Query API for Analysts
Response Body:
{
  "cases": [
    {
      "caseId": "CASE-4471",
      "riskScore": 0.92,
      "patternType": "STRUCTURING",
      "involvedAccounts": ["ACC-5001", "ACC-5002", "ACC-5003"],
      "createdAt": "2026-08-03T10:20:00Z"
    }
  ]
}
13.3 Internal Service Contracts
Internal services communicate over a combination of Kafka event streams for the high-throughput ingestion and feature computation path, and gRPC for lower-volume, synchronous calls such as the Rule Engine querying the Graph Database or ML Scoring Service — matching each internal communication pattern to the tool best suited for its specific throughput and latency characteristics.
13.4 Why Microservices Fit This Problem
Separating ingestion, feature computation, rule evaluation, graph analysis, ML scoring, and case management allows each to scale and evolve on its own schedule. The ML Scoring Service, for example, might be updated frequently as new models are trained, while the core ingestion path — being the most latency-critical and highest-throughput component — changes far more conservatively, and this separation lets each team responsible for a given piece move at the pace appropriate to its own risk and iteration profile.
“Should the transaction ingestion API be synchronous — waiting for the full detection pipeline to complete before responding — or asynchronous?” A strong answer firmly favours asynchronous: the ingestion API should acknowledge receipt quickly and let the detection pipeline process the event independently, since waiting for a potentially multi-step, graph-query-involving detection pipeline to complete synchronously would introduce unacceptable latency into the ingestion path, which many other systems — including the payment systems covered elsewhere in this tutorial series — depend on remaining fast.
Design Patterns and Anti-patterns
14.1 Patterns Used
Lambda Architecture
Combining a fast real-time streaming path with a slower, more thorough batch path, each catching patterns the other structurally cannot — the central architectural pattern of this entire tutorial.
Event Sourcing
The Kafka Event Bus and Data Lake together preserve the complete, immutable history of every transaction event, allowing both real-time processing and, if needed, complete historical reprocessing with improved detection logic.
Sliding Window Aggregation
The Real Time Feature Engine’s core technique for maintaining bounded, incrementally updated behavioural summaries without ever needing to scan full history on each new event.
Graph Traversal for Network Analysis
Using a purpose-built graph database to answer relationship-shaped questions that would be awkward and slow to express in a traditional relational schema.
Human-in-the-Loop Review
Automated detection surfaces prioritised candidates, but final judgment and regulatory filing decisions remain with trained human analysts — both for accuracy and for legal accountability reasons.
Polyglot Persistence
Four different storage engines — Redis, Neo4j, PostgreSQL and object storage — each chosen for the specific workload it best serves, rather than forcing everything into one general-purpose database.
14.2 Anti-patterns to Avoid
Isolated Transaction Evaluation
The single most fundamental anti-pattern this entire tutorial addresses; any detection approach that never considers aggregate, cross-transaction context will structurally miss the patterns this system exists to find.
Static, Unchanging Thresholds
Publishing or effectively exposing exact, unchanging detection thresholds allows sophisticated actors to simply structure their activity to stay just below them; thresholds and rules need to evolve and incorporate some deliberate variability over time.
Ignoring False Positive Feedback
Failing to feed analyst false-positive decisions back into rule tuning and model retraining wastes valuable signal and leads to steadily worsening analyst experience and alert fatigue over time.
Unbounded Graph Traversal
Allowing graph queries with no hop limit or time window risks extremely slow, resource-intensive queries on a large, densely connected transaction network, degrading the whole system’s responsiveness.
Deleting Alert History
As discussed in the security section, this undermines the auditability and legal defensibility that is fundamental to this system’s entire regulatory purpose.
“If a compliance team asked you to lower the alert volume because analysts are overwhelmed, what would be your first instinct, technically?” A strong answer resists the simplistic instinct of just raising thresholds across the board — which risks missing genuine patterns — and instead proposes improving risk-based prioritisation, so analysts see the highest-confidence, highest-risk cases first, combined with using false-positive feedback to retrain and better calibrate the ML Scoring Service, addressing the underlying precision problem rather than simply suppressing volume indiscriminately.
Best Practices and Common Mistakes
15.1 Best Practices
- Always reason about aggregate, cross-transaction behaviour — never rely solely on evaluating individual transactions in isolation.
- Combine fast, transparent rule-based detection with slower, more nuanced ML scoring and network analysis, rather than relying on only one approach.
- Keep detection thresholds and models under strict access control, and evolve them deliberately over time rather than treating them as fixed and permanent.
- Feed analyst decisions — both confirmed and false positive — back into the system continuously to improve precision over time.
- Maintain an append-only, tamper-evident audit trail for every alert and case decision, given the regulatory and legal weight this data carries.
- Continuously test the pipeline against known synthetic laundering patterns, not just individual component unit tests.
15.2 Common Mistakes
- Building only single-transaction fraud-style rules and assuming they are sufficient for money laundering detection, missing the entire category of aggregate, network-based patterns.
- Allowing graph queries to run unbounded, causing severe performance degradation as the transaction network grows over time.
- Treating a drop in alert volume as automatically good news, without investigating whether it reflects a genuine improvement or a silent pipeline failure.
- Failing to separate the real-time and batch paths clearly, leading to a system that is either too slow for fast-forming patterns or too shallow for slow, complex ones.
- Under-resourcing the human analyst review process relative to the volume of alerts the automated system generates, undermining the entire pipeline’s practical effectiveness regardless of how well the detection logic itself performs.
15.3 A Pre-Launch Readiness Checklist
| Check | Question to Confirm Before Launch |
|---|---|
| Synthetic Patterns | Do known synthetic laundering patterns get detected within the expected time window? |
| Monitoring | Are consumer lag and alert-volume monitoring, with appropriate alerting thresholds, actively running — not just built and forgotten? |
| Access Control | Have access controls on case data and detection logic configuration been reviewed and confirmed as appropriately restrictive? |
| Audit Trail | Is the audit trail for alert and case lifecycle events genuinely append-only, and has that property been verified? |
| Analyst Capacity | Has the analyst team’s expected case load been sized against realistic projected alert volume before launch, not discovered afterward? |
| Compliance Sign-off | Have legal and compliance stakeholders formally reviewed and signed off on the specific rule thresholds and model behaviour being deployed? |
Before launching or significantly changing this system, experienced teams confirm each item above. It is also worth remembering that this close, ongoing collaboration between engineering and compliance is, in many ways, as important to this system’s ultimate success as any individual technical design decision covered throughout this tutorial, and it is worth carrying that lesson forward into how any team approaches building or operating a system like this in practice.
“If you could only add one automated test to this system, what would it be?” A strong candidate answer is a synthetic pattern replay test: injecting a known, previously confirmed laundering pattern — structured to closely resemble real historical cases — through the full pipeline in a staging environment and asserting that it is correctly detected within the expected time window, since this directly validates the entire end-to-end detection capability this system exists to provide, not just individual component correctness.
Real-World Industry Examples
Major Banks and Financial Institutions
Large banks operate dedicated transaction monitoring systems, often combining rule-based and machine learning approaches, precisely to meet regulatory obligations around detecting and reporting suspicious activity, with many having faced significant regulatory penalties historically for gaps in this exact kind of monitoring capability — underscoring why this system is treated as a serious, non-negotiable investment rather than an optional feature.
Digital Payment Platforms and Fintechs
As digital payment platforms and fintech companies have grown to process enormous transaction volumes, many have built or adopted transaction monitoring systems following broadly the same architectural principles covered in this tutorial — combining streaming behavioural analysis with graph-based network detection — since the fundamental challenge, aggregate patterns hidden across individually legitimate transactions, is identical regardless of whether the platform is a traditional bank or a newer digital-first payment company.
Cryptocurrency Exchanges
Cryptocurrency exchanges face a particularly acute version of this challenge, since blockchain transactions are inherently public and traceable, making network-based analysis — very similar to the graph traversal techniques covered in this tutorial — an especially natural and heavily used fit for detecting laundering patterns across wallet addresses and exchange accounts.
Government Financial Intelligence Units
National financial intelligence units — the government bodies that receive Suspicious Activity Reports from banks and payment platforms — themselves run large-scale pattern analysis across reports submitted from many different institutions, looking for coordinated activity that might span multiple platforms: an even larger-scale version of exactly the network analysis problem this tutorial’s Graph Database component addresses within a single organisation.
Financial institutions regularly publish, in regulatory filings and industry reports, statistics on the number of Suspicious Activity Reports filed annually — often in the hundreds of thousands across the industry — giving a concrete sense of the real, ongoing scale at which systems like the one described in this tutorial operate in production every single day.
FAQ, Summary and Key Takeaways
The most common questions that arise when engineers first approach this design — followed by a compact summary of everything the tutorial has covered, and the six ideas most worth carrying forward.
Generally no; this system is primarily an investigative and reporting tool operating alongside the payment path, not inside it, since most laundering patterns can only be confirmed by looking at aggregate behaviour after the fact. That said, in some jurisdictions and for certain very high-confidence real-time signals, a platform may choose to hold or review a specific transaction pending investigation.
Fraud detection typically focuses on protecting the platform and its customers from a single bad actor’s harmful individual transaction, such as a stolen card being used, while this system focuses on detecting patterns of financial activity, often across many individually valid transactions, that suggest an attempt to disguise the origin of funds — a related but distinct problem requiring different techniques, particularly the aggregate and network analysis covered throughout this tutorial.
Regulatory thresholds are typically set by law or regulation, not something a platform can simply adjust on its own, and even if it could, sophisticated actors would likely adapt their structuring amounts accordingly — this is precisely why detection must rely on aggregate behavioural and network patterns rather than any single fixed threshold value.
This is exactly why the ML Scoring Service incorporates an account’s own long-term behavioural baseline, rather than applying a single universal threshold to everyone; a small business account with a consistent, years-long history of frequent transactions looks very different in its established baseline pattern than an account with no prior history suddenly beginning to receive many near-threshold deposits from unrelated senders.
For patterns detectable by the real-time streaming path, typically within minutes of the pattern crossing its defining threshold, since the Real Time Feature Engine updates continuously as each transaction arrives. For the slower, more complex patterns only detectable by the Batch Pattern Mining Service’s deeper historical analysis, detection latency is naturally longer, often measured in hours, reflecting the genuinely greater computational depth required to uncover them.
This is a genuine, ongoing challenge rather than a fully solved problem; it is precisely why the system layers multiple independent signal types — rule thresholds, network position, and behavioural baseline anomaly — together, since evading every single layer simultaneously is considerably harder than evading any one detection mechanism in isolation, and it is also why continuous model retraining and threshold evolution, discussed in the best practices section, remain an ongoing, permanent part of operating this system rather than a one-time setup task.
17.1 Summary
Money laundering detection is fundamentally different from single-transaction fraud detection because the signal exists in aggregate behaviour across many transactions and across a network of related accounts — not in any single event. This tutorial has walked through a Lambda-style hybrid architecture that combines a fast, real-time streaming path (Kafka + Flink + Redis + Rule Engine) with a deeper batch path (Data Lake + Spark) and network analysis (Neo4j), coordinated by an ML Scoring Service and a human-in-the-loop Case Management workflow. Each layer has been chosen for the specific shape of the workload it handles: rolling aggregates in Redis, graph traversal in Neo4j, structured investigation records in PostgreSQL, and immutable historical retention in object storage. Security, monitoring, and deployment practices have been designed around the reality that a silent failure here is not just an outage but a compliance incident: append-only audit trails, shadow deployments for detection logic, alert-volume monitoring, and synthetic-pattern replay tests all exist because this system must not merely be correct today, but must remain provably correct over years of adversarial pressure.
Key Takeaways
- Money laundering patterns are, by design, invisible in any single transaction; detection fundamentally requires reasoning about aggregate behaviour across time and across a network of related accounts.
- A combined real-time streaming and batch architecture, following the Lambda architecture pattern, is necessary to catch both fast-forming and slower, more complex patterns.
- Graph databases are uniquely well suited to detecting network-shaped patterns like layering and smurf rings, which relational databases handle far less naturally.
- Combining transparent, explainable rules with ML-based risk scoring balances regulatory auditability with the ability to catch subtler patterns rules alone would miss.
- Given the regulatory and legal stakes, this system demands especially strong audit trails, access controls, and continuous testing against known patterns, beyond what many other systems in this tutorial series require.
- Human analyst review remains an essential, non-automatable final step, both for accuracy and for legal accountability in the ultimate decision to file a Suspicious Activity Report.
This design gives a payment platform or financial institution the ability to see the sandcastle, not just the individual grains of sand — catching sophisticated patterns deliberately built to hide within the enormous, continuous flood of otherwise completely legitimate transaction activity. Achieving this requires a genuinely different architectural mindset than the single-request, single-transaction systems covered elsewhere in this tutorial series, embracing streaming aggregation, graph analysis, and batch pattern mining as first-class citizens, working together, rather than trying to force this fundamentally aggregate, relational problem into a single-transaction request-response model that was never designed to see the larger pattern in the first place.
For anyone approaching this as a system design interview question, the strongest signal is recognising early that this is not simply a scaled-up version of a single-transaction fraud check, but a categorically different kind of problem — one that requires reasoning about time, aggregation, and network relationships as first-class architectural concerns from the very beginning. Candidates who jump straight to “add more servers” without first identifying that the core challenge is behavioural and relational, not purely computational, tend to miss the heart of what makes this problem genuinely interesting, and genuinely important, both as an engineering challenge and as a real safeguard protecting the financial system from serious criminal misuse.
Great money laundering detection systems are not built by trying to make individual transactions smarter — they are built by giving the whole system a memory that stretches across time and across the network of accounts, so it can finally see the shape of what a single moment could never reveal on its own.

