The Three Pillars of Observability
Metrics, logs, and traces — three different lenses on the same running system. This is a beginner-to-production tour of what each one is, why it exists, how it works internally, and how companies like Netflix, Uber, Google, and Amazon use them together to understand systems no single engineer can fully hold in their head.
Almost every incident you will ever be paged for lives at the intersection of three signals: an aggregate that shifted, a request that failed, and a hop that took too long. This guide walks the three pillars — metrics, logs, and traces — from their origin in control theory all the way to a modern OpenTelemetry stack.
Introduction & History
From SSH-ing into a single server to reconstructing incidents across hundreds of services — the shift that made observability essential.
Imagine you are the only doctor in a small village. When someone falls sick, you can visit their home, ask questions, check their temperature, listen to their heartbeat, and figure out what's wrong. You know every patient personally. This works fine — until the village becomes a city of ten million people, with thousands of clinics, and patients who cannot tell you exactly what's wrong because they don't speak your language. You can no longer visit everyone. You need instruments: thermometers everywhere reporting temperature trends (metrics), medical records describing exactly what happened during each visit (logs), and a system that can trace a single patient's journey through every clinic, lab, and specialist they visited (traces). This is exactly the transition that software went through, and it's why observability and its three pillars — metrics, logs, and traces — became essential.
In the early days of software, most applications were monoliths — a single deployable unit running on one or a handful of servers. If something broke, an engineer could SSH into the server, tail a log file, and usually find the problem within minutes. This approach is often called monitoring: watching a known set of signals (CPU usage, memory, a handful of log files) for a known set of problems.
Then came the shift to distributed systems and microservices in the 2010s. A single user request to, say, Netflix's homepage might touch 20-30 different backend services: authentication, recommendations, video catalog, billing, personalization, and more — each owned by a different team, each deployed independently, each capable of failing in ways nobody anticipated. Traditional monitoring — built for known failure modes on a handful of machines — stopped being enough. Engineers needed a way to ask new questions about a system's internal state, without having to predict those questions in advance and instrument for them beforehand. That capability is what we now call observability.
The term itself borrows from control theory, a branch of engineering. In control theory, a system is “observable” if you can infer its internal state purely from its external outputs. Twitter engineer and observability pioneer Cindy Sridharan, along with companies like Honeycomb, Google, and Twitter, popularized this idea for software systems around 2016-2018, framing it around three categories of telemetry data that, together, let engineers reconstruct what happened inside a system after the fact: metrics, logs, and traces — the so-called “three pillars of observability.”
Real-life analogy
Think of a commercial airplane's black-box recorders. A flight data recorder logs numeric readings every second (altitude, speed, fuel — like metrics). A cockpit voice recorder captures exactly what was said and when (like logs). And air traffic control radar tracks the plane's exact path from takeoff to landing across every checkpoint (like a trace). Investigators use all three together to reconstruct exactly what happened — no single recorder tells the whole story alone.
Today, observability is a foundational discipline in software engineering, as important as testing or security. Nearly every production system at scale — from a five-person startup's API to Amazon's global fulfillment network — relies on some combination of metrics, logs, and traces to stay operable.
The Problem & Motivation
Why three pillars, not one? Because each answers a fundamentally different kind of question.
Why do we need three separate pillars instead of just one great logging system? Because each pillar answers a fundamentally different kind of question, and no single one can answer all of them efficiently.
2.1 · THE CORE PROBLEM: “UNKNOWN UNKNOWNS”
Traditional monitoring is good at answering known unknowns — questions you thought of in advance, like “is CPU usage above 80%?” You build a dashboard, set a threshold alert, and you're covered.
But distributed systems fail in ways nobody predicted. A cache eviction policy interacting badly with a retry storm during a regional failover, triggered only when three specific services deploy within the same hour — nobody writes an alert for that in advance. These are unknown unknowns. Observability's promise is that if you've captured rich enough telemetry (metrics + logs + traces), you can answer any question about your system's behavior after the fact, even ones you never anticipated, without shipping new code.
You run a small blog. One day, page loads feel slow. With just a “requests per second” metric, you know traffic is normal — so why is it slow? You check the logs and see a spike of “connection timeout” errors from your database. Metrics told you something is wrong; logs told you what. That's the core motivation for having more than one pillar.
2.2 · WHY A SINGLE PILLAR ISN'T ENOUGH
| Question | Best answered by |
|---|---|
| Is the system healthy right now, in aggregate? | Metrics |
| What exactly happened for this one specific request/user? | Logs |
| Which service in a chain of 12 services caused the slowdown? | Traces |
Metrics are cheap to store and query but lack detail — they tell you “error rate is 5%” but not which requests failed or why. Logs are rich in detail but expensive to store at scale and hard to correlate across services. Traces show you the causal path of a single request across services but don't summarize system-wide health. You need all three, working together, to go from “something is wrong” to “here is exactly why.”
2.3 · THE BUSINESS COST OF POOR VISIBILITY: MTTR
Engineering organizations track a metric called MTTR (Mean Time To Resolution / Recovery) — the average time between an incident starting and it being fully resolved. Every minute of MTTR has a real cost: lost revenue during an e-commerce outage, lost trust when a banking app goes down, or lost rides when a dispatch system stalls. Observability directly attacks MTTR by shrinking two of its biggest components:
- Time to detect: How long between a problem starting and someone noticing? Good metrics and alerting shrink this from hours (a customer complaint) to seconds (an automated alert).
- Time to diagnose: How long between noticing a problem and understanding its root cause? Correlated traces and logs shrink this from hours of manual log-grepping across a dozen servers to minutes of following a single trace.
Industry surveys of high-performing engineering teams (such as the annual DORA / State of DevOps research) consistently find that organizations with mature observability practices recover from incidents dramatically faster than those relying on ad hoc debugging — turning observability from a “nice to have” into a measurable competitive advantage.
2.4 · PRODUCTION EXAMPLE: UBER'S DISPATCH SYSTEM
Consider Uber matching riders to drivers. A metric might show that match latency in Mumbai spiked to 4 seconds at 6:05 PM. That tells the on-call engineer that something broke. Distributed traces for individual match requests during that window would reveal that the spike came specifically from the “surge pricing calculation” service taking too long. Logs from that specific service would then reveal the exact error: a downstream geospatial index rebuild that was consuming too much CPU. Metrics found the “when,” traces found the “where,” and logs found the “why” — this three-step funnel is the everyday reality of debugging production systems in a microservices architecture.
Core Concepts: The Three Pillars Explained
Metrics, logs, and traces — with beginner and production examples for each, plus the log-level ladder that keeps volumes sane.
Let's now define each pillar precisely, with beginner and production examples for each.
Metrics
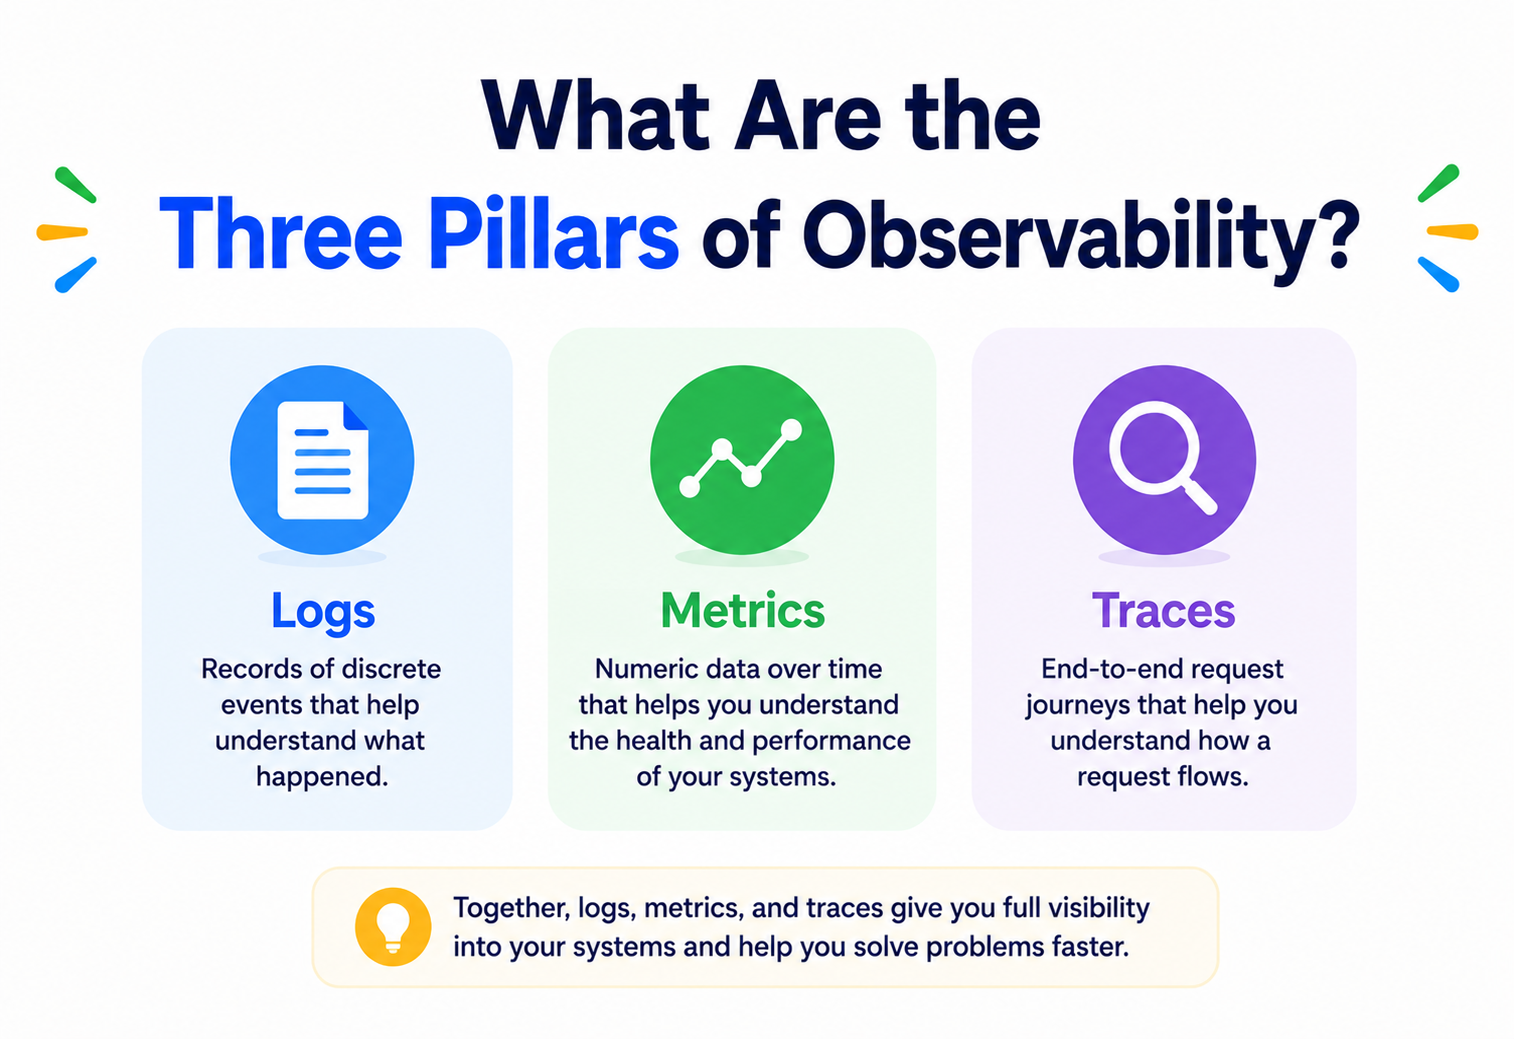
Numeric measurements collected over time, usually aggregated (counters, gauges, histograms). Cheap to store, fast to query, ideal for dashboards and alerting.
Logs
Timestamped, immutable records of discrete events, often with rich context (structured fields, stack traces, request IDs). Ideal for deep, event-level investigation.
Traces
A record of a single request's journey across services, broken into “spans” that show where time was spent. Ideal for pinpointing bottlenecks in distributed calls.
3.1 · METRICS — THE VITAL SIGNS
A metric is a numeric value measured at a point in time and stored as a time series — a sequence of (timestamp, value) pairs. Metrics are typically pre-aggregated: instead of storing every raw event, a metric might represent “the count of HTTP 500 responses in the last 10 seconds,” compressed into a single number.
- What: A number that changes over time, like requests-per-second, memory usage, or error rate.
- Why: Cheap to store and query even at massive scale; ideal for real-time dashboards and threshold-based alerts.
- Where: Collected by libraries like Micrometer (Java), Prometheus client libraries, or StatsD, and stored in time-series databases like Prometheus, InfluxDB, or CloudWatch Metrics.
- Analogy: A car's dashboard — speed, fuel level, engine temperature. You glance at it and instantly know if something's off, without knowing exactly why yet.
- Beginner example: A counter tracking “number of times the login button was clicked today.”
- Production example: Netflix tracks stream-start success rate as a metric across every device type, region, and CDN edge node, alerting automatically if it drops below 99.5% for more than two minutes.
3.1.1 · TYPES OF METRICS
| Type | Description | Example |
|---|---|---|
| Counter | Monotonically increasing value, only goes up (or resets to 0) | Total HTTP requests served |
| Gauge | A value that can go up or down | Current number of active connections |
| Histogram | Distribution of values into configurable buckets | Request latency distribution |
| Summary | Similar to histogram, but computes quantiles client-side | p50 / p95 / p99 latency |
3.1.2 · JAVA EXAMPLE — EMITTING A METRIC WITH MICROMETER
@RestController
public class OrderController {

    private final Counter orderCounter;
    private final Timer orderProcessingTimer;

    public OrderController(MeterRegistry registry) {
        // Counter: total orders placed
        this.orderCounter = Counter.builder("orders.placed.total")
                .description("Total number of orders placed")
                .tag("service", "order-service")
                .register(registry);

        // Timer: how long order processing takes (a histogram under the hood)
        this.orderProcessingTimer = Timer.builder("orders.processing.duration")
                .description("Time taken to process an order")
                .register(registry);
    }

    @PostMapping("/orders")
    public ResponseEntity<OrderResponse> placeOrder(@RequestBody OrderRequest request) {
        return orderProcessingTimer.record(() -> {
            orderCounter.increment();
            OrderResponse response = orderService.process(request);
            return ResponseEntity.ok(response);
        });
    }
}
3.2 · LOGS — THE DETAILED DIARY
- What: A timestamped, immutable text record of a discrete event that occurred in the system.
- Why: Captures rich, unpredictable context — exact error messages, stack traces, request payloads — that metrics can't hold.
- Where: Written by application code (SLF4J / Logback in Java), collected by agents like Fluentd or Filebeat, and stored / searched in systems like Elasticsearch, Loki, or Splunk.
- Analogy: A ship's logbook — the captain writes an entry every time something notable happens: “14:32 — encountered storm, changed course to 220°.” You can reconstruct exactly what happened, in order, by reading the entries.
- Beginner example:
logger.info("User 4521 logged in successfully"). - Production example: Amazon's fulfillment centers log every scan event of a package barcode — which conveyor, which timestamp, which worker station — enabling exact reconstruction of a lost package's last known location.
3.2.1 · STRUCTURED VS UNSTRUCTURED LOGS
Modern production systems almost always use structured logging — logs emitted as JSON (or another machine-parseable format) rather than free-form text. Structured logs are far easier to query, filter, and aggregate at scale.
// Unstructured (hard to query at scale)
log.info("Order 8823 failed for user 4521: insufficient inventory");

// Structured (queryable: log.level=ERROR AND order.status="FAILED")
log.atError()
   .addKeyValue("orderId", 8823)
   .addKeyValue("userId", 4521)
   .addKeyValue("reason", "INSUFFICIENT_INVENTORY")
   .addKeyValue("traceId", MDC.get("traceId"))
   .log("Order processing failed");

/* Resulting structured JSON log line:
{
  "timestamp": "2026-07-20T10:15:32.104Z",
  "level": "ERROR",
  "orderId": 8823,
  "userId": 4521,
  "reason": "INSUFFICIENT_INVENTORY",
  "traceId": "4bf92f3577b34da6a3ce929d0e0e4736",
  "message": "Order processing failed"
}
*/
3.3 · TRACES — THE JOURNEY MAP
- What: A record of a single request's end-to-end path through a distributed system, made up of “spans” — one span per unit of work (an HTTP call, a database query, a function).
- Why: Pinpoints exactly which service or operation, out of dozens in a call chain, is responsible for latency or failure.
- Where: Generated via instrumentation libraries following the OpenTelemetry standard, propagated across services via trace context headers, and visualized in tools like Jaeger, Zipkin, or Grafana Tempo.
- Analogy: A courier package tracking page — “Picked up in Mumbai warehouse → Arrived Delhi hub → Out for delivery → Delivered,” each with a timestamp. You can see exactly which leg of the journey took the longest.
- Beginner example: A single trace showing a “Get Product Page” request took 800ms total, broken into 200ms for the API gateway, 500ms for the database query, and 100ms for rendering.
- Production example: When a Google Search query is slow, a distributed trace can show that out of 200ms total, 150ms was spent waiting on the ads-ranking microservice specifically — pinpointing exactly where engineers should focus optimization efforts.
3.3.1 · SPANS AND TRACE CONTEXT
A trace is a tree (or DAG) of spans. Each span has a unique span ID, a reference to its parent span (if any), a start time, a duration, and metadata (tags). All spans belonging to the same logical request share a single trace ID, which is passed along in request headers as the call travels from service to service — this is called context propagation.
// Simplified span structure (OpenTelemetry-style)
Span {
  traceId:  "4bf92f3577b34da6a3ce929d0e0e4736"
  spanId:   "00f067aa0ba902b7"
  parentId: null                 // root span
  name:     "GET /checkout"
  startTime: 10:15:32.100
  duration:  842ms
  tags: { "http.status_code": 200, "service.name": "api-gateway" }
}

Span (child) {
  traceId:  "4bf92f3577b34da6a3ce929d0e0e4736"   // same trace
  spanId:   "b7ad6b7169203331"
  parentId: "00f067aa0ba902b7"    // child of the gateway span
  name:     "InventoryService.checkStock"
  startTime: 10:15:32.310
  duration:  510ms
  tags: { "service.name": "inventory-service", "db.system": "postgresql" }
}
3.3.2 · JAVA EXAMPLE — CREATING A MANUAL SPAN WITH OPENTELEMETRY
@Service
public class InventoryService {

    private final Tracer tracer;

    public InventoryService(OpenTelemetry openTelemetry) {
        this.tracer = openTelemetry.getTracer("inventory-service");
    }

    public boolean checkStock(String productId, int quantity) {
        Span span = tracer.spanBuilder("InventoryService.checkStock")
                .setAttribute("product.id", productId)
                .setAttribute("requested.quantity", quantity)
                .startSpan();

        try (Scope scope = span.makeCurrent()) {
            boolean available = inventoryRepository.hasStock(productId, quantity);
            span.setAttribute("stock.available", available);
            return available;
        } catch (Exception e) {
            span.recordException(e);
            span.setStatus(StatusCode.ERROR, e.getMessage());
            throw e;
        } finally {
            span.end();
        }
    }
}Monitoring watches for problems you already know about. Observability lets you ask new questions about problems you never anticipated, using the rich telemetry — metrics, logs, and traces — already flowing out of your system. Monitoring is a subset of what observability enables.
3.4 · LOG LEVELS — CONTROLLING THE VOLUME OF THE DIARY
Not every event deserves the same level of attention. Logging frameworks use log levels to let engineers filter signal from noise, both at write time and at query time:
| Level | Meaning | Example |
|---|---|---|
| TRACE | Extremely fine-grained detail, rarely enabled in production | Entering / exiting every method call |
| DEBUG | Diagnostic detail useful during development | Variable values before a calculation |
| INFO | Notable business events, normal operation | “Order 8823 placed successfully” |
| WARN | Something unexpected but recoverable | “Retrying database connection (attempt 2/3)” |
| ERROR | An operation failed and needs attention | “Payment processing failed for order 8823” |
A common beginner mistake is running production systems at DEBUG or TRACE level permanently — this floods storage with low-value data and makes genuinely important ERROR and WARN lines harder to find. Production systems typically run at INFO by default, with the ability to temporarily raise verbosity for a specific service during active investigation.
3.5 · HOW THE THREE PILLARS RELATE TO EACH OTHER
It helps to think of the three pillars as three different lenses on the same underlying reality — a single user request moving through a system. A useful mental model:
- Metrics tell you that something changed (the “what” at an aggregate level).
- Traces tell you where in the distributed call chain the change originated.
- Logs tell you why it happened, with exact detail for that one specific occurrence.
This “what → where → why” funnel is the standard incident investigation workflow used by on-call engineers across nearly every large tech company today, and it's the single biggest reason all three pillars are taught and adopted together rather than in isolation.
Architecture & Components
Instrumentation → Collection → Storage → Visualization & Alerting — the same four layers regardless of vendor.
A production observability stack, regardless of which specific tools you choose, is built from a consistent set of architectural components.
4.1 · INSTRUMENTATION LAYER
This is code embedded inside your application — either manually written or auto-injected by an agent — that generates telemetry. The industry has largely converged on OpenTelemetry (OTel), a vendor-neutral standard (backed by the CNCF) for generating metrics, logs, and traces in a consistent format, so you can switch backends without re-instrumenting your code.
4.2 · COLLECTION LAYER
Raw telemetry from many services is typically routed through a collector (like the OpenTelemetry Collector) that can batch, filter, sample, enrich, and forward the data to one or more backends. This decouples “how data is generated” from “where data is stored.”
4.3 · STORAGE LAYER
Each pillar generally uses a purpose-built storage engine, because their data shapes are very different:
| Pillar | Typical storage | Why specialized |
|---|---|---|
| Metrics | Prometheus, InfluxDB, CloudWatch, Datadog | Optimized for compact time-series storage and fast aggregation |
| Logs | Elasticsearch, Loki, Splunk, CloudWatch Logs | Optimized for full-text search and structured filtering |
| Traces | Jaeger, Zipkin, Grafana Tempo, AWS X-Ray | Optimized for storing and querying trees of spans by trace ID |
4.4 · VISUALIZATION & ALERTING LAYER
Tools like Grafana unify dashboards across all three pillars, while alerting systems like Alertmanager or PagerDuty evaluate metric thresholds and notify on-call engineers.
Internal Working
Pull vs push metrics, log pipelines, trace context propagation, sampling, exemplars, and query-time aggregation.
5.1 · HOW METRICS ARE COLLECTED INTERNALLY: PULL VS PUSH
There are two dominant models for getting metrics from an application into a storage backend:
- Pull model (e.g., Prometheus): The application exposes an HTTP endpoint (commonly
/actuator/prometheusin Spring Boot) with the current value of every metric. The monitoring server periodically “scrapes” (polls) this endpoint, typically every 10-30 seconds. - Push model (e.g., StatsD, CloudWatch): The application actively sends metric updates to a remote collector as they happen.
The pull model is popular in Kubernetes environments because service discovery makes it easy for Prometheus to find and scrape every pod automatically, and because a crashed application simply stops reporting data (which is itself useful information) rather than needing a separate “heartbeat.”
5.2 · HOW LOGS FLOW INTERNALLY
In containerized environments, applications almost always write logs to stdout / stderr rather than local files — the container runtime captures this stream, and an agent (like Fluent Bit) running as a DaemonSet on each Kubernetes node picks it up, enriches it with metadata (pod name, namespace, labels), and ships it onward, usually via a durable buffer like Kafka to absorb traffic spikes before it reaches the search index.
5.3 · HOW DISTRIBUTED TRACING WORKS INTERNALLY: CONTEXT PROPAGATION
The hardest engineering problem in tracing isn't generating spans — it's making sure the same trace ID flows through every service involved in a request, even across network boundaries and different programming languages. This is done via context propagation: the trace ID and parent span ID are serialized into HTTP headers (following the W3C Trace Context standard) on every outbound call.
GET /inventory/check HTTP/1.1
Host: inventory-service.internal
traceparent: 00-4bf92f3577b34da6a3ce929d0e0e4736-00f067aa0ba902b7-01
tracestate: congo=t61rcWkgMzE
The receiving service reads this header, creates a new child span with a new span ID but the same trace ID, does its work, and if it calls further services, propagates the (now updated) context onward. This chain of propagation is what lets a tracing backend reassemble the full tree of spans into one coherent trace after the fact.
5.4 · SAMPLING — THE INTERNAL COST-CONTROL MECHANISM
At scale, capturing a full trace for every single request would be prohibitively expensive to store. Production systems use sampling strategies:
- Head-based sampling: The decision to trace a request is made at the very start (e.g., “trace 1% of all requests”), before knowing the outcome.
- Tail-based sampling: All spans for a request are buffered temporarily, and the decision to keep or discard the trace is made after the request completes — so you can prioritize keeping traces for slow or failed requests, which are usually the most interesting ones.
Observability backends are themselves distributed systems and face CAP theorem trade-offs. Prometheus, for instance, favors availability and partition tolerance for local scraping but is eventually consistent when metrics are federated or remote-written across regions — it deliberately sacrifices strict consistency because stale monitoring data for a few seconds is far less costly than an unavailable monitoring system during an incident.
5.5 · EXEMPLARS — LINKING METRICS DIRECTLY TO TRACES
Modern metrics systems support exemplars: a sample trace ID attached to a specific metric data point. So when a latency histogram bucket shows “142 requests took between 500ms-1000ms,” an exemplar lets you click through directly to one actual trace from that bucket, instantly jumping from an aggregate view to a concrete example — bridging the gap between the metrics pillar and the traces pillar without any manual searching.
5.6 · HOW AGGREGATION HAPPENS SERVER-SIDE
When Prometheus scrapes a metric from ten replicas of the same service, it stores each replica's value as a separate time series (differentiated by instance labels). Dashboards then perform server-side aggregation at query time — for example, summing across all instances to get total requests per second, using a query language called PromQL: sum(rate(http_requests_total[5m])) by (route). This query-time aggregation model means raw data is preserved, and engineers can slice it in many different ways after the fact, rather than being locked into whatever aggregation was decided in advance.
Data Flow & Lifecycle
Follow one user request all the way from generation to an engineer's dashboard — and then to expiry.
Let's trace the end-to-end lifecycle of telemetry data for a single user request, from generation to an engineer viewing it on a dashboard.
Generation
As the request flows through Services A, B, and C, each service increments in-memory metric counters, writes structured log lines, and creates spans tagged with the shared trace ID.
Buffering
Metrics accumulate in an in-process registry until the next scrape; logs are buffered briefly before being flushed to stdout; spans are batched in memory before being exported.
Collection & transport
A collector / agent pulls or receives this data and forwards it — often through a durable queue like Kafka to smooth out traffic spikes.
Storage & indexing
Each backend stores and indexes the data in a format optimized for its query patterns (time-series compression for metrics, inverted indexes for logs, trace-ID-keyed storage for traces).
Correlation
Because logs and traces both carry the trace ID, an engineer looking at a slow span in Jaeger can jump directly to the corresponding log lines in Elasticsearch for that exact request.
Retention & expiry
Data ages out on a schedule — metrics might be kept at full resolution for 15 days then downsampled for a year; logs might be retained for 30-90 days; traces (being the most expensive per-byte) are often retained for only 7-14 days.
Pros, Cons & Trade-offs
Three purpose-built stores earn their place — but they need a shared correlation ID to be more than three silos.
Advantages of the three-pillar model
- Each pillar is optimized for its own storage and query pattern, keeping costs manageable at scale.
- Together, they let teams answer unanticipated questions without shipping new code.
- Correlation via trace IDs turns three separate signals into one coherent investigation workflow.
- Open standards (OpenTelemetry) mean instrumentation is largely vendor-neutral.
Challenges & trade-offs
- Running three separate storage systems adds real operational and cost overhead.
- High-cardinality metrics (e.g., tagging by user ID) can silently blow up storage costs and crash metrics backends.
- Full tracing of every request is often too expensive; sampling means some incidents may lack a trace.
- Without disciplined correlation IDs, the three pillars stay siloed and lose most of their combined value.
7.1 · METRICS VS LOGS VS TRACES — A COMPARISON
| Dimension | Metrics | Logs | Traces |
|---|---|---|---|
| Granularity | Aggregated | Per-event | Per-request, per-operation |
| Storage cost at scale | Low | High | Medium-High |
| Query speed | Very fast | Moderate | Fast (by trace ID) |
| Best for | Alerting, trends | Root-cause detail | Cross-service latency analysis |
| Cardinality tolerance | Low (expensive if high) | High | High |
Performance & Scalability
Cardinality, downsampling, sampling, batching, query caching, and the cost dimension that quietly dominates the rest.
Observability systems must scale alongside the systems they observe — and at large companies, telemetry volume can itself become a massive engineering problem. Netflix and Uber, for instance, each generate petabytes of logs and trillions of trace spans daily.
8.1 · CARDINALITY — THE SILENT KILLER OF METRICS SYSTEMS
Cardinality refers to the number of unique combinations of label / tag values a metric can have. A metric like http_requests_total{status="200", route="/checkout"} has low cardinality (a handful of status codes and routes). But if you accidentally add a user_id tag with millions of unique values, you create millions of unique time series — this is called a cardinality explosion, and it can crash or bankrupt a metrics backend. This is precisely why user-specific, high-cardinality data belongs in logs or traces, not metrics.
8.2 · DOWNSAMPLING AND RETENTION TIERS
To control storage growth, metrics systems typically downsample old data — keeping raw 10-second resolution for the last few hours, 1-minute resolution for the last month, and 1-hour resolution for the last year.
8.3 · SAMPLING STRATEGIES AT SCALE
As discussed earlier, tail-based sampling lets large systems keep a small, high-value fraction of traces (errors, high-latency requests) while discarding the “boring” majority — dramatically cutting storage without losing the traces engineers actually need during an incident.
8.4 · BATCHING & BUFFERING
Both log and trace exporters batch data client-side before sending, reducing network overhead. In Java, OpenTelemetry's BatchSpanProcessor buffers spans and flushes them periodically or when a size threshold is hit, rather than making a network call per span.
8.5 · QUERY-TIME PERFORMANCE
Beyond ingestion, the query side of observability systems also needs to scale. Time-series databases pre-compute and cache commonly requested aggregations (like the ones backing a popular dashboard) so that a dashboard refresh doesn't have to scan raw data every time. Log search systems build inverted indexes over structured fields so that a query like service=payment AND level=ERROR AND traceId=4bf92f... can return in milliseconds even across billions of stored log lines, rather than doing a full linear scan.
8.6 · COST AS A FIRST-CLASS SCALABILITY CONCERN
At sufficient scale, the dominant scalability constraint on an observability system often isn't compute or query latency — it's dollar cost. Teams commonly apply a layered cost-control strategy: sample traces aggressively while always keeping errors and slow requests, downsample old metrics, set aggressive but sensible log retention windows (with cheaper cold storage for compliance-driven long-term retention), and periodically audit dashboards and alerts to remove metrics nobody actually queries. Treating telemetry cost management as a continuous engineering practice, rather than a one-time cleanup, is what separates observability platforms that scale sustainably from ones that eventually get scaled back reactively after a budget shock.
High Availability & Reliability
A monitoring system that dies during an incident is worse than useless. HA rules for the eyes of your system.
Ironically, an observability system that goes down during an incident — exactly when you need it most — is worse than useless. HA design here matters as much as for any core production system.
- Redundant collectors: Run multiple OpenTelemetry Collector instances behind a load balancer so no single collector is a point of failure.
- Local buffering on failure: Instrumentation libraries buffer telemetry locally and retry with backoff if the collector is temporarily unreachable, rather than dropping data or blocking the application.
- Replicated storage backends: Prometheus is often run in HA pairs (two independent instances scraping the same targets); Elasticsearch and trace stores use replica shards.
- Separate infrastructure from what it observes: Observability infrastructure should run in a different failure domain (different cluster, region, or even cloud account) than the systems it monitors — so a regional outage doesn't take down both your application and your ability to see what's happening.
- Graceful degradation: If the trace or log backend is unavailable, applications should keep serving user traffic — telemetry loss should never cause an outage in the primary system.
During the 2021 AWS us-east-1 outage, several companies discovered their monitoring dashboards were hosted in the very same region that was failing — leaving engineers unable to see what was happening while it was happening. Since then, running observability infrastructure in a separate, independent region has become a standard best practice.
9.1 · DISASTER RECOVERY FOR TELEMETRY DATA
Just like a primary database, observability backends need a disaster recovery plan. Time-series metrics databases like Prometheus commonly use remote write to continuously ship data to a long-term, geographically separate storage tier (e.g., Thanos or Cortex), so a single Prometheus instance's failure doesn't erase historical data needed for post-incident analysis. Log and trace stores similarly rely on multi-node replication (Elasticsearch replica shards, for example) so the loss of one node doesn't mean the loss of an entire day's investigation trail.
9.2 · FAILOVER AND CIRCUIT BREAKERS WITHIN THE PIPELINE ITSELF
Well-designed telemetry pipelines apply the same resilience patterns used elsewhere in distributed systems — circuit breakers, backpressure, and graceful degradation — to their own internal data flow. If a downstream log store becomes slow or unavailable, an agent should apply backpressure (buffer locally, then start dropping the lowest-priority data, such as DEBUG-level logs, before dropping ERROR-level ones) rather than let the backlog crash the collector or, worse, block the application it's instrumenting.
Security Considerations
Telemetry pipelines carry more sensitive data than most teams realise. Treat them as part of the security perimeter.
Telemetry pipelines carry a surprising amount of sensitive data, and treating them as “just monitoring” is a common security mistake.
- PII leakage in logs: Developers frequently log request / response payloads for debugging, accidentally capturing passwords, credit card numbers, or personal data. Structured logging frameworks should support automatic field redaction (e.g., masking any field named
passwordorssn). - Access control: Dashboards and log search tools should enforce role-based access — not every engineer needs to see production customer data in raw logs.
- Encryption in transit and at rest: Telemetry often traverses the public internet (SaaS observability vendors) and must be encrypted with TLS; stored data should be encrypted at rest.
- Injection via log data: Untrusted user input written into logs can enable log injection attacks (fake log lines) or, in vulnerable logging libraries, remote code execution — as seen in the 2021 Log4Shell (CVE-2021-44228) vulnerability in Apache Log4j, where a specially crafted string logged by an application could trigger remote code execution.
- Trace data sensitivity: Span attributes can inadvertently include sensitive data (e.g., a SQL query span including literal query parameters); tracing libraries should be configured to strip parameter values by default.
Treat your observability pipeline as part of your security perimeter, not an afterthought. Apply the same data classification and redaction rules to telemetry that you apply to production databases.
Monitoring, Logging & Metrics Ecosystem
A quick tour of the tools engineers actually reach for in 2026, per pillar.
A quick tour of the tools engineers actually use for each pillar in 2026:
| Category | Open-source options | Commercial / SaaS options |
|---|---|---|
| Metrics | Prometheus, VictoriaMetrics, Graphite | Datadog, New Relic, CloudWatch, Grafana Cloud |
| Logs | Elasticsearch / OpenSearch + Fluentd / Fluent Bit, Grafana Loki | Splunk, Datadog Logs, Sumo Logic |
| Traces | Jaeger, Zipkin, Grafana Tempo | Datadog APM, Honeycomb, AWS X-Ray, Lightstep |
| Instrumentation standard | OpenTelemetry (SDKs for Java, Go, Python, Node, etc.) | Vendor auto-instrumentation agents built on OTel |
| Dashboards / visualization | Grafana | Datadog, New Relic dashboards |
| Alerting | Alertmanager (Prometheus), Grafana Alerting | PagerDuty, Opsgenie |
Many teams also adopt a fourth, emerging category alongside the three pillars: continuous profiling (e.g., Pyroscope, Datadog Continuous Profiler), which captures CPU / memory flame graphs continuously in production — sometimes discussed as a candidate “fourth pillar,” though it remains less universally adopted than the original three.
Deployment & Cloud Considerations
Self-hosted vs managed, Kubernetes-native patterns, cloud-native offerings, hybrid setups, and egress cost realities.
12.1 · SELF-HOSTED VS MANAGED
Small teams often start with a managed SaaS observability platform (Datadog, New Relic) to avoid operating storage infrastructure themselves. Larger, cost-sensitive organizations frequently self-host Prometheus + Grafana + Loki / Elasticsearch + Jaeger / Tempo on Kubernetes, trading operational effort for significantly lower cost at high volume.
12.2 · KUBERNETES-NATIVE PATTERNS
- Sidecar pattern: A logging or tracing agent runs as a sidecar container in the same pod as the application, sharing its network namespace and volumes.
- DaemonSet pattern: A single agent (like Fluent Bit) runs once per node and collects logs / metrics from every pod on that node — more resource-efficient than one sidecar per pod.
- Service mesh integration: Meshes like Istio or Linkerd can automatically generate metrics and traces for every service-to-service call without any application code changes, by intercepting traffic at the proxy layer.
12.3 · CLOUD-NATIVE MANAGED OFFERINGS
Every major cloud provider ships native observability tooling: AWS CloudWatch (metrics / logs) and X-Ray (tracing); Google Cloud Monitoring, Logging, and Trace; Azure Monitor and Application Insights. These integrate tightly with their respective platforms but can create vendor lock-in — a key reason many teams standardize on OpenTelemetry, which lets them switch backends by changing configuration rather than rewriting instrumentation.
12.4 · HYBRID AND MULTI-CLOUD DEPLOYMENTS
Organizations running across multiple clouds, or a mix of cloud and on-premises data centers, face an additional challenge: each cloud's native tooling only sees its own environment. A request that starts in an on-premises data center and finishes in a cloud-hosted microservice would be invisible to either platform's native dashboard alone. This is another strong argument for OpenTelemetry-based, cloud-agnostic pipelines that funnel telemetry from every environment into a single unified backend, giving engineers one coherent view regardless of where each service happens to run.
12.5 · COST OF EGRESS AND DATA LOCALITY
Shipping large volumes of logs and traces out of a cloud region or provider incurs data egress charges that can become significant at scale. Many teams therefore process and filter telemetry as close to its source as possible — for example, doing initial filtering and sampling inside the same region it was generated in — before shipping only the retained, high-value subset to a centralized, possibly cross-region, long-term store.
Storage, Caching & Load Balancing in Observability Pipelines
Time-series compression, dashboard result caching, and Kafka as a shock absorber for bursty telemetry.
13.1 · TIME-SERIES STORAGE INTERNALS
Metrics databases like Prometheus use specialized time-series storage engines that compress sequential numeric data extremely efficiently (often 1-2 bytes per sample using delta-of-delta and XOR-based encoding), because consecutive values in a time series tend to be very similar.
13.2 · CACHING IN OBSERVABILITY TOOLS
Dashboarding tools like Grafana cache query results for frequently viewed dashboards to avoid re-querying the underlying time-series database on every page load, especially important when many engineers view the same incident dashboard simultaneously during an outage.
13.3 · LOAD BALANCING TELEMETRY INGESTION
At scale, telemetry ingestion endpoints (collectors) sit behind load balancers, and durable message queues like Kafka act as a buffer / shock-absorber between bursty telemetry production (e.g., during an incident, when error logs spike dramatically) and the storage backend's steady ingestion capacity — preventing a traffic spike in telemetry itself from overwhelming the storage layer, a particularly cruel failure mode since it happens exactly when engineers need the data most.
APIs & Microservices
Correlation IDs, async tracing, RED & USE, SLOs, and API gateways as the natural chokepoint for observability.
Observability and microservices architecture are deeply intertwined — microservices are precisely what made the three pillars necessary in the first place, since a request's behavior can no longer be understood by looking at one process's logs alone.
14.1 · THE CORRELATION ID PATTERN
Every request entering a microservices system should be tagged with a unique correlation / trace ID at the edge (API gateway), and that ID must be propagated through every downstream call and included in every log line and span. Without this discipline, the three pillars remain disconnected islands of data.
@Component
public class CorrelationIdFilter extends OncePerRequestFilter {

    private static final String TRACE_ID_HEADER = "X-Trace-Id";

    @Override
    protected void doFilterInternal(HttpServletRequest request,
                                     HttpServletResponse response,
                                     FilterChain chain) throws IOException, ServletException {
        String traceId = request.getHeader(TRACE_ID_HEADER);
        if (traceId == null || traceId.isEmpty()) {
            traceId = UUID.randomUUID().toString();
        }
        // MDC makes traceId available to every log statement on this thread automatically
        MDC.put("traceId", traceId);
        response.setHeader(TRACE_ID_HEADER, traceId);
        try {
            chain.doFilter(request, response);
        } finally {
            MDC.clear();
        }
    }
}
14.2 · OBSERVABILITY FOR ASYNCHRONOUS AND EVENT-DRIVEN APIS
Tracing gets significantly harder across message queues (Kafka, RabbitMQ) because there's no synchronous HTTP call to attach headers to. Modern approaches propagate trace context inside message headers / metadata, so a consumer processing a Kafka message can continue the same trace the producer started — this is standardized under OpenTelemetry's messaging semantic conventions.
14.3 · API-LEVEL OBSERVABILITY METRICS (THE RED METHOD)
A popular convention for instrumenting any API or microservice is the RED method:
- Rate — requests per second
- Errors — failed requests per second
- Duration — distribution of request latencies
A related convention for infrastructure / resources is the USE method (Utilization, Saturation, Errors), popularized by performance engineer Brendan Gregg for systems-level metrics like CPU and disk.
14.4 · SERVICE-LEVEL OBJECTIVES AND ERROR BUDGETS
Observability data is the raw material behind Service Level Objectives (SLOs) — explicit, measurable targets for how reliable an API should be, such as “99.9% of checkout requests complete successfully within 500ms over a rolling 30-day window.” The gap between 100% and the SLO target is called the error budget: a small, deliberately allowed amount of failure. Metrics continuously track actual performance against the SLO; when the error budget is nearly exhausted, teams slow down risky deployments until reliability recovers. This turns observability from a purely reactive debugging tool into a proactive input for engineering and release decisions.
14.5 · API GATEWAYS AS A NATURAL OBSERVABILITY CHOKEPOINT
Because every external request to a microservices system typically passes through a single API gateway, this is a natural place to generate the root span of every trace, assign correlation IDs, and emit top-level RED metrics before a request fans out to dozens of internal services — giving engineers a consistent, single source of truth for “what did the outside world actually experience,” independent of how the request was handled internally.
Design Patterns & Anti-Patterns
The habits that make a stack trustworthy — and the ones that quietly poison it.
15.1 · PATTERNS
- Structured logging pattern: Always emit logs as structured key-value / JSON data, never free-form strings, so they're queryable at scale.
- Correlation ID propagation: Generate a trace / correlation ID at the system edge and thread it through every log, metric label, and span across every service.
- RED / USE method instrumentation: Standardize what every service measures (rate, errors, duration for APIs; utilization, saturation, errors for resources) so dashboards are consistent across teams.
- Sidecar / DaemonSet collection: Decouple telemetry collection from application code using infrastructure-level agents wherever possible (service meshes, DaemonSets), minimizing per-service instrumentation burden.
- SLO-driven alerting: Alert on symptoms that affect users (error budgets, latency SLOs) rather than every individual internal metric crossing an arbitrary threshold, to reduce alert fatigue.
15.2 · ANTI-PATTERNS
Logging everything at DEBUG in production
Floods storage with low-value data, drowns out signal, and inflates cost dramatically.
High-cardinality metric labels
Tagging metrics with unbounded values like user IDs or request IDs, causing cardinality explosions that crash metrics backends.
Alert-per-metric sprawl
Creating an alert for every metric a dashboard shows, leading to alert fatigue where engineers start ignoring pages.
Siloed pillars
Running metrics, logs, and traces in disconnected systems with no shared correlation ID, forcing engineers to manually cross-reference timestamps during incidents — slow and error-prone.
Observability as an afterthought
Bolting on instrumentation only after a painful outage, rather than building it in from day one of a service's life.
Logging sensitive data unredacted
Writing raw request bodies containing passwords or PII directly to logs.
Best Practices & Common Mistakes
A day-one checklist for every new service, plus the mistakes that show up repeatedly in post-mortems.
16.1 · BEST PRACTICES
Adopt OpenTelemetry from the start
Vendor-neutral instrumentation lets you switch backends later without rewriting code.
Define SLOs for critical user journeys
Alert on SLO burn rate, not raw internal metrics.
Use structured logging everywhere
Adopt a consistent schema across all services so queries generalise.
Propagate a single correlation / trace ID
Thread it through every log line, span, and (where feasible) metric label.
Set explicit retention and sampling policies per pillar
Base them on actual investigation needs, not “keep everything forever.”
Build runbook-linked dashboards
When an alert fires, the on-call engineer should land directly on a dashboard that helps them, not a generic overview.
Regularly audit for high-cardinality metrics and PII leakage in logs
Treat this as a recurring engineering hygiene task, not a one-off cleanup.
16.2 · COMMON MISTAKES
- Instrumenting only after the first major production incident, rather than proactively.
- Treating dashboards as “done” once built, without pruning stale or noisy panels over time.
- Ignoring the cost implications of telemetry volume until a surprise bill arrives.
- Using traces only for debugging, missing their value for proactive performance analysis and capacity planning.
- Not testing the observability pipeline itself for failure — assuming it will always be available during an incident.
- Overlooking client-side and edge observability — instrumenting only backend services while leaving mobile apps and browser frontends as blind spots, even though a large share of real-world user-facing issues (slow page loads, JavaScript errors, failed API calls from a flaky mobile network) originate outside the backend entirely.
- Failing to version and document telemetry schemas — when field names or label conventions change silently between service versions, historical dashboards and saved queries quietly break, and nobody notices until an incident makes the gap painfully obvious.
16.3 · A SIMPLE CHECKLIST FOR NEW SERVICES
Before a new microservice goes to production, a reasonable minimum observability checklist includes: RED metrics exposed on a standard endpoint; structured logging with correlation ID support wired into the logging framework; distributed tracing instrumentation enabled via OpenTelemetry auto-instrumentation or manual spans on key operations; at least one dashboard scoped to the service; and at least one SLO-based alert tied to a real user-facing symptom, not just an internal implementation detail.
Real-World / Industry Examples
Netflix, Uber, Google, Amazon, Twitter, LinkedIn, and Airbnb — how the largest engineering teams actually run observability.
Atlas — time series at scale
Netflix operates one of the largest observability platforms in the industry, built around its internal “Atlas” time-series metrics system (open-sourced), handling billions of time series to power real-time dashboards across thousands of microservices spanning global streaming infrastructure.
Built Jaeger for distributed tracing
Uber built “Jaeger,” which later became one of the most widely adopted open-source distributed tracing systems in the industry (and a CNCF graduated project), specifically to debug latency issues across its highly microservices-heavy architecture powering real-time ride matching.
The Dapper paper (2010)
Google's internal “Dapper” paper was one of the earliest and most influential publications on production-scale distributed tracing, directly inspiring both Zipkin (originally built at Twitter) and Jaeger, and shaping how the industry thinks about trace sampling and span propagation at massive scale.
Event-level logging for every package
Amazon's fulfillment and logistics systems rely heavily on structured, event-level logging to track individual packages through warehouses, enabling precise reconstruction of a package's exact path when something goes wrong — a scale problem where even small per-event logging inefficiencies multiply into massive infrastructure costs.
Gave the world Zipkin
Twitter's engineering team originally created Zipkin, one of the first widely adopted open-source distributed tracing systems, directly inspired by Google's Dapper paper, to help debug latency across its large and rapidly growing service-oriented backend during a period of intense scaling pressure.
Kafka as the telemetry backbone
LinkedIn built and open-sourced Kafka, which today underpins the buffering / transport layer of countless companies' observability pipelines — using durable, partitioned logs to absorb bursty telemetry traffic between producers (applications) and consumers (storage backends) without data loss during traffic spikes.
Ownership-aware dashboards
Airbnb has spoken publicly about consolidating metrics, logs, and traces around a shared set of service-ownership metadata, so that when an alert fires for a given service, the responsible team can be paged automatically and land directly on a dashboard scoped to their own service — reducing the time between “something broke” and “the right person is looking at it.”
FAQ, Summary & Key Takeaways
Short answers to the recurring questions, plus the seven things worth memorising.
Is observability the same as monitoring?
No. Monitoring watches a predefined set of signals for known problems. Observability is a broader property: the ability to understand a system's internal state — including problems you never anticipated — purely from the telemetry it emits. Monitoring is one use case built on top of an observable system.
Do I need all three pillars from day one?
For a small monolith, metrics and basic logs are often enough initially. Distributed tracing becomes essential once a single request starts crossing multiple services, since that's precisely the scenario where logs and metrics alone can't show you the causal chain.
What is the “fourth pillar” people sometimes mention?
Continuous profiling (CPU / memory flame graphs captured in production) is increasingly discussed as a fourth pillar, since it can reveal performance issues that metrics, logs, and traces don't directly surface — though it's less universally adopted than the original three.
What is OpenTelemetry, exactly?
An open, vendor-neutral standard and set of SDKs (formed by merging OpenTracing and OpenCensus in 2019) for generating metrics, logs, and traces in a consistent format, so instrumentation isn't locked to one specific vendor's proprietary agent.
Why can't I just log everything and skip metrics / traces?
Logs alone don't scale well for real-time aggregation (computing a live error rate across millions of log lines is far slower than reading a pre-aggregated metric), and they don't inherently show causal relationships across services the way a trace's parent-child span structure does.
What's the difference between a “span” and a “trace”?
A trace represents one entire end-to-end request; a span represents one unit of work within that request (a single database query, a single HTTP call, a single function execution). A trace is a tree made up of many spans, all sharing the same trace ID.
How much does observability typically cost at scale?
It varies widely by data volume, retention, and cardinality, but for organizations with heavy log and trace volume, observability tooling can become one of the largest line items in the infrastructure budget — which is exactly why sampling, retention tiers, and cardinality discipline aren't optional extras but core architectural decisions.
Can I add observability to a legacy monolith, or is it only for microservices?
Observability benefits any system, including monoliths — metrics and structured logs alone can dramatically improve visibility into a single large application. Distributed tracing becomes especially valuable, though not strictly necessary, once a request starts crossing service or process boundaries.
18.1 · SUMMARY
The three pillars of observability — metrics, logs, and traces — emerged because distributed, microservices-based systems broke the old model of debugging by SSH-ing into a single server. Metrics give a cheap, real-time pulse of system health; logs provide rich, event-level detail; traces reveal the causal path of a single request across many services. None of the three alone is sufficient — their real power comes from being correlated together via a shared trace / correlation ID, letting engineers move from “something is wrong” (metrics) to “here's the request that broke” (traces) to “here's exactly why it broke” (logs).
18.2 · KEY TAKEAWAYS
- Observability is the ability to understand unanticipated problems from a system's external outputs; monitoring is watching for anticipated ones.
- Metrics are cheap, aggregated, and best for dashboards / alerting — but dangerous with high-cardinality labels.
- Logs are detailed and flexible but expensive at scale and require structuring plus redaction discipline.
- Traces reveal cross-service causal chains via propagated trace IDs made of parent-child spans.
- OpenTelemetry has become the standard, vendor-neutral way to generate all three types of telemetry.
- Correlation IDs are the glue that turns three separate data stores into one coherent investigation workflow.
- Observability infrastructure itself needs HA, security, and cost-management discipline — it's production infrastructure, not an afterthought.
As distributed systems keep growing in complexity — more services, more regions, more deployment frequency — the three pillars of observability aren't a passing trend; they're the baseline vocabulary every backend engineer needs to reason about production systems they can no longer fully hold in their head. Start small (structured logs and a handful of RED metrics on day one), grow deliberately (add tracing as soon as requests start crossing service boundaries), and treat correlation between the three pillars as the real goal, not just collecting each one in isolation.