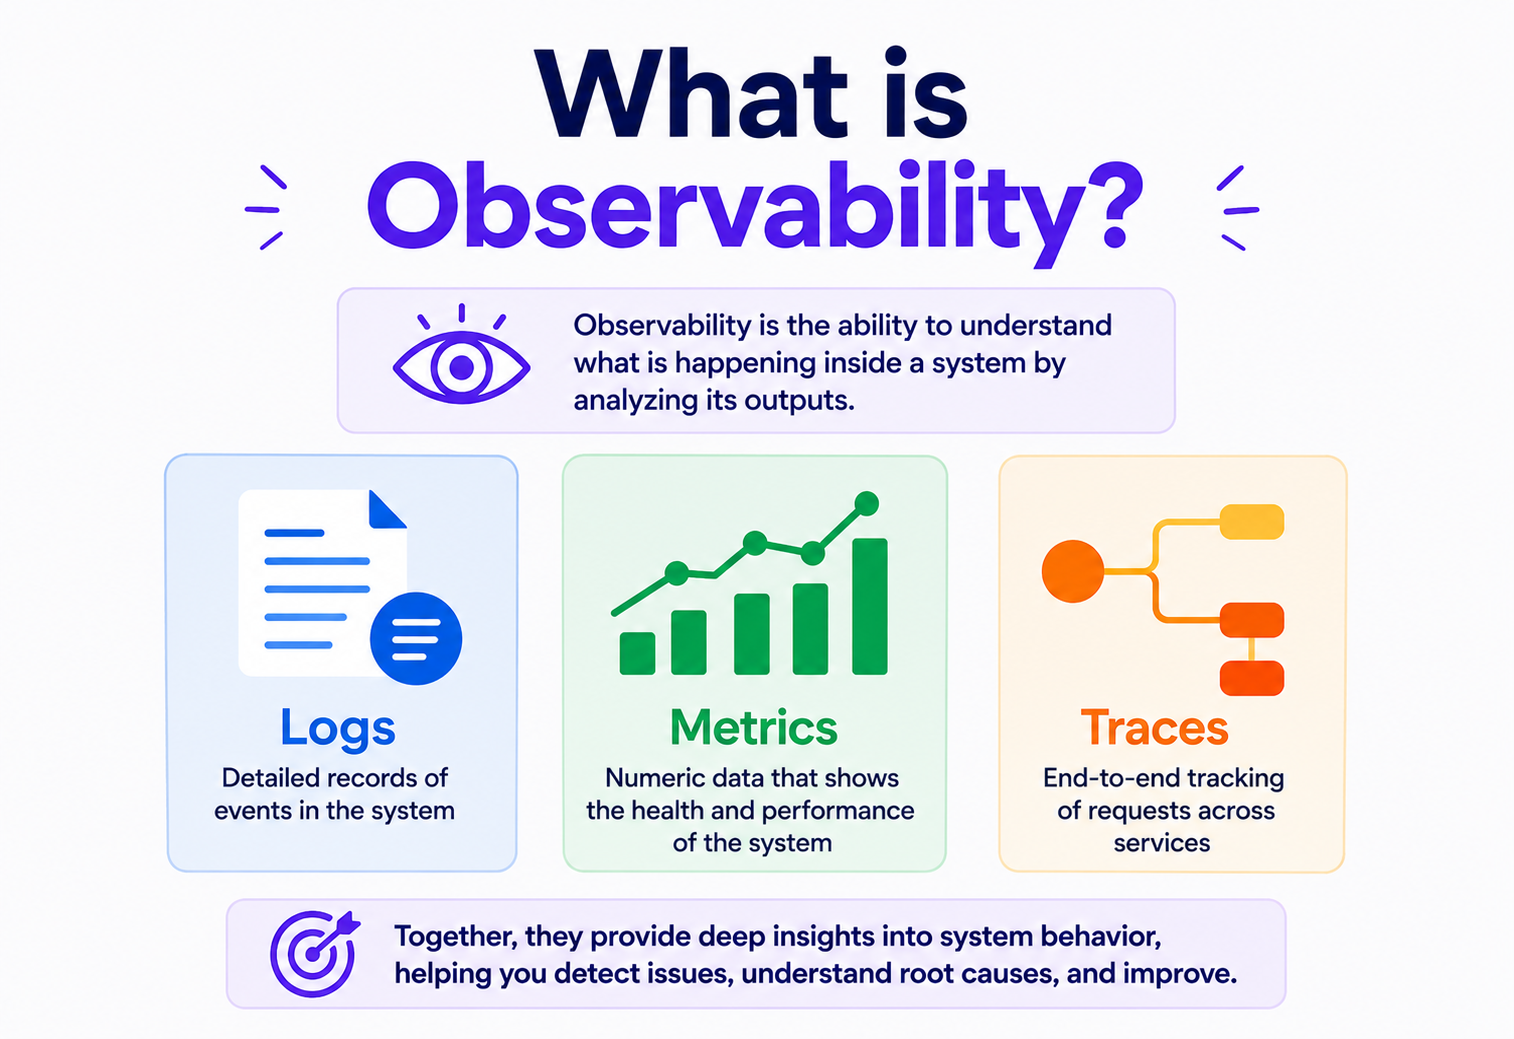
What is Observability?
A complete, beginner‑friendly guide to understanding how modern systems let you see, question, and understand what’s happening inside them — from first principles to production‑grade practice at companies like Netflix, Uber, and Google.
Introduction & History
Imagine you’re driving a car with no dashboard. No speedometer, no fuel gauge, no warning lights — just the engine sound and a vague feeling that something might be wrong. You could still drive, but the moment something breaks, you’d have no idea why. You’d have to pull over, pop the hood, and guess.
That’s what running software without observability is like. Observability is the practice of instrumenting your systems so that, when something goes wrong (or even when everything is going right), you can ask new questions about your system’s internal state — without having to ship new code to answer them.
The word itself comes from control theory, a branch of engineering and mathematics. In 1960, a mathematician named Rudolf Kálmán formally defined observability as: a system is “observable” if you can determine its complete internal state just by looking at its external outputs over time. Think of a submarine captain who can’t see outside — but by watching the instruments (depth, speed, sonar), can figure out exactly where the sub is and what it’s doing.
Software engineers borrowed this idea decades later. Through the 2010s, as companies like Google, Twitter, and Uber built enormous distributed systems — thousands of small services calling each other across data centers — the old way of debugging (log into a server, read a log file, restart it) completely broke down. You couldn’t SSH into a thousand containers. You needed systems that told you, in real time and after the fact, exactly what was happening across the whole fleet.
A doctor doesn’t need to cut you open to know you have a fever — a thermometer (a well‑placed sensor) tells them enough to ask the right follow‑up questions. Observability is about building enough “sensors” into your software that engineers rarely need to “cut it open” (attach a debugger, SSH into a box) to understand what’s wrong.
The Problem & Motivation
Why did the industry need a new word and a new discipline? Because monitoring — the older practice — wasn’t enough anymore.
Monitoring answers questions you already knew to ask. You set up a dashboard that watches CPU usage, and an alert fires if CPU goes above 90%. That’s great — as long as the problem you’re having is one you predicted in advance. But in a complex distributed system, most production incidents are things nobody predicted. A cache in one region gets slow, which causes retries, which causes a queue to back up, which causes a completely unrelated service three hops away to time out. No one wrote a dashboard for “queue backpressure caused by regional cache latency causing downstream timeouts in the payments service” — because no one thought of that specific chain of failure ahead of time.
Observability flips the model: instead of pre‑defining every question, you instrument your system richly enough (with logs, metrics, and traces, tagged with lots of context) that you can ask brand new questions on the fly, using the data you already collected — without redeploying anything.
| Monitoring | Observability |
|---|---|
| Answers known questions (“is CPU high?”) | Lets you ask new, unanticipated questions |
| Built around dashboards and threshold alerts | Built around rich, high‑cardinality telemetry data |
| Tells you that something is wrong | Helps you understand why it’s wrong |
| Works well for simple, predictable systems | Essential for complex, distributed, ever‑changing systems |
Observability doesn’t replace monitoring — it’s built on top of it, and includes it. Think of monitoring as the smoke alarm, and observability as the entire fire investigation kit: sensors, footage, floor plans, and interview notes that let you reconstruct exactly how the fire started.
Core Concepts
Observability rests on three foundational types of telemetry data, often called the three pillars. Each answers a different kind of question.
Logs
Timestamped, discrete records of events. “What exactly happened at 3:04:12pm?” Great for detail, hard to aggregate at scale.
Metrics
Numeric measurements aggregated over time, like request count or latency. “How is the system trending?” Cheap to store, easy to graph and alert on.
Traces
The path of a single request as it flows through many services. “Where did this specific request spend its time?” Essential in microservices.
Beyond these three, a few more concepts matter:
- Cardinality — how many unique values a piece of data can take. A field like
http_statushas low cardinality (maybe 10 values). A field likeuser_idhas extremely high cardinality (millions of values). High‑cardinality data is what makes observability powerful — it lets you slice data down to “just this one customer’s requests” — but it’s also expensive to store, which is a major engineering trade‑off. - Context propagation — the technique of passing a unique ID (a “trace ID”) along with a request as it hops from service to service, so all the logs, metrics, and trace spans it produces can later be stitched back together.
- Instrumentation — the actual code (or auto‑injected agent) that produces logs, metrics, and traces from your application.
- SLI / SLO / SLA — Service Level Indicator (a measured value, like “99.95% of requests succeed”), Service Level Objective (your internal target), and Service Level Agreement (a promise to a customer, often with financial penalties).
A single dropped request might show up as one confusing log line. But if that log line carries a trace ID, you can pull every related log, span, and metric from every service that request touched — turning a mystery into a clear story.
Architecture & Components
A production observability stack usually has four architectural layers: instrumentation (inside your app), collection (an agent or sidecar), a pipeline (routing, sampling, enrichment), and storage/query/visualization (where humans actually look at the data).
Let’s unpack each box:
- Instrumentation library / SDK — code embedded in your application (or auto‑attached via a Java agent) that generates telemetry. The industry standard today is OpenTelemetry (“OTel”), a vendor‑neutral open‑source project supported by nearly every major vendor.
- Collector / agent — a small local process that receives telemetry, batches it, and forwards it onward. This decouples your app from the backend — you can swap backends without touching application code.
- Pipeline — this stage samples (keeps only a fraction of traces to save cost), enriches (adds metadata like region or version), and redacts (strips sensitive fields like credit card numbers) before data is stored.
- Storage backends — logs typically go into a search‑optimized store (like Elasticsearch or Loki), metrics into a time‑series database (like Prometheus or a managed TSDB), and traces into a trace store (like Jaeger or Tempo).
- Query & visualization layer — dashboards (Grafana), trace explorers, and alerting rules that engineers actually interact with.
Internal Working
Let’s look at how a single piece of telemetry — say, a trace span — actually gets created and shipped, using a small Java example. In real systems you’d use the OpenTelemetry SDK, but here’s a simplified version to show the mechanics.
// A minimal, hand-rolled "span" to illustrate the core idea
public class Span {
    private final String traceId;
    private final String spanId;
    private final String name;
    private final long startTimeNanos;
    private long endTimeNanos;
    private final Map<String, String> attributes = new HashMap<>();

    public Span(String traceId, String name) {
        this.traceId = traceId;
        this.spanId = UUID.randomUUID().toString().substring(0, 8);
        this.name = name;
        this.startTimeNanos = System.nanoTime();
    }

    public void setAttribute(String key, String value) {
        attributes.put(key, value);
    }

    public void end() {
        this.endTimeNanos = System.nanoTime();
        // In a real SDK, this line hands the span to an exporter,
        // which batches spans and sends them to the collector.
        Exporter.export(this);
    }

    public long durationMicros() {
        return (endTimeNanos - startTimeNanos) / 1000;
    }
}
When a request comes in, the very first service creates a traceId and a root span. That trace ID is then passed along in the HTTP headers (commonly as a traceparent header, per the W3C Trace Context standard) to every downstream service it calls. Each service creates its own child span, tagged with the same trace ID, does its work, and reports timing back through the exporter.
// Passing context downstream in an HTTP call
public void callPaymentService(String traceId, String parentSpanId) {
    Span span = new Span(traceId, "call-payment-service");
    span.setAttribute("parent.span.id", parentSpanId);

    HttpRequest request = HttpRequest.newBuilder()
        .uri(URI.create("http://payments/charge"))
        .header("traceparent", "00-" + traceId + "-" + span.getSpanId() + "-01")
        .POST(HttpRequest.BodyPublishers.ofString(payload))
        .build();

    httpClient.send(request, HttpResponse.BodyHandlers.ofString());
    span.end();
}
Meanwhile, metrics work differently: instead of one record per event, a counter or histogram is incremented in memory, and only the aggregated value is periodically flushed (e.g., every 15 seconds) to the metrics backend. This is why metrics are so much cheaper than logs or traces at high volume — you’re storing one number per time bucket, not one line per event.
Data Flow & Lifecycle
Every request produces a small burst of telemetry that flows through the same set of stages. Understanding that path end‑to‑end makes it much easier to reason about cost, reliability, and where things can fail silently.
Request enters the system
A trace ID is generated (or extracted from an inbound header if it already came from an upstream caller).
Instrumentation fires
As code executes, spans open and close, log lines are written, and metric counters increment — all tagged with shared context (trace ID, service name, version).
Local buffering
The SDK batches telemetry in memory rather than making a network call for every single event, to avoid slowing down the app.
Export to collector
Batches are flushed periodically (e.g., every few seconds) to a local or sidecar collector process over gRPC or HTTP.
Sampling & processing
The collector may drop a percentage of “boring” traces (e.g., successful, fast requests) while keeping all error traces — this is called sampling.
Storage
Data lands in specialized stores: a time‑series database for metrics, a search index for logs, and a trace store for spans.
Query & alerting
Dashboards run continuous queries; alerting rules evaluate thresholds and page an engineer if something crosses a limit.
Human investigation
An engineer starts from an alert or metric anomaly, pivots to the relevant traces, and drills into logs for the exact failing request — closing the loop.
Advantages, Disadvantages & Trade‑offs
Observability is a genuine force‑multiplier for engineering teams, but it’s not free — both in dollars and in the discipline it requires. Both sides of the ledger are worth stating out loud.
Advantages
- Debug unpredicted, novel failures without shipping new code
- Faster incident resolution (lower MTTR)
- Enables data‑driven capacity planning and performance tuning
- Gives product teams insight into real user behavior, not just errors
- Builds trust in SLAs through measurable evidence
Disadvantages & costs
- Storage and processing cost can grow very large, very fast
- High‑cardinality data is expensive and can overwhelm naive backends
- Instrumentation adds a small amount of latency and code complexity
- Too many dashboards/alerts causes alert fatigue
- Sensitive data can leak into logs/traces if not carefully redacted
The central trade‑off in observability engineering is almost always fidelity vs. cost. Keeping 100% of traces gives perfect visibility but can cost a fortune at scale; sampling saves money but risks missing the one trace that would have explained a rare bug. Most mature organizations use “tail‑based sampling” — buffer everything briefly, then keep all traces that look interesting (errors, high latency) and only a small random sample of the rest.
Performance & Scalability
Observability systems have to handle firehoses of data — a large company can generate billions of log lines and trace spans per day. A few techniques keep this manageable:
- Sampling — as discussed, only keep a representative or intelligently‑selected subset of traces.
- Aggregation at the edge — pre‑compute histograms/percentiles inside the app or collector, rather than shipping every raw data point.
- Cardinality limits — metrics backends often reject or drop time series once a label combination explodes past a safe limit (e.g., accidentally using a raw user ID as a metric label can create millions of time series and crash a metrics database).
- Tiered storage — keep the last few hours of data on fast, expensive storage (like SSD‑backed indexes) and roll older data into cheaper, slower storage (like object storage / cold storage) with reduced resolution.
- Asynchronous, batched exporting — never block the request path on a network call to the observability backend; always buffer and flush in the background.
High Availability & Reliability
Here’s a paradox worth sitting with: your observability system needs to be more reliable than the systems it’s watching. If your main database goes down, that’s bad — but if your observability pipeline goes down at the same time, you’re now flying blind during the very incident where you need visibility most.
Don’t host your observability stack on the exact same infrastructure (same region, same cluster, same on‑call team’s blast radius) as the systems it monitors. A regional outage that takes down your app can also take down your dashboards — right when you need them.
Reliability practices for observability infrastructure mirror general distributed‑systems practices: redundant collectors across availability zones, replicated storage backends, buffering/local disk queues so a temporary backend outage doesn’t drop data, and independent alerting paths (e.g., a synthetic “heartbeat” check that pages someone if the monitoring system itself stops reporting).
Security
Telemetry data is a security surface in its own right. Logs and traces often accidentally capture sensitive information — passwords typed into a form that got logged during an error, credit card numbers embedded in a request body, or personal data in a stack trace.
- Redaction / scrubbing — automatically strip or mask known‑sensitive fields (SSNs, card numbers, tokens) before data is stored.
- Access control — not every engineer needs to see every field; restrict access to raw payloads versus aggregated metrics.
- Encryption in transit and at rest — telemetry pipelines should use TLS between every hop, and storage should be encrypted.
- Audit logging of the audit logs — track who queried what, especially in regulated industries (healthcare, finance).
- Retention limits — keeping data forever is both a cost problem and a compliance risk (e.g., under GDPR); define and enforce retention windows.
Monitoring, Logging & Metrics in Practice
Putting it together, here’s a simple Java example showing metrics, logs, and a trace span working side by side for one endpoint, using patterns similar to the OpenTelemetry API:
@RestController
public class OrderController {
    private static final Logger log = LoggerFactory.getLogger(OrderController.class);
    private final LongCounter ordersCounter;
    private final DoubleHistogram latencyHistogram;
    private final Tracer tracer;

    @PostMapping("/orders")
    public ResponseEntity<String> createOrder(@RequestBody Order order) {
        Span span = tracer.spanBuilder("create-order").startSpan();
        long start = System.nanoTime();
        try (Scope scope = span.makeCurrent()) {
            span.setAttribute("order.id", order.getId());
            span.setAttribute("order.amount", order.getAmount());

            log.info("Processing order {} for amount {}", order.getId(), order.getAmount());

            orderService.process(order);

            ordersCounter.add(1, Attributes.of(AttributeKey.stringKey("status"), "success"));
            return ResponseEntity.ok("created");
        } catch (Exception e) {
            span.recordException(e);
            log.error("Order {} failed", order.getId(), e);
            ordersCounter.add(1, Attributes.of(AttributeKey.stringKey("status"), "error"));
            return ResponseEntity.status(500).body("failed");
        } finally {
            long durationMs = (System.nanoTime() - start) / 1_000_000;
            latencyHistogram.record(durationMs);
            span.end();
        }
    }
}
Notice how all three pillars appear together: the log.info/log.error calls produce logs, ordersCounter and latencyHistogram produce metrics, and the Span produces a trace. Because they all fire within the same request and share the trace ID under the hood, an engineer can pivot seamlessly between them later.
Deployment & Cloud Considerations
In cloud‑native environments, observability is usually deployed as a sidecar or daemonset pattern in Kubernetes: an OpenTelemetry Collector runs alongside your application pods, receiving telemetry over localhost and forwarding it to a central backend — which might be self‑hosted (e.g., Prometheus + Grafana + Jaeger) or a managed SaaS vendor.
Managed cloud vendors (AWS CloudWatch/X‑Ray, Google Cloud Operations, Azure Monitor) offer built‑in observability that requires less setup but can be less flexible and, at scale, more expensive than a self‑hosted or hybrid open‑source stack. Most large organizations use a mix: cloud‑native basics for quick coverage, plus a dedicated observability platform (Datadog, Honeycomb, Grafana Cloud, New Relic, or self‑hosted OpenTelemetry + Prometheus + Grafana + Loki + Tempo) for depth.
APIs, Microservices & Design Patterns
In a microservices architecture, a single user action can fan out into dozens of internal API calls. Without distributed tracing, this fan‑out is invisible — engineers can only see their own service’s slice of the story.
Common design patterns:
- Correlation ID propagation — every service must forward the trace/correlation ID on every outbound call, including through message queues, not just synchronous HTTP.
- Structured logging — logging as JSON key‑value pairs (not free‑form text) so logs can be indexed, filtered, and joined with metrics and traces programmatically.
- The “four golden signals” pattern (from Google’s SRE book) — for every service, track latency, traffic, errors, and saturation as your baseline metric set.
- RED / USE methods — RED (Rate, Errors, Duration) for request‑driven services; USE (Utilization, Saturation, Errors) for resources like CPU or disk.
Anti‑patterns to avoid:
- Logging unstructured strings that can’t be parsed or queried later
- Using unbounded, high‑cardinality values (like raw user IDs) as metric labels
- Instrumenting only the “happy path” and forgetting error and timeout branches
- Treating observability as an afterthought bolted on after an incident, instead of a first‑class part of system design
Best Practices & Common Mistakes
Six habits show up over and over in teams that reliably ship observable systems — and one common mistake shows up in nearly every team that thinks they’re observable but really just have “lots of dashboards.”
Instrument early
Add tracing and structured logging when you write a service, not after your first 3am outage.
Use semantic conventions
Follow OpenTelemetry’s standard attribute names (e.g., http.status_code) so tools and teams stay consistent.
Alert on symptoms, not causes
Page on “users are seeing errors,” not “CPU is at 85%” — the latter isn’t always a real problem.
Set retention deliberately
Keep high‑fidelity data briefly, downsample or discard it as it ages, to control cost.
Practice using your tools
Run game days / chaos exercises so engineers are fluent in the dashboards before a real incident.
Review dashboards regularly
Stale, noisy dashboards erode trust — prune and update them as systems evolve.
Treating “we have a lot of dashboards” as equivalent to “we have observability.” Volume of data isn’t the goal — the ability to answer an unanticipated question quickly is the goal.
Real‑World / Industry Examples
A short walk through the companies whose engineering practices shaped how the rest of the industry thinks about observability today.
- Netflix built extensive internal observability tooling to track the health of thousands of microservices streaming to hundreds of millions of devices — using tracing to pinpoint which of many internal services caused a playback failure.
- Uber created Jaeger, a widely‑used open‑source distributed tracing system, originally to debug fan‑out latency issues across its ride‑matching microservices, and later donated it to the Cloud Native Computing Foundation.
- Google’s Dapper paper (2010) on large‑scale distributed tracing directly inspired most modern tracing systems, including Jaeger and Zipkin, and its SRE practices popularized SLIs/SLOs and the “four golden signals.”
- Amazon operates at a scale where even a fraction‑of‑a‑percent error rate affects millions of orders; its internal tooling emphasizes automated anomaly detection layered on top of metrics, since no human can watch every dashboard.
- Honeycomb (a company, not just a tool) helped popularize the modern definition of “observability” for software, emphasizing high‑cardinality, high‑dimensionality event data over pre‑aggregated dashboards.
Frequently Asked Questions
Five questions that come up almost every time an engineering team first commits to taking observability seriously.
Is observability just a rebranding of monitoring?
No. Monitoring is a subset of observability. Observability includes monitoring, but adds the ability to explore and ask new questions about data you didn’t predict you’d need in advance.
Do I need all three pillars (logs, metrics, traces) to have “observability”?
Not strictly, but each pillar covers a blind spot the others don’t. Metrics alone can tell you something is wrong, but not why; traces alone are expensive to query in aggregate; logs alone are hard to correlate across services without a trace ID linking them together.
What is OpenTelemetry, exactly?
An open‑source, vendor‑neutral standard (APIs, SDKs, and a collector) for producing and exporting telemetry. Its goal is to let you instrument your code once and send data to any compatible backend, avoiding vendor lock‑in.
How much should observability cost?
There’s no universal number, but many teams budget observability spend as a meaningful fraction of overall infrastructure cost — and it grows with cardinality and retention choices, which is why sampling and retention policy matter so much.
Can small applications skip observability?
A single small service with simple logs might not need a full pipeline. But observability habits (structured logging, basic metrics) are cheap to build in early and expensive to retrofit once a system grows complex.
Summary & Key Takeaways
Observability is less a product you buy and more a stance you take toward your own systems: assume they will surprise you, and build them so those surprises are answerable in minutes instead of hours.
Key takeaways
- Observability is the ability to understand a system’s internal state from its external outputs — and, critically, to ask new, unanticipated questions without shipping new code.
- It rests on three pillars — logs, metrics, and traces — each suited to different kinds of questions.
- Distributed tracing and context propagation (trace IDs) are what let engineers follow a single request across dozens of microservices.
- The central engineering trade‑off is fidelity versus cost, managed through sampling, aggregation, and retention policy.
- Observability infrastructure itself needs to be highly available and secure — it’s the safety net you rely on precisely when everything else is failing.
- OpenTelemetry has become the industry‑standard way to instrument applications in a vendor‑neutral way.
- Good observability isn’t about collecting more data — it’s about being able to answer the question you didn’t know you’d need to ask.