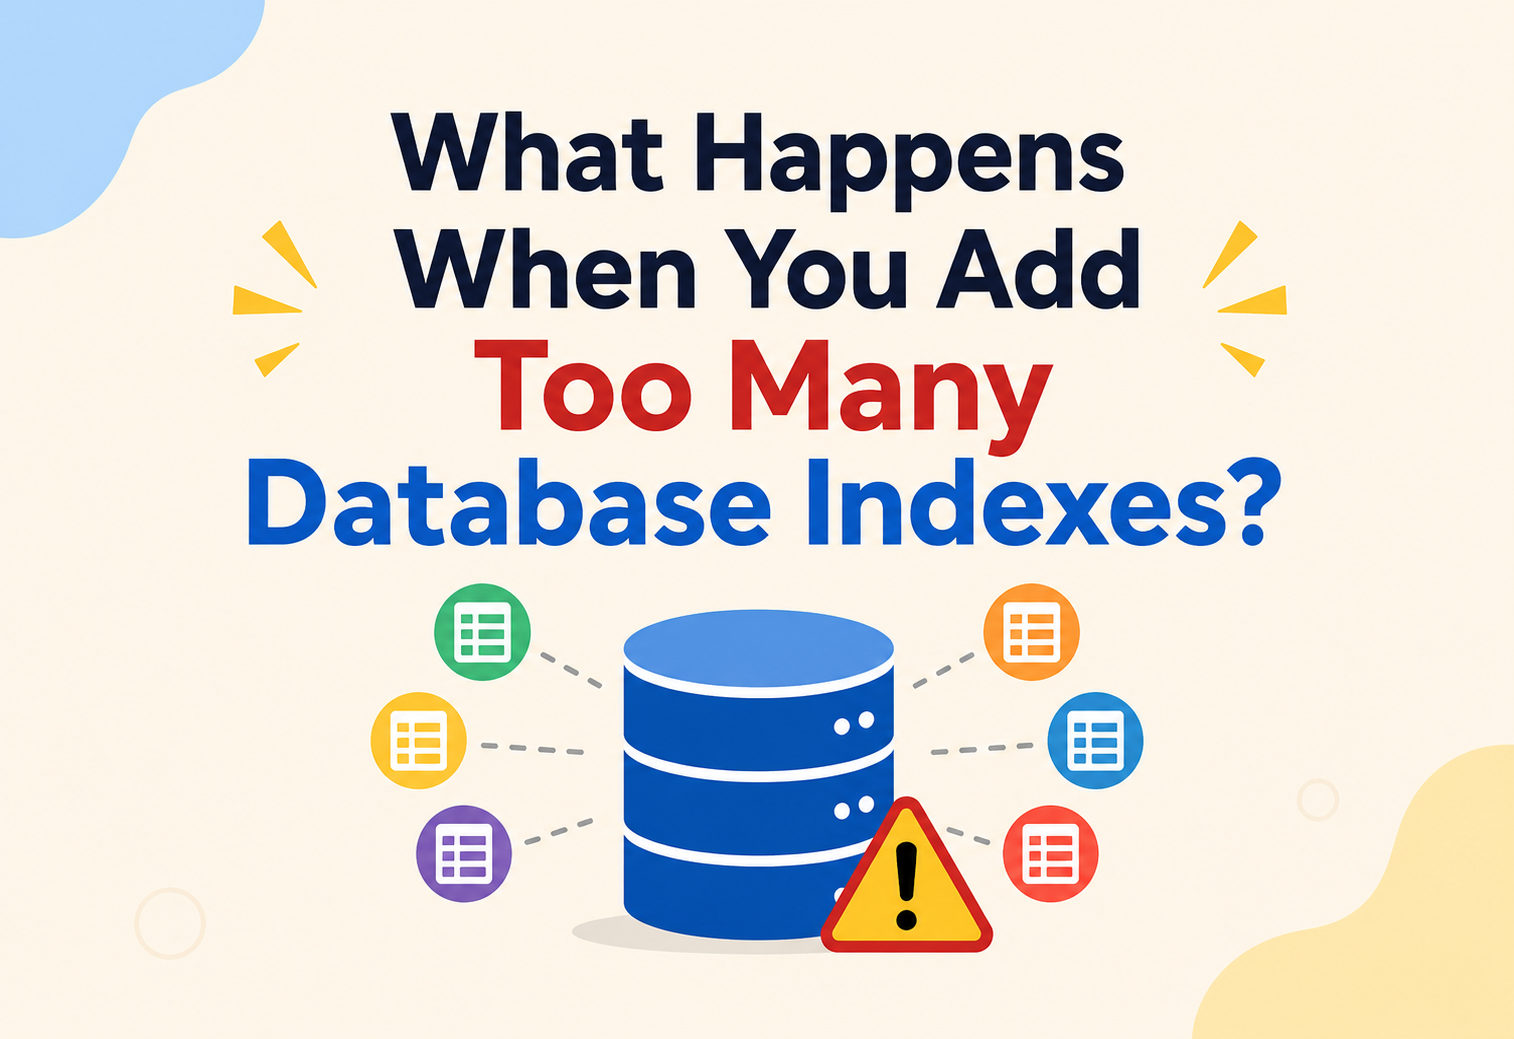
What Happens When You Add Too Many Database Indexes?
Indexes make reading data fast. But every index you add is a promise your database has to keep forever — on every single write. This tutorial explains, from first principles, exactly what that promise costs, why teams accidentally end up with 20 or 30 indexes on the same table, and how to find and safely remove the ones that stopped earning their cost.
What an Index Really Is (and Why It Existed Before Computers)
Before we can understand what goes wrong with too many indexes, we need to be completely sure what an index is and why humans invented them long before computers existed.
What it is
A separate, sorted structure that stores a copy of some columns from a table, plus a pointer back to the full row, so the database can find rows without scanning the whole table.
Why it exists
Reading through every row to find one matching row is slow once a table has millions of rows. An index lets the database jump almost straight to the answer.
Where it’s used
Every serious relational database (PostgreSQL, MySQL, Oracle, SQL Server) and most NoSQL databases (MongoDB, Cassandra, DynamoDB) support indexes.
Imagine a school library with 20,000 books, all shelved by the order they arrived — no order at all. If you want the book “Charlotte’s Web”, you would have to walk down every shelf, checking every single book, until you find it. That could take an hour. Now imagine the librarian keeps a small card catalog box at the front desk. Each card has a book title, sorted alphabetically, with a note like “Shelf 14, Row 3”. Now finding “Charlotte’s Web” takes ten seconds: you flip to the “C” cards and read the shelf number. That card catalog box is a database index. It is not the books themselves — it’s a small, sorted, extra copy of just the title and its location, built purely to make searching fast.
A Short History
The idea of an index is far older than computers. Books have had back-of-the-book indexes for centuries, and libraries have used card catalogs since the 1780s. The idea is always the same: build a smaller, sorted, searchable summary of a bigger, unsorted collection.
When relational databases were invented in the 1970s (starting with IBM’s System R and the first commercial version, Oracle, in 1979), engineers borrowed this exact idea. Early databases used simple sorted-file indexes. By the 1980s, the B-Tree (and its variant, the B+Tree) became the standard index structure, because it stays balanced and fast even as data grows into the millions or billions of rows. Almost every modern relational database still uses B+Trees as its default index type today, more than 40 years later — a rare case of a 1970s data structure still being state-of-the-art in production systems in 2026.
Indexes were an unambiguous win at first: add an index, queries get faster, everyone is happy. But as applications grew and teams got bigger, a second-order problem appeared: teams kept adding more and more indexes, one for every new query pattern, without ever removing old ones. Eventually, some tables had 15, 20, even 40 indexes. That’s when engineers started noticing that writes were getting slower, storage costs were climbing, and the query planner was sometimes making worse choices, not better ones. This tutorial is about understanding exactly why that happens, and what the tools and habits are for keeping a system’s indexing healthy over the long haul rather than accidentally letting it decay.
Why This Topic Deserves Its Own Deep Tutorial
Reads want more indexes; writes want fewer. These two goals pull in opposite directions on every table, in every serious application, forever.
Here is the core tension every database engineer eventually runs into:
- Reads want more indexes. Every new way you query a table (by email, by date, by status, by user ID and date together) can be made faster with a matching index.
- Writes want fewer indexes. Every
INSERT,UPDATE, orDELETEhas to update every single index on that table, not just the table itself.
These two goals pull in opposite directions. A table with zero indexes has blazing-fast writes and painfully slow reads. A table with thirty indexes has blazing-fast reads for thirty different query patterns — and painfully slow, resource-hungry writes. Somewhere in between is the right balance, and finding it is one of the most common real-world decisions a backend engineer or database administrator makes.
New engineers often learn “indexes make queries fast” and stop there. So whenever a query is slow, the instinctive fix is: add an index. Done enough times, a table quietly grows 10, 20, or 30 indexes, most of which are barely used. The table still looks fine in read benchmarks, but write latency, replication lag, storage bills, and backup times have all been silently getting worse for months. This is exactly the problem this tutorial unpacks.
This isn’t a rare, academic concern. It is one of the most frequently asked database performance questions in real interviews, and one of the most common root causes discovered in production incident post-mortems at companies large and small. Understanding it well is genuinely useful, not just theoretical — the difference between a team that ships smoothly at scale and one that ends up in an unplanned emergency “why is the database on fire again” conversation every quarter is very often precisely how well they manage this trade-off over time.
Tables, Rows, Indexes and the B-Tree
The building blocks we need before we can talk about downsides: tables, rows, indexes, and the B-Tree that makes them fast.
3.1 The Table (a.k.a. the “Heap”)
A database table is just a big collection of rows, usually stored on disk in the order they were inserted (this raw storage is often called the heap). Finding one row in the heap, without help, means checking rows one at a time — called a full table scan.
Picture a spreadsheet of 1 million customers with columns id, name, email, city. If you ask “find the customer whose email is ana@example.com”, and there is no index on email, the database has to read all 1 million rows, one by one, checking the email column each time. That’s a full table scan — slow.
3.2 The Index
An index is a second, smaller structure that stores a sorted copy of one or more columns, plus a pointer (called a row identifier or RID, or in PostgreSQL a TID) back to the exact row in the heap. Because it is sorted, the database can use fast search techniques (like binary search, or more precisely a B-Tree lookup) instead of checking every row.
-- Without an index, this scans all 1,000,000 rows
SELECT * FROM customers WHERE email = 'ana@example.com';

-- Create an index to make it fast
CREATE INDEX idx_customers_email ON customers(email);

-- Now the same query jumps almost straight to the row
SELECT * FROM customers WHERE email = 'ana@example.com';
3.3 The B-Tree (and B+Tree)
Almost every relational database index is built on a B-Tree or its close cousin, the B+Tree. This is a tree data structure where:
- Every node can hold many keys (not just 2, like a binary tree) — often hundreds.
- The tree stays balanced: every path from the root to a leaf is the same length.
- Leaf nodes are linked together in sorted order, so range queries (
WHERE age BETWEEN 20 AND 30) are efficient.
45, the database compares it against the root (30, 60), goes right of 30 and left of 60, lands on Node B, then finds 45 in the leaf 42, 45. That’s 3 steps instead of checking every value — and this advantage grows dramatically as the table grows, because a B-Tree’s depth grows only logarithmically with row count.A B-Tree is like the guide signs in a huge shopping mall. You don’t wander into every store; you read the directory sign (“Floor 1: Shops A–M, Floor 2: Shops N–Z”), walk to the right floor, read the next sign, and arrive in just a few steps. Each “sign” is a tree node, narrowing your search every time.
3.4 Types of Indexes You Should Know
| Index Type | Best For | Notes |
|---|---|---|
| B-Tree (default) | Equality and range queries (=, <, BETWEEN, ORDER BY) | The default in PostgreSQL, MySQL InnoDB, SQL Server |
| Hash Index | Pure equality lookups (= only) | Cannot support range queries or sorting |
| Composite (Multi-column) | Queries filtering on 2+ columns together | Column order matters a lot |
| Unique Index | Enforcing uniqueness (e.g. email) | Also speeds up lookups as a side effect |
| Full-Text Index | Searching inside text (LIKE '%word%', text search) | Special structure, e.g. inverted index |
| Partial / Filtered Index | Indexing only a subset of rows | Smaller and cheaper than a full index |
| Covering Index | Answering a query using only the index, no heap lookup | Includes extra columns purely to avoid a table hit |
Every one of these index types, no matter how clever, shares the same fundamental cost: it is extra data that must be kept in sync with the table, forever, on every write. That single sentence is the seed of everything we cover in the rest of this tutorial.
How Indexes Physically Sit Alongside Your Table
Indexes are not a “view” on the table or a shortcut inside it — they are separate, physically-stored data structures that live next to the heap and must be written to on every change.
Key components involved:
Heap / Table
The actual row data, physically stored on disk (or in memory-mapped pages).
Index Structure
Usually a B+Tree, stored as its own separate set of disk pages, completely apart from the table’s pages.
Buffer Pool / Page Cache
An in-memory cache of recently used disk pages, shared between the table and all of its indexes. More indexes competing for the same cache means less room for each one.
Write-Ahead Log (WAL)
A log every change is written to first, for crash recovery. Every index update also generates its own WAL entries.
Query Planner / Optimizer
The component that decides, for a given query, whether to use an index (and which one) or scan the table directly.
Notice that none of these components is optional in a real production database — they are the price of admission for correct, durable, high-performance storage. Every one of them, however, does more work as the index count on a table grows, and that compounding is what makes the “too many indexes” problem show up simultaneously in several very different-looking dashboards (CPU, memory, disk I/O, replication lag) rather than in one obvious place.
Step by Step, What a Single Insert Actually Costs
What actually happens, step by step, when you insert one row into a heavily indexed table — and why it is never just “one write”.
INSERT that the application sees as “one write” actually triggers one heap write plus one write per index, each with its own log entry and possible page rebalancing. This is why more indexes directly means slower, heavier writes.5.1 B-Tree Rebalancing During Writes
Each index is not just “add one line to a list.” A B-Tree node can only hold a limited number of keys. When a node becomes full and a new key needs to go in, the database must split that node into two, and update the parent node to point to both. This can cascade upward, splitting parent nodes too. This is more CPU and disk work than it sounds like, and it happens independently, in every index, for every write that touches an indexed column.
Picture 10 different card catalog boxes at the library (one sorted by title, one by author, one by genre, one by publish year…). Every time a new book arrives, the librarian doesn’t just shelve the book once — she has to walk to all 10 boxes and insert a new card in the correct alphabetical/numerical spot in each one. If a box is already full of cards, she has to shift many other cards to make room. Ten boxes means ten times the filing work for every single new book, even though the book itself was shelved just once.
5.2 Updates and Deletes Are Just As Expensive
People often think only INSERT is affected, but:
- UPDATE on an indexed column must remove the old index entry and insert a new one, in every affected index (in some engines like PostgreSQL, an update to any column can force new versions of index entries too, due to MVCC — more in section 6).
- DELETE must remove entries from every index, or at least mark them for later cleanup.
PostgreSQL uses a technique called MVCC (Multi-Version Concurrency Control), where an UPDATE doesn’t overwrite a row in place — it writes a brand-new row version and marks the old one as expired. If any indexed column changed, every index on the table needs a new entry pointing at the new row version (PostgreSQL has an optimization called HOT, Heap-Only Tuples, that can skip this in some cases — but only when no indexed column changed and there’s room on the same page). More indexes on a table directly reduces how often HOT updates can be used, making ordinary updates heavier.
One Write to Disk, One Read Through the Planner
Following one write request from the application all the way to disk, and one read request through the query planner — so the full lifecycle of an index becomes concrete rather than abstract.
Lifecycle of an Index, End to End
CREATE INDEX scans the whole table once and builds the B-Tree. On a large table, this can take minutes to hours and (unless done with CONCURRENTLY in PostgreSQL or ALGORITHM=INPLACE in MySQL) can lock the table.VACUUM, or an index rebuild).DROP INDEX, ideally done only after confirming (via monitoring, covered in Section 12) that the index truly has zero real usage.The Real Costs of an Extra Index, Enumerated
This is the heart of the tutorial. Each downside below is explained with a beginner analogy, a concrete example, and a production angle — because the point is not to scare anyone off indexes, it is to make the invisible costs visible.
7.1 Slower Writes (Write Amplification)
What it is
Every INSERT, UPDATE, or DELETE must update every index on the affected columns, not just the table itself.
Why it happens
Indexes are separate, sorted structures. They don’t update themselves — the database engine must explicitly write to each one, keeping it in sync with the table.
Suppose inserting one row into a table with no indexes takes 1 unit of work. With 5 indexes on that table, the same insert now does roughly 6 units of work: 1 for the table, 1 for each index (in reality, it’s often worse than 1:1 per index because of B-Tree page splits). If your application does 10,000 inserts per second, that “small” per-row overhead becomes a very real, very measurable slice of your total database CPU and disk I/O.
Production Angle
High-write systems like ride-sharing trip logs (Uber), ad-click tracking, or IoT sensor ingestion pipelines are extremely sensitive to this. Teams at these kinds of companies deliberately keep hot, high-throughput tables index-light, and instead copy data into a separate, heavily indexed read replica or analytics store for reporting queries — precisely so write-path tables aren’t burdened by index maintenance.
7.2 More Disk Storage
What it is
Each index is its own copy of some columns, plus internal B-Tree bookkeeping (pointers, node overhead). It takes real, separate disk space, in addition to the table itself.
Why it happens
An index isn’t a “view” or a shortcut with no cost — it’s a genuinely stored, duplicated, sorted data structure.
A table might be 50 GB of raw data. If it has 10 indexes, each roughly 4–8 GB depending on the indexed columns, the indexes alone can add another 40–80 GB — sometimes making the total storage footprint larger than the table itself. This is not rare; wide composite indexes on large tables regularly exceed the size of the base table.
Production Angle
Cloud databases (AWS RDS, Aurora, Google Cloud SQL) bill for storage, IOPS, and backup storage. Bloated indexes directly increase the monthly bill. It’s common for a cost-optimization review at a mid-size company to find that dropping a handful of unused indexes shrinks storage costs by 20–40% with zero impact on any real query.
7.3 Slower Backups, Restores, and Replication
What it is
Backups typically must copy index data too (or rebuild indexes during restore). Replication must ship every index change to every replica.
A logical backup restore (e.g. pg_restore) that rebuilds indexes from scratch after loading data can take significantly longer with many indexes — sometimes doubling or tripling total restore time compared to a lean, well-indexed table.
Production Angle
During a disaster recovery drill, restore time (often tracked as RTO, Recovery Time Objective) is a hard business number — “we must be back online within 30 minutes.” Excess indexes directly threaten that SLA by making restores slower, exactly when speed matters most.
7.4 Buffer Pool / Cache Pollution
What it is
Databases keep frequently used disk pages in a limited amount of RAM (the buffer pool / page cache) to avoid slow disk reads. Index pages compete for this same limited memory.
Imagine your desk can only hold 10 books at once (that’s your RAM). If you keep 10 different card catalog boxes on your desk too, you now have less room for the actual books you’re reading. You’ll spend more time walking to the shelf (disk) to fetch books that got pushed off your desk, simply because the catalog boxes are hogging the space.
A server with 32 GB of RAM dedicated to caching might comfortably cache a 20 GB table. But if that table also has 25 GB of indexes competing for the same 32 GB cache, some of that data — table pages, index pages, or both — gets evicted and has to be re-read from slower disk more often, increasing average query latency across the board, even for queries that don’t use the bloated indexes.
7.5 Query Planner Confusion
What it is
With many overlapping or similar indexes, the query optimizer has more choices to evaluate, and more chances to misjudge which index is actually fastest for a given query.
Suppose a table has these three indexes: (status), (status, created_at), and (status, user_id, created_at). A query filtering by status and sorting by created_at could technically use any of the three. The planner must estimate the cost of each using table statistics, and if those statistics are out of date (common after a big bulk load or delete), it can pick a much slower index than the ideal one — sometimes 10× or 100× slower than the best choice, purely because it had too many similar-looking options and imperfect statistics to choose between them.
Production Angle
This is a well-known root cause of the “it was fast yesterday, it’s slow today with no code changes” class of incidents. The data didn’t change dramatically — the planner simply flipped to a different, worse index plan. Teams running Postgres or MySQL in production often keep an eye on EXPLAIN ANALYZE plan changes for exactly this reason.
7.6 Lock Contention and Concurrency Overhead
What it is
While an index page is being updated (especially during a B-Tree split), the database may briefly lock that page. More indexes means more places locks can be taken, held, and waited on.
Under heavy concurrent write load (many application threads inserting at once), if several transactions are trying to update the same “hot” region of an index at the same time (for example, an index on a rapidly increasing created_at timestamp, where all new rows land on the same rightmost B-Tree page), they can queue up waiting for each other. More indexes multiply the number of these hot spots.
7.7 Slower Schema Changes and Maintenance Windows
Adding a column, changing a data type, or running large maintenance operations (like VACUUM FULL in PostgreSQL or OPTIMIZE TABLE in MySQL) often has to account for, rebuild, or re-validate every index on the table. More indexes directly means longer maintenance windows and longer application downtime or degraded performance during those windows.
7.8 CPU Cost of Statistics Collection
Query planners rely on statistics (row counts, value distributions) about both tables and indexes to make good decisions. Databases periodically recompute these statistics (e.g. PostgreSQL’s ANALYZE, auto-triggered by autovacuum). More indexes means more statistics objects to compute and refresh, adding background CPU load that competes with your actual application traffic.
The Balanced Picture — Indexes Are Not the Enemy
To be fair, indexes are not the enemy — the enemy is excess, unmanaged indexes. Here is the balanced picture, side by side.
| Aspect | Few / No Indexes | Well-Chosen Indexes | Too Many Indexes |
|---|---|---|---|
| Read speed | Slow (full scans) | Fast for common queries | Fast for covered queries, but planner overhead grows |
| Write speed | Very fast | Slightly slower, acceptable | Significantly slower |
| Storage cost | Minimal | Moderate, justified | High, often larger than the table |
| Cache efficiency | High (small footprint) | Good | Poor (cache thrashing) |
| Planner decisions | Trivial (few options) | Reliable | More error-prone, plan instability |
| Maintenance windows | Short | Reasonable | Long |
| Operational complexity | Low | Low-Medium | High (hard to know what’s safe to drop) |
Indexes are a trade of write cost and storage cost in exchange for read speed. The goal is never “zero indexes” or “maximum indexes” — it’s matching the number and shape of indexes to your table’s actual, measured query patterns, and periodically removing indexes that stopped earning their cost.
Where indexes clearly pay off
- Tables read far more often than written (typical for reference data, catalogs, historical archives).
- Queries that filter by a highly selective column, so the index dramatically narrows the search.
- Constraint enforcement (unique, primary key) where an index is required anyway.
Where indexes stop paying off
- Tables that are overwhelmingly write-heavy (event logs, telemetry, high-frequency ingestion).
- Low-cardinality columns where the planner rarely finds using the index worthwhile.
- Query patterns that stopped being used after a feature was removed — but the index was never dropped.
How the Problem Grows With Data Volume and Traffic
How this problem changes shape as data volume and traffic grow — and why it compounds nastily at scale rather than staying constant.
The relationship between index count and write latency is roughly linear at low index counts, then gets worse as more indexes compete for the same cache and the same disk I/O bandwidth. A rough mental model many engineers use:
At scale, this problem compounds with two more factors:
- Sharding / Partitioning: if a table is partitioned across multiple physical shards (a common pattern at companies like Netflix, Uber, and Amazon), every index typically must be maintained per shard. Ten indexes on a table sharded into 50 pieces means 500 index structures being kept alive across the fleet.
- Replication: every index change on a primary database node must also be applied on every read replica. More indexes means more replication log volume, which can widen replication lag — the delay between a write happening on the primary and becoming visible on replicas.
How Excess Indexing Quietly Threatens Uptime
How excess indexing quietly threatens uptime, not just speed — and why maintenance debt on indexes eventually becomes an availability problem in disguise.
- Replication lag: as covered above, more index writes mean more work replicas must replay, which can push read replicas further behind the primary — risking stale reads in read-replica-backed applications.
- Failover risk: during a failover (a replica getting promoted to primary), if that replica was lagging due to heavy index write load, the promotion can lose recent writes or take longer to complete safely.
- Long-running index builds blocking availability: building a new index on a huge table without using a non-blocking mode (like PostgreSQL’s
CREATE INDEX CONCURRENTLY) can lock the table for writes for the whole build, effectively causing an outage. - Vacuum/cleanup falling behind: in PostgreSQL, if
autovacuumcan’t keep up with the write and bloat rate across many indexes, table and index bloat can grow unchecked, eventually causing severe performance degradation or, in extreme neglected cases, transaction ID wraparound risk.
A common production incident pattern: a table accumulates indexes over 2 years of feature development. Write volume grows. Autovacuum (or the equivalent maintenance process) can no longer keep up with cleaning up dead index entries fast enough. Index bloat grows silently. Query latency climbs slowly over weeks. Eventually a peak-traffic event (a sale, a viral moment) pushes write latency past an acceptable threshold, and the service becomes unresponsive — not because of a code bug, but because of years of unmanaged index growth.
Security-Adjacent Implications Worth Knowing
Indexing is mostly a performance topic, but it has a couple of real security-adjacent implications worth knowing when doing threat modeling or compliance reviews.
- Data duplication risk: an index on a sensitive column (like a national ID number or email) creates another physical copy of that data on disk. Encryption-at-rest and access controls must cover index files too, not just table files — easy to overlook.
- Timing side channels (rare, theoretical): in specific, unusual setups, the presence or absence of an index can change query timing in ways that could leak information about data existence — a minor concern mostly relevant to security-sensitive systems doing careful threat modeling, not typical applications.
- Availability as a security property: excessive indexes degrading write performance can make a service more vulnerable to being overwhelmed by legitimate traffic spikes or write-heavy abuse patterns, which is a denial-of-service-adjacent concern.
Finding Out Which Indexes Actually Earn Their Cost
You cannot manage what you don’t measure. Here’s how real teams find out which indexes are helping and which are just costing money.
12.1 Finding Unused Indexes
Most production databases expose statistics views for exactly this purpose.
SELECT
    schemaname,
    relname AS table_name,
    indexrelname AS index_name,
    idx_scan AS times_used,
    pg_size_pretty(pg_relation_size(indexrelid)) AS index_size
FROM pg_stat_user_indexes
WHERE idx_scan < 50
ORDER BY pg_relation_size(indexrelid) DESC;
This query lists indexes ordered by size, filtered to ones used fewer than 50 times since the last statistics reset. Large, rarely-used indexes are prime candidates for removal.
SELECT
    object_schema, object_name, index_name,
    count_star AS times_used
FROM performance_schema.table_io_waits_summary_by_index_usage
WHERE index_name IS NOT NULL
ORDER BY count_star ASC
LIMIT 20;
12.2 Key Metrics to Track
| Metric | What it tells you |
|---|---|
| Index scan count (per index) | Is this index actually being used by any query? |
| Write latency (p50/p95/p99) | Trending upward over time as indexes are added is a red flag |
| Index size / table size ratio | Indexes larger than the table itself deserve scrutiny |
| Buffer cache hit ratio | Falling hit ratio can indicate cache pollution from index bloat |
| Replication lag | Rising lag can be a symptom of write-path overhead, including index maintenance |
| Bloat estimate (dead tuples) | How much wasted space is in tables/indexes needing cleanup |
| Plan stability (query plan changes) | Frequent plan flips can indicate planner confusion from overlapping indexes |
12.3 Tracing a Slow Write
Tools like EXPLAIN (ANALYZE, BUFFERS) in PostgreSQL, or slow query logs in MySQL, combined with application-level distributed tracing (e.g. OpenTelemetry spans around database calls), let engineers see exactly how long a write spends and correlate spikes with deployments that added new indexes.
How Managed Cloud Databases Change (and Sometimes Hide) the Problem
How managed cloud databases change (and sometimes hide) this problem — and where the cost signal actually shows up on the bill.
- Provisioned IOPS billing: services like AWS RDS/Aurora, Azure SQL, and Google Cloud SQL often charge based on IOPS or throughput tiers. Excess index writes directly increase IOPS consumption and therefore cost.
- Storage auto-scaling: cloud databases that auto-grow storage can silently absorb index bloat for a long time, hiding the problem until the monthly bill spikes.
- Managed index advisors: many cloud providers now offer index recommendation tools (e.g. Azure SQL Database’s automatic tuning, AWS’s Performance Insights combined with recommendations) that suggest both adding and removing indexes based on real workload data — a modern best practice compared to manually guessing.
- Serverless databases: in serverless/auto-scaling database tiers (e.g. Aurora Serverless, PlanetScale), write amplification from excess indexes can trigger unnecessary scale-up events, increasing cost even more directly and visibly than in traditional fixed-capacity deployments.
Where This Issue Meets the Rest of the Production Stack
How this issue interacts with the rest of a typical production data stack — and why architectural tricks often beat “just add one more index” on the primary.
- Application caching (Redis/Memcached): a common and effective way to reduce pressure to add more database indexes is to cache frequently-read results in an external cache. If most reads are served from Redis, the database doesn’t need an index for every possible read pattern — only for the patterns that actually hit the database.
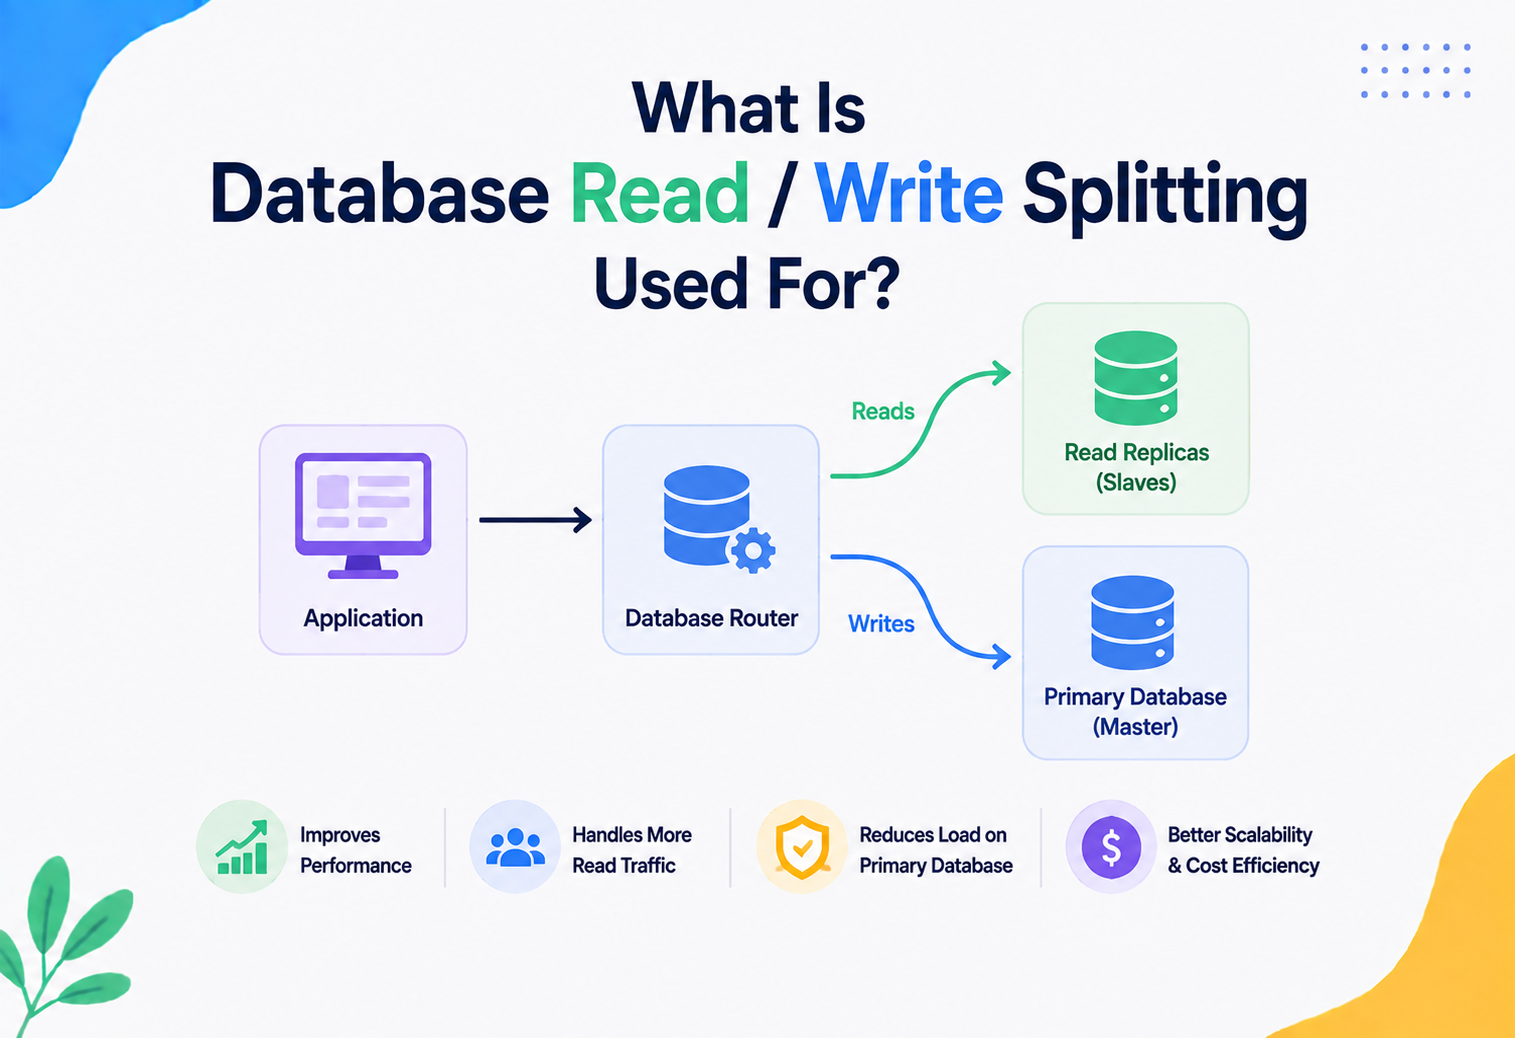
- Read replicas + load balancing: read-heavy, differently-indexed workloads can be routed to dedicated read replicas (sometimes with extra indexes not present on the primary, in databases that support it), keeping the write-serving primary lean.
- CQRS pattern (Command Query Responsibility Segregation): a more advanced architecture where writes go to a lean, minimally-indexed write model, and a separate, heavily-indexed (or even a different database technology, like Elasticsearch) read model is built asynchronously for complex queries. This directly sidesteps the “too many indexes” problem by never putting all indexes on the same table that receives all the writes.
Shapes That Help, Shapes That Bite
Certain shapes of indexing keep working in real production; certain other shapes keep causing incidents. Giving them names lets a team diagnose a problem in a hallway conversation rather than in a two-hour meeting.
Good Patterns
- Composite index consolidation: replacing three separate single-column indexes with one well-ordered composite index that can serve all three query patterns.
- Covering indexes for hot queries: adding extra columns to an index (an
INCLUDEclause in PostgreSQL/SQL Server) so a critical, frequent query never has to touch the table at all — a deliberate, measured trade-off, not a guess. - Partial indexes: indexing only the relevant subset of rows (e.g.
WHERE status = 'active') instead of the whole table, cutting index size and write overhead dramatically when most rows don’t matter for that query. - Regular index audits: a recurring (e.g. quarterly) review of index usage statistics, removing anything with near-zero real usage.
Anti-patterns
Adding an index for every column “just in case,” without checking whether any real query actually needs it. This is the single most common cause of index bloat.
Indexes get added when a feature ships, but nobody ever revisits them after the feature changes or is removed. Dead indexes accumulate for years.
Having both (user_id) and (user_id, created_at) is usually redundant — the second index can already serve any query the first one serves, because a composite index on (user_id, created_at) is also efficiently searchable by user_id alone.
An index on (created_at, user_id) is far less useful for a query filtering mainly by user_id than an index ordered (user_id, created_at). Wrong ordering can make an expensive index nearly useless, wasting all its write and storage cost for little read benefit.
Habits That Keep Indexing Healthy Long-Term
The gap between teams that stay healthy over time and teams that firefight the database every quarter is rarely one clever trick — it’s a small set of habits, practiced consistently.
- Add an index only in response to a real, measured slow query — not speculation.
- Prefer one well-designed composite index over several narrow, overlapping ones.
- Review index usage statistics on a regular cadence and drop what’s unused.
- Use
EXPLAIN ANALYZEbefore and after adding an index to confirm it’s actually chosen and actually helps. - Build large indexes with non-blocking options (
CONCURRENTLYin PostgreSQL) to avoid outages. - Consider partial and covering indexes to get read benefits at a fraction of the storage/write cost.
- Separate write-heavy and read-heavy workloads (via replicas, caching, or CQRS) instead of piling every index onto one primary table.
- Track write latency trends over time, not just at a single point — slow creep is easy to miss without historical metrics.
- Adding a new index for every new feature’s query without checking if an existing index already covers it.
- Indexing low-cardinality columns (like a boolean
is_activeflag on a huge table) where the index barely narrows down the search and rarely gets chosen by the planner. - Forgetting that a unique constraint or foreign key often silently creates an index too — teams sometimes don’t realize how many indexes they actually have.
- Never revisiting old indexes after query patterns change.
- Testing index changes only on a small development database, where the cost differences are invisible, then being surprised in production at real scale.
How the Giants Actually Handle Indexing at Scale
Every large-scale operator has confronted this trade-off. A quick tour of how a few well-known companies handle it, followed by a hands-on Java demo you can run on your own machine to feel the cost yourself.
Netflix
Netflix’s data architecture famously separates services with very different read/write characteristics into different specialized data stores rather than one giant, over-indexed relational database. Highly write-heavy telemetry and event data goes into systems optimized for ingestion, while more structured, query-heavy data lives in stores tuned for that purpose — avoiding forcing a single schema to carry every possible index for every use case.
Uber
Uber’s trip and location-tracking systems are extremely write-heavy (constant GPS pings, trip state updates). Uber’s engineering blog has discussed schema and index design choices specifically aimed at keeping hot, high-frequency-write tables lean, pushing complex analytical querying needs into separate downstream systems instead of adding more and more indexes directly on the live transactional tables.
Amazon
Amazon’s DynamoDB (a NoSQL database originally built to solve scaling problems Amazon hit with traditional relational indexing at massive scale) makes secondary indexes an explicit, limited, deliberately-provisioned resource — each Global Secondary Index has its own provisioned throughput and storage cost that engineers must consciously plan for, making the “just add another index” temptation much more visible and controlled than in a typical relational setup where indexes can be added freely without an obvious cost signal.
Common pattern: index audits
Many mid-size and large engineering organizations run a periodic (“index audit” or “database hygiene”) review process, often quarterly, where database administrators or backend teams review index usage statistics across production databases and remove indexes with negligible usage. This is considered a routine, expected part of running a healthy relational database at scale, similar to code refactoring or dependency cleanup.
A Small Java Demonstration
A short JDBC example that measures insert throughput before and after adding several indexes, so the write-cost effect becomes something you can see with your own eyes, not just read about.
import java.sql.*;

public class IndexWriteCostDemo {

    public static void main(String[] args) throws Exception {
        String url = "jdbc:postgresql://localhost:5432/demo";
        try (Connection conn = DriverManager.getConnection(url, "postgres", "password")) {

            setupTable(conn, false); // no extra indexes
            long noIndexTime = timeInserts(conn, 20_000);
            System.out.println("Insert time with 0 extra indexes: " + noIndexTime + " ms");

            setupTable(conn, true);  // 5 extra indexes added
            long withIndexTime = timeInserts(conn, 20_000);
            System.out.println("Insert time with 5 extra indexes: " + withIndexTime + " ms");

            double slowdown = (double) withIndexTime / noIndexTime;
            System.out.printf("Writes became %.2fx slower with 5 extra indexes%n", slowdown);
        }
    }

    // Creates a fresh table, optionally adding 5 extra indexes
    private static void setupTable(Connection conn, boolean withIndexes) throws SQLException {
        try (Statement st = conn.createStatement()) {
            st.execute("DROP TABLE IF EXISTS demo_orders");
            st.execute("""
                CREATE TABLE demo_orders (
                    id BIGSERIAL PRIMARY KEY,
                    user_id INT,
                    status TEXT,
                    amount NUMERIC,
                    created_at TIMESTAMP,
                    notes TEXT
                )
            """);
            if (withIndexes) {
                st.execute("CREATE INDEX idx_user_id ON demo_orders(user_id)");
                st.execute("CREATE INDEX idx_status ON demo_orders(status)");
                st.execute("CREATE INDEX idx_created_at ON demo_orders(created_at)");
                st.execute("CREATE INDEX idx_user_status ON demo_orders(user_id, status)");
                st.execute("CREATE INDEX idx_status_created ON demo_orders(status, created_at)");
            }
        }
    }

    // Inserts N rows and returns elapsed time in milliseconds
    private static long timeInserts(Connection conn, int rowCount) throws SQLException {
        String sql = "INSERT INTO demo_orders (user_id, status, amount, created_at, notes) " +
                     "VALUES (?, ?, ?, now(), ?)";
        long start = System.currentTimeMillis();

        conn.setAutoCommit(false);
        try (PreparedStatement ps = conn.prepareStatement(sql)) {
            for (int i = 0; i < rowCount; i++) {
                ps.setInt(1, i % 1000);
                ps.setString(2, (i % 2 == 0) ? "paid" : "pending");
                ps.setBigDecimal(3, java.math.BigDecimal.valueOf(19.99));
                ps.setString(4, "sample order note");
                ps.addBatch();
                if (i % 500 == 0) ps.executeBatch(); // batch for realistic throughput measurement
            }
            ps.executeBatch();
        }
        conn.commit();
        conn.setAutoCommit(true);

        return System.currentTimeMillis() - start;
    }
}
What this shows: the code inserts the exact same 20,000 rows twice — once into a table with no secondary indexes, and once into an identical table with 5 typical indexes added. On most machines, you’ll observe the second run taking noticeably longer (commonly 1.3× to 3×, depending on hardware and row size), purely because of index maintenance overhead, with everything else held constant. This is a simple, honest way to feel the cost described throughout this tutorial rather than just taking it on faith.
Questions People Ask Most Often
A quick round of the questions that come up in almost every real conversation about indexing.
No universal number exists. It depends on write volume, row size, hardware, and how much read speed you actually need. The right approach is measuring real usage and write-latency impact, not following a fixed rule like “never more than 5.”
Usually not directly — indexes speed up reads. But indirectly, yes: too many indexes can pollute the cache and confuse the query planner, which can end up making even read queries slower in some cases, as explained in Section 7.
Yes, technically a primary key is implemented as a unique index internally, and it has the same maintenance cost as any other index. It’s simply unavoidable and essential, so it’s not usually counted as “excess,” but it does still cost write time like any index.
Raw storage cost has dropped a lot, but the real damage from excess indexes is mostly the write-latency and cache-pollution cost, not the dollar cost of disk space. Storage bloat is a visible symptom; write slowdown is the deeper issue.
No. Every database that supports secondary indexes has some version of this trade-off. MongoDB indexes also cost write throughput and RAM; DynamoDB even makes the cost explicit by charging separately for each Global Secondary Index’s provisioned capacity.
Check real usage statistics (Section 12) over a representative time window (ideally including any monthly/seasonal peak traffic), confirm the index isn’t backing a constraint you still need (like a unique or foreign key), and remove it in a lower-risk environment first if possible before production.
The Full Picture, Distilled
The full picture, distilled — a short, portable set of ideas you can carry into any indexing conversation or design review.
What to Remember
- An index is a separate, sorted copy of some columns, built purely to make specific reads fast — it is not free, and it is not magic.
- Every index must be updated on every write that touches its columns, so more indexes directly means slower
INSERT,UPDATE, andDELETEoperations. - Indexes consume real, separate disk storage — often rivaling or exceeding the size of the table itself.
- Indexes compete with table data for limited RAM in the buffer pool / page cache, and excess indexes can push useful data out of cache.
- Too many overlapping indexes give the query planner more choices and more chances to pick a suboptimal or wrong plan, especially with stale statistics.
- Backups, restores, replication, and maintenance operations all get slower and heavier as index count grows.
- The fix is not “fewer indexes” blindly — it’s measured, deliberate indexing based on real query patterns, plus regular audits to remove unused indexes.
- Architectural patterns like CQRS, caching layers, and read replicas let you get rich indexing for reads without burdening your core write path.
- This trade-off exists in every database technology — relational or NoSQL — because it is a fundamental consequence of storing sorted, duplicated data structures, not a flaw specific to any one product.
An index is a promise your database keeps on every write; the healthiest systems make that promise deliberately, measure whether it is still being repaid in real read speed, and are willing to break the promise once it stops paying.