What Is ETL?
Every dashboard you have ever trusted, every report your manager pulled up in a meeting, and every recommendation Netflix or Amazon has ever shown you — all of it depended on a quiet, unglamorous process running in the background called ETL. This guide explains exactly what that process is, why it exists, how the pieces fit together, and how to build one yourself.
Introduction & History
Imagine you run a small toy shop. Every day you write down what you sold in a paper notebook. Your friend, who runs the toy factory, tracks what she made in a spreadsheet. Your delivery partner tracks packages in yet another app. Now imagine your accountant asks you a simple question: “how many toys did we sell last month, and how much profit did we make after delivery costs?”
To answer that question, somebody has to gather information from your notebook, your friend’s spreadsheet, and the delivery app, put it all in the same shape (because your notebook says “12 dolls” while the spreadsheet says “Doll x 12”), fix any mistakes along the way, and finally write the combined answer somewhere everyone can read it — like a whiteboard at the front of your shop.
That entire process — collecting data from different places, cleaning and reshaping it so it makes sense together, and putting it somewhere useful — is exactly what ETL does, except computers do it instead of people, and instead of a handful of toy sales it might be millions of transactions, sensor readings or website clicks happening every second.
1.1 What Does ETL Stand For?
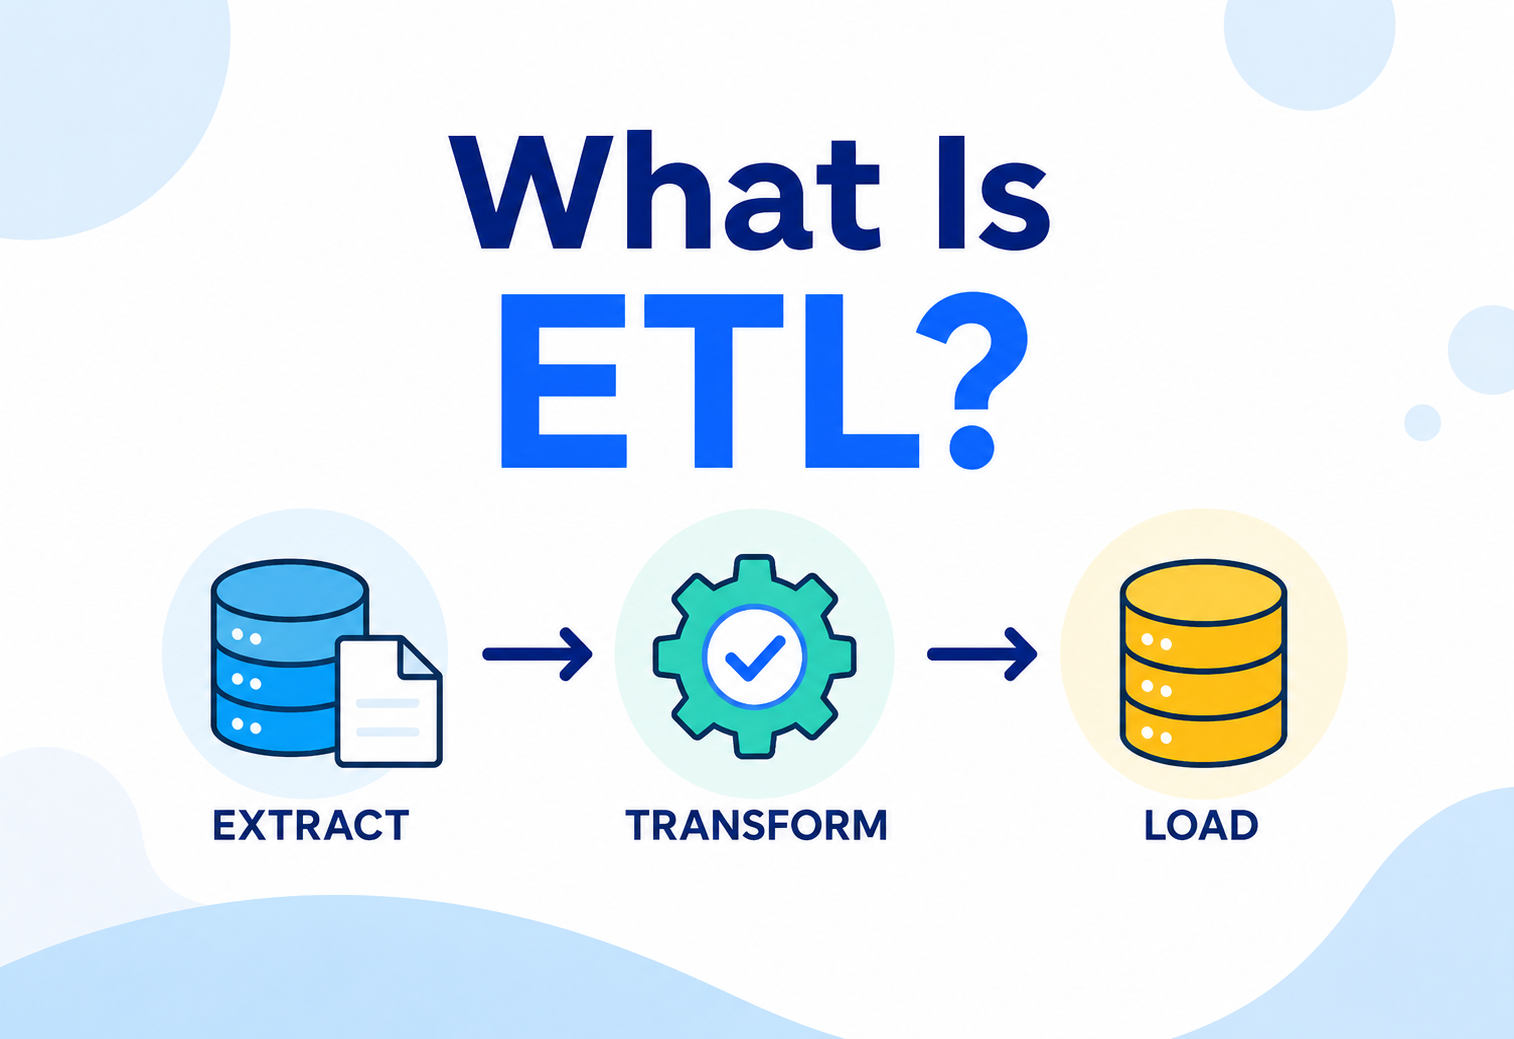
ETL is short for three words that describe three steps, always performed in this order:
- E — Extract: Pull raw data out of one or more source systems.
- T — Transform: Clean, reshape and enrich that raw data so it is consistent and useful.
- L — Load: Write the finished, trustworthy data into a destination system — usually a data warehouse — where people and applications can rely on it.
ETL is the process of moving data from where it is created to where it is needed, while cleaning and reshaping it along the way so it becomes trustworthy and usable.
1.2 A Short History — Why This Idea Exists
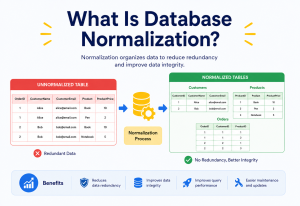
In the 1970s and 1980s businesses started using computers to run day-to-day operations: point-of-sale terminals, inventory systems, payroll software. These systems were built to be very fast at recording individual transactions — a workload computer scientists call OLTP (Online Transaction Processing). A cash register system, for example, is excellent at recording “this customer bought this item at this time,” one row at a time, thousands of times a day.
But OLTP systems are terrible at answering big-picture questions like “what were our total sales by region for the last three years, broken down by product category?” Asking that question against a live transaction system is like trying to count all the fish in the ocean by interviewing one fisherman at a time while more fish are constantly being caught. It is slow, it strains the system that is busy doing real work, and the answer keeps changing while you are still counting.
Bill Inmon and later Ralph Kimball — two of the most influential figures in the history of data engineering — formalised the idea of a separate system built purely for answering these big-picture questions: the data warehouse. A warehouse, however, is only useful if it is filled with clean, organised data pulled from all the messy operational systems around it. The process that fills it — extracting from operational systems, transforming into a consistent shape and loading into the warehouse — became known as ETL. The term itself became common in the 1990s alongside the rise of commercial data warehousing tools like Informatica PowerCenter and IBM DataStage.
Today the discipline has evolved considerably. Cloud computing, cheap object storage, and immensely powerful cloud data warehouses like Snowflake, BigQuery and Redshift have changed how teams think about the order of the three letters — a topic we explore in depth later in this guide. But the core idea — moving and reshaping data so that it becomes useful — has not changed at all in fifty years.
OLTP systems emerge
Businesses computerise day-to-day operations. The systems are excellent at recording individual transactions but poor at answering big-picture analytical questions.
Data warehousing gets a name
Bill Inmon defines the data warehouse: a separate, integrated store built for analytical questions rather than for running the business itself.
“ETL” becomes standard vocabulary
Commercial tools such as Informatica PowerCenter and IBM DataStage popularise ETL as an off-the-shelf discipline, moving it from custom scripts to structured platforms.
Open-source & big data
Hadoop, Pentaho and Talend put ETL power in the hands of teams that could not afford six-figure enterprise licences. Data volumes explode.
Cloud warehouses arrive
Snowflake, BigQuery and Redshift make it cheap to store raw data and transform it in-place, kicking off the shift from ETL toward ELT for many new pipelines.
dbt, Airflow, streaming
dbt turns SQL into a first-class transformation language, Airflow becomes the default orchestrator, and Kafka/Flink make near-real-time pipelines mainstream.
ETL, ELT & streaming coexist
The same organisation typically runs classic batch ETL, cloud ELT, and streaming pipelines side by side, each chosen for the data and use case it fits best.
ETL is like a professional interpreter at the United Nations. Each country’s delegate speaks their own language (the source system’s format). The interpreter listens (extract), converts the meaning into a shared language (transform), and delivers it to everyone in the room in a way they all understand (load). Without the interpreter, the room is just noise.
Problem & Motivation
Let us understand the exact problem ETL solves by looking at what happens without it. Data engineering, like all engineering, exists because of specific real-world pain — and if you can name that pain precisely you will find it much easier to reason about every architectural choice further down this guide.
2.1 The Problem: Data Lives in Silos
A modern company does not store all its information in one place. A typical mid-sized business might have:
- A sales database (MySQL or PostgreSQL) that records every order.
- A customer support tool (like Zendesk) tracking tickets and complaints.
- A marketing platform (like Google Ads or HubSpot) tracking ad spend and campaign clicks.
- A payment gateway (like Stripe) recording transactions.
- Spreadsheets that individual teams maintain by hand.
Each of these systems is a silo — a walled-off island of data that does not naturally talk to the others. Worse, each one stores data in its own format: dates might be “DD/MM/YYYY” in one system and “MM-DD-YYYY” in another; a customer might be called customer_id in one system and cust_no in another; currency might be stored in cents in one place and in dollars in the next.
Even if you had login access to every system, you could not simply eyeball the answer to “what was our total revenue last quarter across all channels?” The data is shaped differently everywhere, some of it is wrong or duplicated, and none of these operational systems are built to handle heavy analytical queries without slowing down the actual business.
2.2 The Motivation: One Trustworthy Version of the Truth
Businesses need a single source of truth — one place where clean, consistent, combined data lives, so that a report generated by the finance team and a dashboard viewed by the CEO always agree with each other. ETL is the engineering discipline that builds and maintains that single source of truth. It is, in a very literal sense, the plumbing beneath every executive dashboard that anyone has ever taken seriously.
2.3 What Problem ETL Actually Solves
A vulnerability of the “let us just query every system directly” approach is that it collapses under three separate pressures at once: performance (heavy analytical queries slow down operational systems), consistency (the same customer appears differently in every system), and history (operational systems overwrite old values as they change). ETL solves all three at once:
- It reads data once, on a schedule, so operational systems are only touched briefly.
- It reshapes conflicting formats into a single agreed model that every downstream consumer can trust.
- It preserves history, so questions like “what did this customer’s address look like a year ago?” still have an answer.
Interpreter at a summit
Think of ETL like a professional interpreter at the United Nations. Each delegate speaks their own language. The interpreter listens, converts the meaning, and delivers it in a shared language everyone in the room understands.
Sleep vs study hours
A student tracks daily study hours in a phone app and daily sleep hours in a paper diary. To find out if more sleep leads to better focus, they must pull both sets of numbers into one spreadsheet, align them by date and fix any missing entries — a tiny, manual version of ETL.
Nightly order sync
An e-commerce app extracts order records from its production MySQL database every night, transforms currency fields into a single standard (USD), removes test orders, and loads the clean result into a PostgreSQL-based analytics warehouse.
Uber
Uber combines trip data, driver data, rider app events, and payment data from dozens of microservices into a centralised warehouse every few minutes, powering surge-pricing models, city-level dashboards and finance reports — all built on ETL/ELT pipelines.
Core Concepts
Let us break down each of the three letters in detail. This is the heart of understanding ETL — once you truly understand these three stages, everything else in this guide (architecture, tools, patterns) will make sense quickly.
3.1 E — Extract
What it is. Extraction is the step where a pipeline reads raw data from one or more source systems, exactly as it exists there, without changing its meaning.
Why it exists. You cannot transform or analyse data you do not have. Extraction is the entry point — the “collecting” step — that gathers the raw material from wherever it currently lives.
Where it is used. Extraction happens against databases (via SQL queries or database transaction logs), APIs (like a weather service or a payments provider), flat files (CSV, JSON, XML dumps), message queues (like Kafka topics), and even web pages (through scraping, when permitted).
Types of Extraction
| Type | What it means | When to use it |
|---|---|---|
| Full extraction | Pull the entire dataset every time. | Small tables, or the very first pipeline run. |
| Incremental extraction | Pull only new or changed records since the last successful run. | Large tables, frequent runs, cost-sensitive pipelines. |
| Change Data Capture (CDC) | Continuously stream every insert / update / delete as it happens, usually by reading the database’s internal transaction log. | Near real-time pipelines with minimal load on the source system. |
Full extraction is like photocopying an entire 500-page book every day just to see if one paragraph changed. Incremental extraction is like a smart clerk who highlights and copies only the pages edited since yesterday. CDC goes one step further — it is like standing next to the author and grabbing each new sentence the moment it is written.
3.2 T — Transform
What it is. Transformation is the step where extracted, raw data is cleaned, restructured, validated and enriched so that it becomes consistent, correct and useful.
Why it exists. Raw data from real-world systems is almost always messy — full of typos, duplicates, missing values, inconsistent formats and unit mismatches. Transformation exists to fix all of that before anyone relies on the data for a decision.
Where it is used. Inside the pipeline’s processing engine — this could be SQL running inside a warehouse, a Python / Java / Scala script, or a distributed processing framework like Apache Spark.
Common Transformation Operations
- Cleansing — fixing typos, trimming whitespace, standardising capitalisation (e.g. “usa”, “U.S.A” and “United States” all become “US”).
- Deduplication — removing repeated records that represent the same real-world event.
- Type conversion — turning a text field
"20"into a real number, or a string date into an actual date type. - Normalisation / standardisation — converting all currencies to USD, all times to UTC, all units to metric.
- Enrichment — adding extra useful information, like turning a ZIP code into a city and state name by looking it up.
- Aggregation — summarising detailed rows into totals, like turning 10,000 individual orders into “total orders per day”.
- Filtering — dropping rows that should not be included, like internal test orders or bot traffic.
- Joining — combining data from two different sources using a shared key, like matching orders to customer names.
- Business rule validation — enforcing rules such as “order total must never be negative”.
Beginners often think transformation just means “changing formats”. In reality, the transform step is where most of the actual engineering effort and business logic lives. It is common for the transform stage of a real pipeline to contain thousands of lines of rules built up over years, encoding a company’s entire understanding of what “correct” data looks like.
3.3 L — Load
What it is. Loading is the final step, where the cleaned and transformed data is written into its destination — typically a data warehouse, data mart, or data lake — ready for people and applications to query.
Why it exists. Clean data sitting only in a temporary processing engine is not useful to anyone. Loading makes it permanent, queryable and accessible to dashboards, reports and downstream applications.
Where it is used. Target systems like Snowflake, Amazon Redshift, Google BigQuery, PostgreSQL analytical databases, or even flat files in a data lake such as Amazon S3.
Loading Strategies
| Strategy | Description |
|---|---|
| Full load | Wipe the destination table and rewrite it completely every run. Simple, but expensive for large data. |
| Incremental load (append) | Only add new rows since the last run. Efficient, but requires careful tracking of “what is new”. |
| Upsert (merge) | Insert new rows and update existing ones that changed, identified by a unique key. The most common approach in modern warehouses. |
| Slowly Changing Dimension (SCD) | Keep a full history of how a record changed over time instead of overwriting old values. Used when “what did this look like last year?” matters. |
The librarian
Loading is like a librarian who does not just receive newly translated books (from the transform step) but files them onto exactly the right shelf, with the right label, so that anyone walking into the library can find them instantly — instead of leaving them in a pile on the floor.
Family expense sheet
After cleaning up messy expense data in a spreadsheet, you paste the final clean numbers into a new sheet named “Final Report” that your family actually reads — that final paste is your “load” step.
Extract is about getting the raw material. Transform is where all the intelligence lives — where messy reality is turned into a clean, agreed model. Load is where that clean model is delivered somewhere durable, queryable and shared. Get any one of these three wrong and the other two stop mattering.
Architecture & Components
Now that you understand each stage individually, let us see how they fit together into a complete system. A production ETL system is not just three scripts glued together — it is a set of coordinated components, each with a specific job and a specific failure mode.
4.1 The Core Components, Explained One by One
1. Source Connectors
Small pieces of software responsible for talking each specific source system’s language — a MySQL connector speaks SQL, a REST API connector speaks HTTP, a Kafka connector speaks the Kafka protocol. Modern tools like Airbyte or Fivetran ship hundreds of pre-built connectors so engineers do not have to write extraction code from scratch for common systems like Salesforce or Stripe.
2. Staging Area
A temporary holding zone (often just a schema or folder) where raw, un-transformed data lands right after extraction. Think of it as a receiving dock at a warehouse — goods arrive here first, before being sorted and shelved. Keeping raw data staged separately means that if a transformation bug is discovered later, engineers can re-run the transform step without re-extracting from the (possibly slower or rate-limited) source system.
3. Transformation Engine
The computational muscle of the pipeline. For small data, this might just be SQL queries run inside the warehouse itself. For large-scale data, this is often a distributed processing engine like Apache Spark, which can transform terabytes of data by splitting the work across many machines at once.
4. Orchestrator / Scheduler
The conductor of the orchestra. An orchestrator like Apache Airflow, Dagster or Prefect decides the order in which tasks run, handles dependencies (“do not start transform until extract finishes”), retries failed steps, and runs the whole pipeline on a schedule (e.g. every night at 2 AM).
5. Data Warehouse (Destination)
The final, organised home for the data — a database specifically optimised for large analytical queries (scanning millions of rows fast) rather than tiny individual transactions. Examples include Snowflake, Google BigQuery and Amazon Redshift.
6. Metadata & Data Catalog
A system that keeps track of what data exists, where it came from, who owns it and how it is structured — like a library’s card catalog, but for data tables instead of books. Tools like DataHub or Amazon Glue Catalog serve this role.
7. Monitoring & Alerting
Dashboards and alerts that tell engineers if a pipeline failed, ran slowly, or produced suspicious results (like a table that suddenly has zero rows). Without this layer, a broken pipeline can silently feed wrong numbers into a company’s decisions for days before anyone notices.
Source connectors are the delivery trucks bringing raw ingredients. The staging area is the walk-in fridge where ingredients wait before cooking. The transformation engine is the chefs actually cooking. The orchestrator is the head chef calling out “start the sauce now, plate at 7:15.” The data warehouse is the pass — the counter where finished plates sit ready to be served. And monitoring is the restaurant manager watching to make sure no dish comes out late or wrong.
Internal Working
Let us go one level deeper and look at what actually happens, step by step, during a single pipeline run. Every ETL system on the planet, whether it is a Python script or a $2M enterprise platform, walks through some version of the same ten-step ritual.
5.1 Step-by-Step Breakdown
- Trigger: The orchestrator wakes up the pipeline, either on a schedule (like every hour) or because an event happened (like a new file landing in a folder).
- Connection & extraction: The extractor connects to the source, authenticates, and reads data — either the full table or just what changed since the last successful run, tracked using a “high-water mark” (like the last updated timestamp seen).
- Raw landing: Extracted data is written, untouched, into the staging area — usually as flat files (Parquet or JSON) or raw database tables.
- Schema validation: Before transforming, many pipelines check — does this data match the shape we expect? If a source system suddenly renames a column, this step catches it early.
- Transformation execution: The transform engine reads staged data and applies business logic: cleaning, deduplication, joins across multiple sources, calculated fields and aggregations.
- Data quality checks: Automated tests run against the transformed data — for example, “row count should not drop by more than 20% from yesterday” or “the revenue column should never be negative”.
- Loading: Clean data is written into the destination warehouse, typically using an efficient bulk-loading mechanism rather than inserting row by row.
- Post-load validation: A final sanity check confirms the data actually landed correctly and matches expected counts.
- Notification: The orchestrator reports success or failure, updates monitoring dashboards and, if something went wrong, pages the on-call engineer.
Separating “raw landing” from “transformation” is one of the most important internal design decisions in ETL. It means the expensive or fragile part (talking to the source system) only has to happen once per run, and if a transformation bug is found later, engineers can fix the logic and simply re-run the transform against already-staged raw data — no need to hit the source system again.
Data Flow & Lifecycle
Every piece of data that flows through an ETL pipeline goes through a predictable lifecycle, from the moment it is born in a source system to the moment someone views it on a dashboard — and eventually, in most well-run organisations, to the moment it is archived or deleted according to a retention policy.
6.1 Batch vs Streaming Lifecycles
There are two fundamentally different rhythms an ETL pipeline can follow, and picking the right one for the use case is one of the earliest architectural decisions a team makes.
| Aspect | Batch ETL | Streaming ETL |
|---|---|---|
| How data moves | In scheduled chunks (hourly, nightly) | Continuously, record by record or in micro-batches |
| Latency | Minutes to hours | Seconds or less |
| Typical tools | Airflow + Spark, dbt, SQL scripts | Apache Kafka, Apache Flink, Spark Structured Streaming |
| Best for | Daily reports, financial reconciliation, historical analysis | Fraud detection, live dashboards, real-time recommendations |
| Complexity | Lower | Higher — must handle out-of-order events, late data, exactly-once semantics |
Batch ETL is like a mail carrier who delivers all the day’s letters once, at 5 PM. Streaming ETL is like a group chat, where each message appears the instant it is sent. Both deliver the same kind of information — but the rhythm and the freshness are completely different, and each is right for different needs.
ETL vs ELT vs Reverse ETL
The order of the three letters is not just wordplay — it represents a genuine architectural choice that changed as cloud technology matured, and understanding that shift is one of the fastest ways to look competent in a data engineering interview.
7.1 ETL (Extract, Transform, Load)
The traditional approach: data is transformed before it reaches the warehouse, using a separate processing engine. This made sense historically because storage and compute inside a warehouse were expensive, so you wanted to shrink and clean the data before it ever touched the costly destination system.
7.2 ELT (Extract, Load, Transform)
The modern cloud-native approach: raw data is loaded into the warehouse first, and all transformation happens afterward, using the warehouse’s own powerful compute engine (via SQL). This became popular because modern cloud warehouses like Snowflake and BigQuery are extremely cheap and fast at processing huge volumes of data, so there is no longer a strong reason to transform data before loading it.
7.3 Reverse ETL
A newer pattern that flows in the opposite direction: instead of moving data into the warehouse, Reverse ETL takes clean, modelled data out of the warehouse and pushes it back into operational tools like Salesforce, HubSpot or a customer support platform — so that business teams can act on insights directly inside the tools they already use every day. Tools like Hightouch and Census specialise in this.
| Pattern | Best suited for | Example tools |
|---|---|---|
| ETL | Complex transformations, sensitive data that must be cleaned before storage, legacy on-premise systems | Informatica, Talend, SSIS |
| ELT | Cloud-native teams with fast, cheap warehouse compute, evolving business logic | Fivetran + dbt + Snowflake / BigQuery |
| Reverse ETL | Getting warehouse insights back into sales / marketing tools | Hightouch, Census |
If asked to compare ETL and ELT, the key idea to remember is: where does the transformation compute happen? ETL transforms data outside the warehouse before loading; ELT loads raw data first and transforms it inside the warehouse using the warehouse’s own processing power. Reverse ETL then sends the results back out to operational tools.
Advantages, Disadvantages & Trade-offs
Every engineering choice is a trade-off, and ETL is no exception. Before you can defend an architecture in a design review you need to be able to name honestly what you are giving up.
8.1 Advantages of ETL
- Single source of truth: everyone in the organisation works from the same clean, agreed-upon numbers.
- Data quality enforcement: bad data is caught and fixed before it reaches decision-makers.
- Reduced load on operational systems: analysts query the warehouse, not the live production database, so the actual app stays fast for real users.
- Historical tracking: warehouses often retain history, letting you answer “what did this look like a year ago?”
- Compliance-friendly: sensitive fields can be masked or excluded before data ever reaches broader analytics teams.
8.2 Disadvantages of ETL
- Latency: traditional batch ETL means data can be hours old by the time it is usable.
- Complexity and cost: building and maintaining pipelines requires dedicated engineering effort, infrastructure and monitoring.
- Rigid transformation-before-load: in classic ETL, if business requirements change, you may have to re-extract and re-process historical data because the raw form was never kept.
- Single point of failure: if a pipeline breaks silently, every downstream report can be wrong without anyone realising it immediately.
- Schema drift risk: if a source system changes its structure without warning, pipelines can break or, worse, silently produce incorrect data.
8.3 Key Trade-offs to Weigh
| Trade-off | Choice A | Choice B |
|---|---|---|
| Freshness vs cost | Real-time streaming (expensive, complex) | Nightly batch (cheap, simple, stale) |
| Flexibility vs governance | ELT — raw data available for anyone to reshape | ETL — only pre-approved clean data is ever loaded |
| Build vs buy | Custom pipelines (full control, more effort) | Managed tools like Fivetran (fast setup, less control) |
| Storage vs compute | Store everything raw, compute later (ELT) | Compute upfront, store only clean data (ETL) |
Pros
- Trusted, agreed-upon numbers across the whole business.
- Cheap analytical queries that do not slow down production.
- Full history available for retrospective analysis.
- Sensitive fields can be masked before reaching wider teams.
Cons
- Adds latency — a nightly batch is by definition up to a day stale.
- Non-trivial engineering, monitoring and cost overhead.
- Silent failures can quietly poison many downstream reports.
- Source-system schema changes can break pipelines with little warning.
Every real engineering team picks a point on these trade-off spectrums based on their specific needs: how fresh the data must be, how much they trust their raw data, how much budget they have, and how much in-house expertise they can maintain. A good architect names these trade-offs explicitly instead of pretending one approach is always superior.
Performance & Scalability
As data grows from thousands to billions of rows, naive ETL approaches fall apart. This section walks through the specific techniques production systems use to keep pipelines fast, cheap and predictable at scale.
9.1 Partitioning
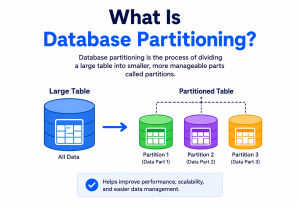
Instead of processing one giant table as a single block, data is split into smaller partitions — commonly by date (e.g. one partition per day). This means a pipeline can process just “yesterday’s partition” instead of scanning the entire table’s history every run, and it allows different partitions to be processed in parallel across multiple machines.
9.2 Parallelism & Distributed Processing
Frameworks like Apache Spark split a transformation job across many worker machines, each handling a slice of the data simultaneously. This is why a Spark job that would take 10 hours on one machine might finish in 15 minutes across a 40-node cluster.
9.3 Incremental Processing
As covered earlier, processing only new or changed data (instead of the full dataset every time) is the single biggest performance lever in ETL. A well-designed incremental pipeline can be 100× cheaper and faster than a naive full-reload pipeline once data grows large.
9.4 Columnar Storage & Compression
Modern data warehouses and file formats like Parquet store data column-by-column instead of row-by-row. If a query only needs the “revenue” column out of 50 columns, a columnar format lets the engine skip reading the other 49 entirely — dramatically speeding up analytical queries.
9.5 Caching & Materialised Views
Frequently-requested aggregates (like “total sales per day”) can be pre-computed and stored as a materialised view, so a dashboard does not have to re-scan millions of raw rows every time someone opens it.
Imagine sorting a giant pile of 10,000 mixed coins by year. One person doing it alone (single machine, no partitioning) takes forever. Now split the pile into 10 boxes by decade (partitioning) and give each box to a different friend to sort simultaneously (parallelism) — the whole job finishes in a fraction of the time.
| Technique | Impact |
|---|---|
| Partitioning by date | Avoids full-table scans; enables parallel processing |
| Incremental loads | Reduces processing volume dramatically over time |
| Columnar formats (Parquet, ORC) | Speeds up analytical queries that touch few columns |
| Distributed engines (Spark, Flink) | Scales horizontally to handle terabytes / petabytes |
| Materialised views & caching | Speeds up repeated, predictable queries |
9.6 Backpressure & Resource Management
In streaming pipelines, data can sometimes arrive faster than downstream systems can process it — a situation called backpressure. If left unmanaged, it can overwhelm memory and crash the pipeline. Modern streaming frameworks handle this automatically by slowing down how fast they read from the source (like Kafka) to match the speed at which the transformation and loading stages can keep up, similar to how a funnel naturally limits how fast water can pour through a narrow neck, no matter how quickly you pour from the top.
9.7 Vertical vs Horizontal Scaling
When a pipeline starts running too slowly, engineers have two broad options. Vertical scaling means giving the existing machine more power — more CPU cores, more memory — which is simple but has a hard ceiling, since a single machine can only get so big. Horizontal scaling means adding more machines to share the work, which is how distributed engines like Spark achieve near-limitless scalability, since you can generally keep adding worker nodes as data volume grows. Most large-scale, production ETL systems are designed from the start to scale horizontally, because a business’s data volume tends to grow faster than any single machine can keep up with.
High Availability & Reliability
A pipeline that “usually works” is not good enough in production — a single silent failure can feed wrong numbers into a company’s decisions for weeks. Reliable pipelines are built on a handful of specific patterns that are worth learning by name.
10.1 Idempotency
An operation is idempotent if running it multiple times produces the same final result as running it once. In ETL, this means if a pipeline crashes halfway and gets re-run, it should not create duplicate rows. This is usually achieved using “upsert” logic (insert-or-update by unique key) instead of blind “insert” logic.
10.2 Checkpointing
Long-running pipelines periodically save their progress (a “checkpoint”) so that if they fail partway through, they can resume from the last checkpoint instead of starting over from scratch — similar to how a video game lets you resume from your last save point instead of restarting the whole level.
10.3 Retries with Backoff
Transient failures (like a brief network hiccup) are common. A reliable pipeline automatically retries a failed step a few times, waiting slightly longer between each attempt (exponential backoff), before finally alerting a human if it keeps failing.
10.4 Failure Recovery & Dead-Letter Queues
When a specific record cannot be processed (say, a malformed row), a robust pipeline should not crash the entire job. Instead, it routes the bad record to a separate “dead-letter” location for later inspection, and continues processing everything else — similar to a mail sorting facility setting aside undeliverable letters instead of stopping the whole delivery truck.
10.5 Consistency & the CAP Theorem in Data Pipelines
Distributed data systems (including many pipeline components) must navigate the trade-offs described by the CAP theorem: a distributed system can only guarantee two out of three properties — Consistency (every read sees the latest write), Availability (every request gets a response), and Partition tolerance (the system keeps working despite network failures between nodes). Since network partitions are unavoidable in real distributed systems, engineers usually choose between prioritising consistency or availability during a partition. Streaming ETL systems, for example, often favour availability and “eventual consistency” — meaning data catches up shortly after, rather than blocking everything until it is perfectly synced.
10.6 Replication
Source databases and destination warehouses commonly replicate data across multiple physical servers or availability zones, so that if one server fails, another can immediately take over without data loss or downtime.
Idempotency is like a light switch labelled “on”, not a “toggle” button. Pressing a toggle button twice turns the light on, then off — the result depends on how many times you pressed it. Pressing “turn on” twice, however, leaves the light on both times — the result is always the same, no matter how many times you press it. Good ETL pipelines behave like the “turn on” switch: safe to press (re-run) as many times as needed.
Security
ETL pipelines often carry a company’s most sensitive information — customer names, payment details, health records — through multiple systems. Security has to be designed in from the start, not bolted on afterward.
11.1 Encryption
Data should be encrypted both in transit (while moving between systems, using protocols like TLS) and at rest (while stored on disk, using encryption provided by the warehouse or cloud storage provider). This ensures that even if someone intercepts network traffic or steals a disk, the raw data is unreadable without the correct key.
11.2 Access Control
Not everyone in a company needs to see raw customer data. Role-Based Access Control (RBAC) restricts who can view which tables and columns — a marketing analyst might see aggregated sales numbers, while only a small compliance team can see raw customer emails.
11.3 Data Masking & Anonymisation
Sensitive fields (like credit card numbers or social security numbers) are often masked (partially hidden, e.g. ****-****-****-1234) or fully anonymised before reaching general-purpose analytics tables, especially to comply with regulations like GDPR (Europe) and HIPAA (US healthcare data).
11.4 Secrets Management
Database passwords, API keys and tokens used by pipeline connectors must never be hard-coded into scripts. Instead, they are stored in dedicated secrets managers (like AWS Secrets Manager or HashiCorp Vault) and injected securely at runtime.
11.5 Audit Logging
Every access to sensitive data — who ran which pipeline, who queried which table — should be logged, so that in the event of a security incident or compliance audit there is a clear trail of exactly what happened and when.
Regulations like GDPR give individuals the right to have their personal data deleted (“right to be forgotten”). This means ETL pipelines must be designed so that a person’s data can actually be found and removed across every downstream table it was copied into — a surprisingly hard engineering problem once data has been copied and transformed dozens of times.
11.6 Network Security & Connection Safety
Pipelines that reach across the public internet to talk to third-party APIs or SaaS tools should connect through secure, restricted paths — for example, a VPN tunnel or a private network link between the cloud provider and the source system — rather than exposing a source database directly on the open internet. Firewall rules are typically configured so that only the specific IP addresses used by the pipeline’s servers are allowed to connect, sharply reducing the attack surface available to anyone trying to reach the database from outside.
11.7 Least Privilege for Pipeline Credentials
The database user or API key that a pipeline uses to extract data should have the minimum permissions necessary — typically read-only access to only the specific tables it needs — rather than a broad administrator account. This way, if a pipeline’s credentials are ever leaked, the damage an attacker could do is limited, since the stolen credentials cannot modify or delete anything in the source system.
Least privilege = single-room key
Giving a pipeline read-only, table-specific access is like giving a house cleaner a key that only opens the kitchen, not a master key to every room, the safe and the car. Even if that one key is copied by someone dishonest, the rest of the house stays protected.
Secrets in a vault
Storing credentials in a secrets manager instead of a script is like keeping the safe combination in a locked cabinet at the bank, not written on a sticky note on the safe itself. The pipeline asks for the code just long enough to open the safe, and never gets to keep it around.
Monitoring, Logging & Metrics
A pipeline running in the dark is a pipeline waiting to fail silently. Production ETL systems are heavily instrumented — not because engineers enjoy graphs, but because the alternative is being told by a very angry executive that yesterday’s dashboard has been wrong for a week.
12.1 Key Metrics to Track
- Row counts: how many rows were extracted, transformed and loaded — sudden drops or spikes often indicate a bug or a source-system issue.
- Pipeline duration: how long each run takes — a gradually increasing runtime often signals a scaling problem before it becomes a full outage.
- Data freshness: how old the newest data in the warehouse is compared to real time — critical for near-real-time use cases.
- Error rate: how many records failed validation or transformation rules.
- Schema changes: alerts when a source system adds, removes or renames a column unexpectedly.
12.2 Logging
Every pipeline step should emit structured logs (not just plain text) capturing what ran, when, with what parameters and what the outcome was. Structured logs (in JSON, for example) can be automatically parsed and searched, unlike free-form text logs.
12.3 Alerting
Automated alerts (via email, Slack or PagerDuty) notify engineers the moment something goes wrong — ideally before a business user notices a dashboard looks off. Good alerting distinguishes between “urgent, wake someone up” failures and “can wait until morning” warnings.
12.4 Data Observability
A newer discipline that goes beyond basic monitoring: automatically learning the normal patterns of a dataset (like “this table usually gets 50,000 new rows a day, plus or minus 5,000”) and flagging anomalies automatically, without needing engineers to hand-write every rule. Tools like Monte Carlo and Great Expectations specialise in this.
Row counts, freshness and error rates are like the speedometer, fuel gauge and check-engine light on a car’s dashboard. You do not need to understand the engine’s every internal detail, but a quick glance tells you whether everything is healthy or whether you need to pull over and investigate.
Deployment & Cloud
Modern ETL pipelines are rarely run on a single engineer’s laptop — they are deployed as managed, scalable, cloud-hosted systems, and the choice of tooling makes an enormous difference to how much of the boring plumbing a team has to build themselves.
13.1 Popular ETL and Orchestration Tools
| Category | Tools | Notes |
|---|---|---|
| Managed extraction (EL) | Fivetran, Airbyte, Stitch | Pre-built connectors, minimal setup |
| Transformation (the “T” in ELT) | dbt (data build tool) | SQL-based, version-controlled transformations |
| Orchestration | Apache Airflow, Dagster, Prefect | Schedules and sequences pipeline tasks |
| Distributed processing | Apache Spark, Apache Flink | Large-scale batch and streaming transformations |
| Cloud-native suites | AWS Glue, Azure Data Factory, Google Cloud Dataflow | Fully managed, integrated with each cloud’s ecosystem |
| Legacy enterprise ETL | Informatica PowerCenter, IBM DataStage, SSIS | Older, GUI-driven, common in large enterprises |
13.2 Cloud Deployment Patterns
In the cloud, ETL infrastructure is typically deployed using Infrastructure as Code (like Terraform), runs on managed compute (like AWS Glue jobs, or containers on Kubernetes), and is triggered by orchestrators that themselves run as managed services. This allows pipelines to automatically scale compute up during heavy nightly loads and scale back down (saving cost) when idle.
13.3 CI/CD for Data Pipelines
Just like application code, pipeline code (SQL transformations, Python extraction scripts) is stored in version control (Git) and deployed through automated pipelines that run tests before promoting changes to production — catching broken logic before it corrupts real business data.
Cloud data warehouses often charge based on how much data is scanned per query. Poorly partitioned tables or overly broad SQL queries (like SELECT * across years of data) can silently rack up large bills. Partitioning, clustering and query review are standard cost-control practices in production teams.
Databases, Staging & Caching
Under every ETL pipeline sits a handful of storage decisions — where raw data lands, what shape the warehouse takes, what gets cached, and what gets thrown away. These choices decide how expensive, how fast and how debuggable the whole system will be a year from now.
14.1 OLTP vs OLAP
| Aspect | OLTP (source systems) | OLAP (warehouse) |
|---|---|---|
| Purpose | Run the business (record transactions) | Analyse the business (answer questions) |
| Query pattern | Many small, fast reads / writes | Few large, complex, read-heavy queries |
| Storage layout | Row-oriented | Column-oriented |
| Example | MySQL powering a checkout page | Snowflake powering a revenue dashboard |
14.2 Data Lake vs Data Warehouse
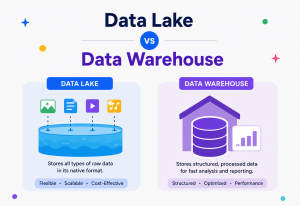
A data lake (like Amazon S3 or Azure Data Lake Storage) stores raw data of any type — structured, semi-structured or unstructured — cheaply and without requiring a fixed schema upfront. A data warehouse stores structured, cleaned, schema-enforced data optimised for fast business queries. Many modern architectures use both together, often called a “lakehouse”: raw data lands in the lake first, then curated, modelled data is loaded into the warehouse layer.
14.3 Staging Tables
As discussed earlier, staging tables hold raw, untransformed data temporarily. They are typically not exposed to business users — only pipeline engineers and the transformation layer interact with them directly. Keeping this layer separate is what makes it possible to fix a transformation bug without re-hitting the (possibly rate-limited or slow) source system.
14.4 Caching in the ETL Context
Caching shows up in a few places: cached API responses (to avoid re-fetching unchanged data from a rate-limited source), cached lookup tables (like a currency conversion table used repeatedly during transformation), and materialised views (pre-computed query results, effectively a cache of an aggregation) inside the warehouse itself.
Design Patterns & Anti-patterns
A handful of patterns keep showing up in well-run data platforms because they answer recurring problems well. An equally short list of anti-patterns keeps showing up in failing ones. Recognising both by name saves a great deal of pain.
15.1 Useful Design Patterns
Medallion Architecture (Bronze / Silver / Gold)
A popular modern pattern that organises data into three layers: Bronze holds raw, untouched data exactly as extracted; Silver holds cleaned, validated, deduplicated data; Gold holds business-ready, aggregated tables meant for direct consumption by dashboards. Each layer builds on the one before it, and mistakes can always be traced back and re-processed from an earlier, still-raw layer.
Idempotent Upsert Pattern
Rather than blindly appending new rows, pipelines match incoming records against existing ones using a unique key and either insert (if new) or update (if changed) — as discussed in the reliability section, this makes re-runs safe.
Slowly Changing Dimensions (SCD Type 2)
Instead of overwriting a changed value (like a customer’s address), a new row is added with a “valid from” and “valid to” date, preserving full history — essential when a report needs to reflect “what was true at the time”, like calculating shipping costs based on the address that was valid on the order date, not today’s address.
Fan-out / Fan-in Pattern
A single source is extracted once (fan-out avoided) and used to build multiple downstream tables (fan-in avoided by using shared staging), preventing the common mistake of extracting the same source data redundantly for each different report.
15.2 Common Anti-patterns to Avoid
Hardcoded logic
Business rules like tax rates or currency symbols written directly into pipeline code instead of a configurable lookup table. Every small business change then requires a code deployment.
No staging layer
Transforming data directly during extraction, with no raw copy saved. If a transformation bug is discovered, there is no way to reprocess history without going back to the (possibly already-changed) source system.
Silent failures
A pipeline that catches every error and continues without alerting anyone. Reports look normal, but are quietly wrong for days before someone notices.
SELECT * everywhere
Pulling every column from every table “just in case”, dramatically increasing cost, processing time, and the risk of accidentally exposing sensitive fields that were not actually needed.
Best Practices & Common Mistakes
Nearly every serious failure in a production data platform can be traced back to violating one of a small set of principles. Reading through this list before designing a pipeline will save you far more time than reading it after your first outage.
16.1 Best Practices
- Always keep raw data: never transform-in-place; preserve an untouched copy so mistakes can be corrected by reprocessing rather than re-extracting.
- Make every load idempotent: design loads so re-running a failed pipeline never creates duplicates.
- Version control everything: pipeline code and transformation logic (SQL, Python) should live in Git, with code review before changes reach production.
- Test data quality automatically: add automated checks (row counts, null checks, uniqueness checks) that block a pipeline from completing if something looks wrong.
- Document data lineage: track exactly which source columns feed into which final report fields, so when something looks wrong, engineers can trace it back quickly.
- Design for incremental processing early: retrofitting incremental logic onto a full-reload pipeline later is far more painful than designing for it up front.
- Separate concerns clearly: keep extraction, transformation and loading logic in distinct, independently testable pieces rather than one giant script.
- Alert on anomalies, not just failures: a pipeline that “succeeds” but loads zero rows is often worse than one that fails loudly.
16.2 Common Mistakes Beginners Make
- Assuming source data is always clean and consistent (it almost never is).
- Not handling time zones consistently, causing “off by one day” bugs that are painful to debug.
- Forgetting that source systems can change their schema without warning.
- Loading data with no unique key, making later deduplication or upserts impossible.
- Not thinking about what happens when a pipeline run fails halfway through.
- Building one giant, tightly coupled script instead of small, testable, reusable steps.
Treat every ETL pipeline as if it will fail at the worst possible moment, in the middle of a run, on a holiday, when no one is watching. Design for that reality — idempotency, checkpointing, monitoring and alerting — rather than assuming things will simply work every time.
Real-World & Industry Examples
Almost every well-known tech company runs on ETL or ELT under the hood. Here are a few of the most instructive examples, followed by an end-to-end walk-through of a smaller, concrete pipeline.
Global viewing telemetry
Netflix ingests billions of viewing events daily from devices worldwide, running them through large-scale ETL/ELT pipelines built on tools like Apache Spark and Kafka, feeding both business dashboards and the recommendation algorithms that decide what shows up on your home screen.
Inventory & fulfilment
Amazon’s retail and AWS businesses rely on massive ETL pipelines to reconcile inventory, orders and shipping data across warehouses globally, feeding systems that predict demand and optimise which warehouse should ship a given order.
The origin of Airflow
Airbnb built Airflow — now one of the most widely used open-source orchestrators in the industry — originally to manage its own internal ETL pipelines combining booking, pricing and host data across the company.
Nightly reconciliation
Banks run nightly ETL batch jobs to reconcile millions of transactions across branches and ATMs, ensuring account balances match across every system before markets open the next day — a process where correctness matters more than speed.
17.1 A Concrete Walk-through: An Online Store
Consider a mid-sized online store selling shoes. Every night at 1 AM, an ETL pipeline wakes up. It extracts new orders from the production MySQL database, new ad-spend data from Google Ads’ API, and new support tickets from Zendesk. It stages all three raw datasets separately. The transform step joins orders with customer data, converts all currencies to USD, calculates profit per order after ad spend, and filters out internal test orders placed by the QA team. The load step upserts the results into a Snowflake warehouse. By 6 AM, the CEO opens a dashboard showing yesterday’s revenue, profit and customer satisfaction — all combined from three completely different systems, made possible entirely by ETL.
A Simple Java ETL Example
Below is a simplified, self-contained Java example demonstrating the three stages of ETL: extracting rows from a source (simulated here as an in-memory list, representing what would normally come from a database), transforming them by cleaning and calculating a new field, and loading them into a destination (simulated as printing “insert” statements, representing what would normally be a database write).
import java.util.*;
import java.util.stream.*;

public class SimpleETL {

    // A simple record representing one raw order from the "source system"
    record RawOrder(String orderId, String customer, double priceInCents, String country) {}

    // The cleaned, transformed shape we want to load
    record CleanOrder(String orderId, String customer, double priceInUsd, String country) {}

    public static void main(String[] args) {
        // ----- EXTRACT -----
        // In a real pipeline this would be a JDBC query or API call.
        List<RawOrder> extracted = extract();
        System.out.println("Extracted " + extracted.size() + " raw rows.");

        // ----- TRANSFORM -----
        List<CleanOrder> transformed = transform(extracted);
        System.out.println("Transformed into " + transformed.size() + " clean rows.");

        // ----- LOAD -----
        load(transformed);
    }

    private static List<RawOrder> extract() {
        // Simulated raw data, exactly as it might arrive from a messy source system.
        return List.of(
            new RawOrder("ORD-1", "  amit sharma ", 250000, "in"),
            new RawOrder("ORD-2", "Neha Verma",     899900, "IN"),
            new RawOrder("ORD-3", "john doe",         4999, "us"),
            new RawOrder("ORD-4", "",              1200000, "in") // missing customer name -> invalid row
        );
    }

    private static List<CleanOrder> transform(List<RawOrder> rawOrders) {
        return rawOrders.stream()
            // Data quality check: drop rows with missing required fields
            .filter(o -> o.customer() != null && !o.customer().isBlank())
            // Cleansing + normalisation + enrichment
            .map(o -> new CleanOrder(
                o.orderId(),
                capitalizeName(o.customer().trim()),
                o.priceInCents() / 100.0,      // cents -> dollars/rupees
                o.country().toUpperCase()      // standardise country code
            ))
            .collect(Collectors.toList());
    }

    private static void load(List<CleanOrder> cleanOrders) {
        // In production this would be a batched JDBC upsert or a warehouse bulk load.
        for (CleanOrder order : cleanOrders) {
            System.out.printf(
                "UPSERT INTO orders_clean (order_id, customer, price, country) VALUES ('%s', '%s', %.2f, '%s');%n",
                order.orderId(), order.customer(), order.priceInUsd(), order.country()
            );
        }
    }

    private static String capitalizeName(String name) {
        String[] parts = name.split("\s+");
        StringBuilder result = new StringBuilder();
        for (String part : parts) {
            if (!part.isEmpty()) {
                result.append(Character.toUpperCase(part.charAt(0)))
                      .append(part.substring(1).toLowerCase())
                      .append(" ");
            }
        }
        return result.toString().trim();
    }
}
What this code demonstrates:
extract()simulates pulling raw, messy records from a source — notice the inconsistent capitalisation and one row with a missing customer name.transform()applies a data quality filter (dropping the invalid row), cleans up names, converts currency units and standardises country codes — mirroring exactly the kinds of operations described in the Core Concepts section.load()writes the final clean records using anUPSERT-style statement — following the idempotent loading pattern discussed in the reliability section, so re-running this program would not create duplicate rows in a real database.
In a real production system, extract() would use JDBC or an API client, transform() would likely run on Apache Spark for large datasets, and load() would use a warehouse-specific bulk-loading library. The core logic and stages, however, remain conceptually identical to this simplified example.
FAQ, Summary & Key Takeaways
A short set of the questions people ask most often about ETL when they first encounter it, followed by a one-paragraph summary and the ideas most worth carrying forward.
19.1 FAQ
Is ETL still relevant now that ELT exists?
Yes. ELT has become popular for cloud-native analytics, but ETL is still widely used, especially when data must be cleaned or masked before it ever reaches a shared warehouse — for example, in healthcare or finance where sensitive data cannot legally sit around unmasked, even briefly.
What is the difference between ETL and data integration?
ETL is one specific technique used to achieve data integration. Data integration is the broader goal of making data from different systems work together; ETL, ELT, CDC and APIs are all tools that can help achieve it.
Do I need to know Spark or Airflow to learn ETL?
No. The core concepts of ETL (extract, transform, load, staging, idempotency, monitoring) can be learned and even practised with just SQL and a scripting language like Python or Java. Tools like Spark and Airflow become useful once you are working with large-scale or complex production pipelines.
What is Change Data Capture (CDC) and why does it matter?
CDC captures every insert, update and delete from a source database’s internal transaction log in near real-time, rather than periodically re-scanning the whole table. It matters because it enables low-latency pipelines with minimal load on the source system.
Can ETL pipelines run in real time?
Yes, through streaming ETL using tools like Apache Kafka and Apache Flink, data can be extracted, transformed and loaded within seconds of an event happening, rather than waiting for a nightly batch.
19.2 Summary
ETL is the discipline of pulling data from one or more source systems, cleaning and reshaping it into a consistent and trustworthy form, and delivering it into a destination — usually a data warehouse — where people and applications can rely on it. It exists because operational systems are bad at answering analytical questions, and because data in real organisations lives in scattered, inconsistent silos. Modern architectures often favour ELT (transforming inside the warehouse after loading) thanks to cheap, powerful cloud warehouse compute, but classic ETL remains important for sensitive or heavily regulated data. Whichever letter order you pick, production-grade pipelines share the same core requirements: idempotency, checkpointing, monitoring, security and cost control. And every serious dashboard, report or ML model at every serious company you can name — Netflix, Amazon, Uber, Airbnb, every major bank — is ultimately powered by some flavour of ETL turning raw operational chaos into clean numbers people can act on.
19.3 Key Takeaways
- ETL stands for Extract, Transform, Load — the process of pulling data from source systems, cleaning and reshaping it, and delivering it to a destination where it becomes trustworthy and usable.
- ETL exists because operational systems (OLTP) are bad at answering big-picture analytical questions, and because data lives scattered across many inconsistent silos.
- Modern architectures often favour ELT (transforming inside the warehouse after loading) due to cheap, powerful cloud warehouse compute, but classic ETL remains important for sensitive or highly regulated data.
- Production-grade pipelines require careful attention to idempotency, checkpointing, monitoring, security and cost — not just moving data from A to B.
- Patterns like the medallion architecture (Bronze / Silver / Gold) and slowly changing dimensions help organise pipelines so they stay maintainable as they grow.
- Every major tech company — Netflix, Amazon, Uber, Airbnb — relies on some form of ETL/ELT to turn raw operational chaos into the clean numbers that power their dashboards, reports and machine learning models.