What Is Infrastructure Monitoring?
A complete, beginner-friendly guide to how modern systems watch themselves — from a single server’s CPU graph to the observability platforms that keep Netflix, Amazon, and Uber running every second of every day.
Introduction & History
Imagine you own a small shop. Every morning you walk in, check if the lights work, see if the fridge is cold enough, and glance at the cash register to make sure yesterday’s sales were recorded properly. You are monitoring your shop — watching its vital signs so you can catch a problem before a customer does.
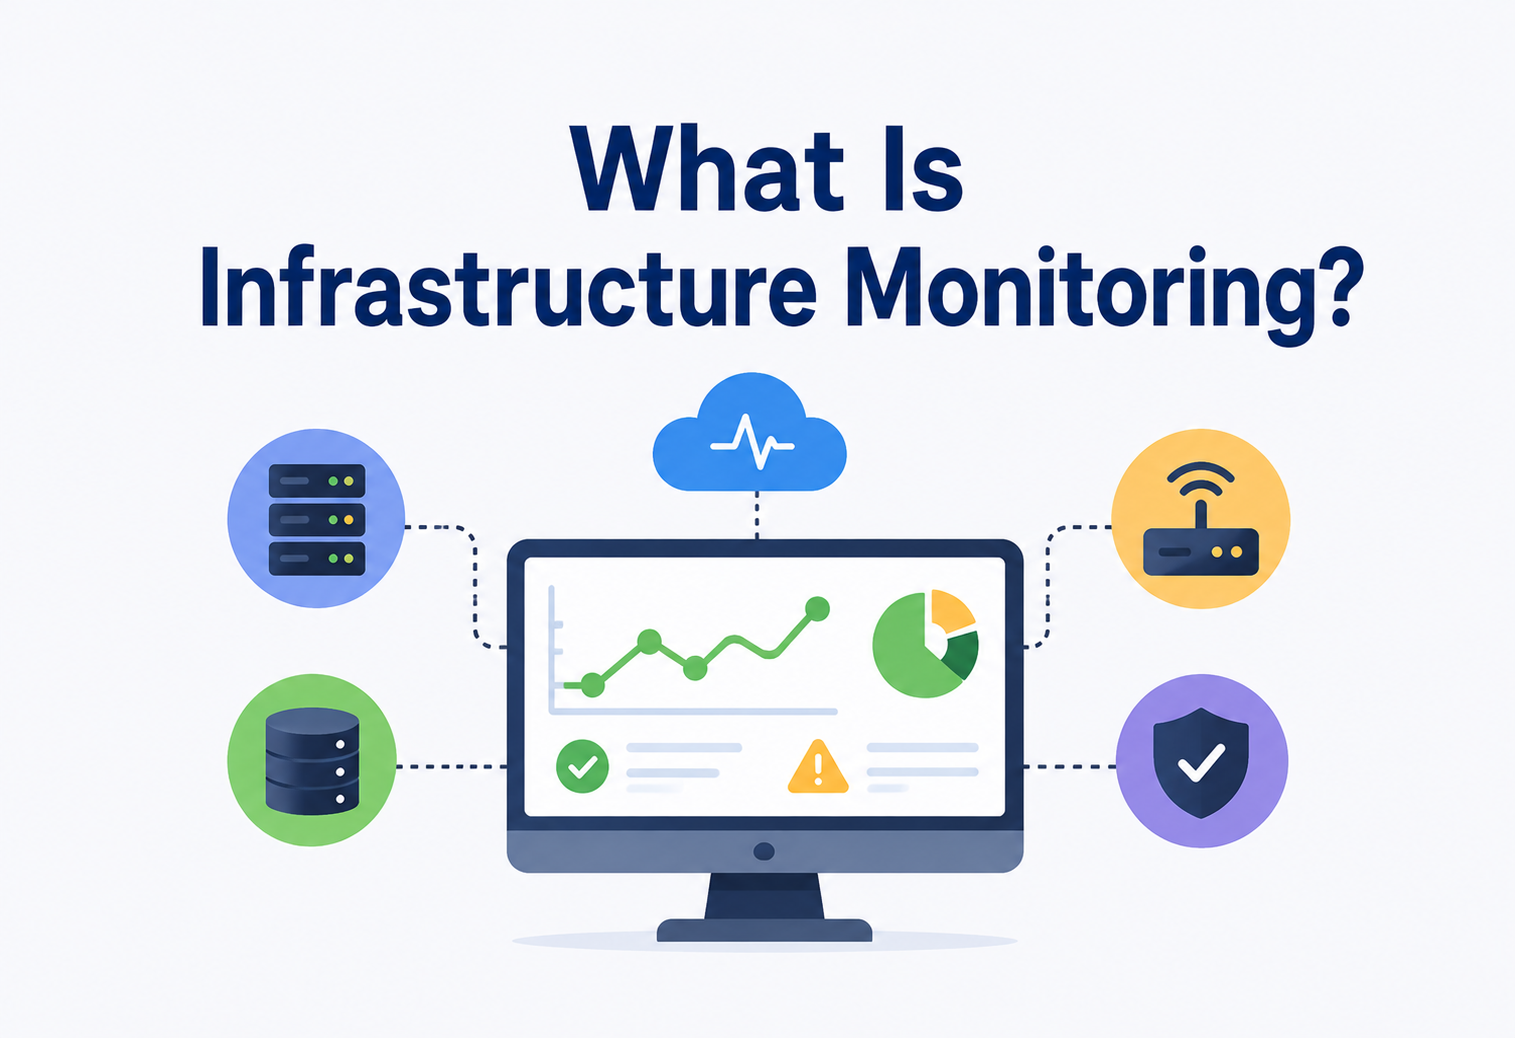
Infrastructure monitoring is the same idea, applied to computers. It is the practice of continuously watching the “vital signs” of servers, networks, databases, and applications — things like CPU usage, memory, disk space, network traffic, and whether a service is even running at all — so that engineers know the health of their systems at every moment, not just when something breaks.
The word “infrastructure” here means the underlying machinery that software runs on: physical servers, virtual machines, containers, network switches, load balancers, storage systems, and cloud resources. Think of it as the plumbing and electrical wiring of a building — you do not see it directly, but everything depends on it working.
1.1 A Short History
In the 1980s and 1990s, infrastructure monitoring was primitive. System administrators would log into a server and manually run commands like top or ps to see what was happening — similar to a doctor manually taking your pulse instead of having a heart monitor. Tools like Simple Network Management Protocol (SNMP), created in 1988, let one computer ask another “how are you doing?” over the network, which was revolutionary at the time.
The 2000s brought dedicated monitoring platforms — Nagios (2002) let teams define checks and get alerted when something failed. Cacti and MRTG turned raw numbers into graphs. As the 2010s arrived and companies moved to the cloud with hundreds or thousands of servers, monitoring had to evolve again. Tools like Graphite, Prometheus (2012, born at SoundCloud), Datadog, and Grafana emerged to handle monitoring at a massive, distributed scale.
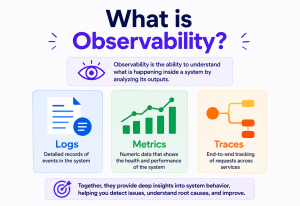
Today, the field has grown into something bigger called observability — a term borrowed from control theory meaning “how well can you understand the internal state of a system just by looking at its outputs.” Monitoring is one part of observability; the others are logging and tracing, which we will cover later.
1.2 Evolution Timeline
SNMP introduced
Simple Network Management Protocol let one machine query another for basic health information — the first widely-adopted network monitoring standard.
Nagios launched
A dedicated open-source platform for defining checks and receiving alerts when a service failed — the archetype of “check-based” monitoring for a generation.
Cacti graphing tool
Turned raw SNMP counters into readable line graphs, making trends visible to humans at a glance rather than buried in log files.
Prometheus created at SoundCloud
A pull-model time-series database and alerting engine purpose-built for the cloud-native world of dynamic, ephemeral services.
Grafana becomes standard
Emerged as the dashboarding tool of choice on top of Prometheus, InfluxDB, and many other backends — a common visual language across teams.
OpenTelemetry project begins
An industry-wide effort to unify metrics, logs, and traces behind vendor-neutral APIs, so instrumentation is no longer locked to a single platform.
AI-assisted observability
Modern platforms began layering anomaly detection, correlation, and automated root-cause suggestions on top of the classic metrics + logs + traces foundation.
The Problem & Motivation
Why do we even need monitoring? Because computer systems fail — quietly, unpredictably, and often at the worst possible time. Without monitoring, the first sign of trouble is usually an angry customer, not an engineer noticing early.
Modern systems are made of dozens, hundreds, or thousands of moving parts — servers, containers, databases, network links — and any one of them can fail silently. Without visibility, you are flying a plane with no instrument panel.
Here is a simple analogy: imagine driving a car with no dashboard — no speedometer, no fuel gauge, no engine warning light. You would only find out you were low on fuel when the car actually stopped, probably in the middle of a highway. Infrastructure monitoring is the dashboard for your computer systems.
2.1 Specific Problems Monitoring Solves
- Silent failures — a disk quietly fills up over weeks until the database can no longer write new data.
- Capacity surprises — traffic doubles overnight and servers run out of memory, causing crashes.
- Slow, creeping degradation — an application gets 2% slower every day for a month until it is unusable, but no single day looked alarming.
- Cascading failures — one broken service causes the services that depend on it to break too, like dominoes.
- Root-cause hunting — when something breaks at 3 a.m., engineers need to find out why quickly, not guess.
Without monitoring, teams operate reactively — they only learn about problems from user complaints. With monitoring, teams operate proactively and even predictively, catching issues before they affect anyone.
Core Concepts
Before going deeper, let us build a vocabulary. Each of these terms is a building block for everything that follows, and mixing any of them up is the single biggest source of confusion when reading monitoring documentation.
3.1 Metrics
A metric is a number measured over time — like a car’s speedometer reading. Examples: CPU usage percentage, number of requests per second, memory used in megabytes. Metrics are usually collected at regular intervals (say, every 15 seconds) and stored so you can see how they change.
3.2 Logs
A log is a timestamped text record of something that happened — like a diary entry. Example: 2026-07-20 03:14:02 ERROR Failed to connect to database: timeout. Logs give detailed, specific context that a metric alone cannot.
3.3 Traces
A trace follows a single request as it travels through many services. If a user clicks “Buy Now” and that click passes through 8 microservices, a trace shows you exactly how long each of those 8 steps took — like a GPS breadcrumb trail for a single trip.
3.4 Alerts
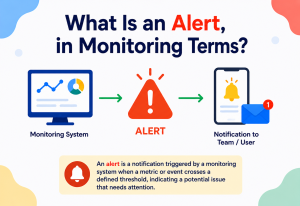
An alert is a rule that says “if this metric crosses this threshold, notify a human (or a system).” For example: “if CPU usage is above 90% for 5 minutes, send a message to the on-call engineer.”
3.5 Dashboards
A dashboard is a visual screen — usually full of graphs and numbers — that lets a human glance at many metrics at once, like the instrument panel in a cockpit.
3.6 SLI, SLO, and SLA
- SLI (Service Level Indicator) — an actual measurement, e.g. “99.95% of requests succeeded last month.”
- SLO (Service Level Objective) — an internal goal, e.g. “we want 99.9% of requests to succeed.”
- SLA (Service Level Agreement) — a promise to customers, often with financial penalties if broken.
Think of SLI as your actual grade on a test, SLO as the grade you are aiming for, and SLA as a promise to your parents about what grade you will get — with consequences if you do not hit it.
3.7 The Four Golden Signals
Google’s Site Reliability Engineering book popularised four signals every service should monitor:
Latency
How long requests take to complete — both successful and failed requests, measured separately since a failed request that returns fast can mask a real problem.
Traffic
How much demand is being placed on the system, typically expressed as requests per second, transactions per minute, or messages per second.
Errors
The rate of requests that fail — whether by returning an error status, timing out, or producing wrong content.
Saturation
How “full” the system is — CPU, memory, disk, queue depth — and how close it is to running out of headroom.
Architecture & Components
A monitoring system is itself a small distributed application. Let us break down its typical pieces, using a wristwatch fitness tracker as our mental model: the tracker senses your heart rate, sends that data to your phone, the phone stores history, an app displays trends, and it buzzes you if your heart rate seems dangerous.
4.1 The Building Blocks
Agents / Exporters
Small programs installed on each server that collect local metrics (CPU, memory, disk) and expose them.
Collector / Scraper
A central service that pulls (or receives pushed) metrics from every agent on a schedule.
Time-Series Database
Specialised storage optimised for “value + timestamp” data, built for fast writes and range queries.
Query Engine
Lets you ask questions like “average CPU over the last hour” using a query language.
Alerting Engine
Continuously evaluates rules against fresh data and fires notifications when they match.
Visualisation Layer
Dashboards (e.g. Grafana) that turn numbers into readable graphs a human can absorb in seconds.
Notification Channels
Slack, email, SMS, PagerDuty — how alerts actually reach a human on-call rotation.
Log Pipeline
A separate but related system (e.g. Elasticsearch, Loki) that ingests and indexes text logs.
4.2 How the Pieces Connect
4.3 Two Collection Styles
Pull Model
The central collector reaches out to each agent and asks “give me your current numbers.” Prometheus works this way. Easy to see which targets are down (they simply do not respond), and simpler to secure because agents do not need outbound credentials.
Push Model
Each agent sends its data to a central endpoint on its own schedule. Useful for short-lived jobs (like a batch script) that might not exist long enough to be “pulled.” StatsD works this way, and it plays nicely with strict firewall setups where inbound scrape traffic is blocked.
Internal Working
Let us zoom into how a single metric actually travels from a server’s CPU to a graph on your screen. Each step is small, but their careful sequencing is what makes the whole system feel like a living dashboard rather than a stale spreadsheet.
5.1 Step 1 — Instrumentation
Somewhere in the operating system or application code, a counter increments. For example, every time a web server handles a request, it increases an internal counter http_requests_total by 1. This is called instrumentation — adding measurement hooks to code.
5.2 Step 2 — Exposition
The exporter (a small piece of software) makes these numbers available, often as a simple text page at a URL like /metrics. Here is what that might look like:
http_requests_total{method="GET",status="200"} 152340
http_requests_total{method="GET",status="500"} 12
cpu_usage_percent 42.7
memory_used_bytes 1073741824
5.3 Step 3 — Scraping (Collection)
Every 15 seconds (a configurable interval), the collector visits that URL, reads the numbers, and stamps them with the current time before saving them.
5.4 Step 4 — Storage
Each number becomes a data point: (timestamp, value, labels). Millions of these are written per second in a large company, so the storage engine (a time-series database) is specially designed to compress and index this kind of data efficiently — much like how a library organises books by category instead of by the order they arrived.
5.5 Step 5 — Querying
When you open a dashboard, it sends a query like “average of cpu_usage_percent over the last hour, grouped by server” to the query engine, which reads only the relevant slice of stored data and computes the answer.
5.6 Step 6 — Alert Evaluation
In parallel, the alerting engine re-runs alert rules (also written as queries) on a schedule — say every 30 seconds — checking things like “is error rate above 5% for the last 5 minutes?” If true, it fires an alert.
5.7 A Tiny Java Example — Exposing a Custom Metric
Here is a simplified Java snippet showing how an application might expose a metric using a Prometheus-style client library:
import io.prometheus.client.Counter;
import io.prometheus.client.exporter.HTTPServer;

public class OrderService {

    // Define a counter metric that tracks total orders placed
    static final Counter ordersTotal = Counter.build()
        .name("orders_total")
        .help("Total number of orders placed")
        .labelNames("status")
        .register();

    public void placeOrder(boolean success) {
        // Business logic to place the order goes here...

        // Instrument: increment the counter based on outcome
        if (success) {
            ordersTotal.labels("success").inc();
        } else {
            ordersTotal.labels("failed").inc();
        }
    }

    public static void main(String[] args) throws Exception {
        // Expose metrics on port 8080 at /metrics for the collector to scrape
        HTTPServer server = new HTTPServer(8080);
        System.out.println("Metrics available at http://localhost:8080/metrics");
    }
}
This small amount of code is all it takes for a Java service to become “observable” — the collector can now scrape orders_total and build graphs, alerts, and dashboards from it without touching the application again.
Data Flow & Lifecycle
Data in a monitoring system moves through a predictable lifecycle, similar to how mail moves from a mailbox to a sorting centre to your doorstep. Understanding each stop helps you reason about latency, cost, and where a problem in your monitoring stack most likely lives.
Generation
A metric value is produced inside a running process (e.g. current memory usage).
Collection
The value is scraped or pushed to a central collector, with a timestamp attached.
Transport
Data travels over the network, sometimes batched and compressed to save bandwidth.
Ingestion & Storage
The time-series database writes the point to disk, updating indexes for fast lookup later.
Retention & Downsampling
Old, high-resolution data is “compressed” into hourly or daily averages to save space — similar to how old photos get compressed into smaller thumbnails.
Querying
Dashboards and alert rules read the data back out, often aggregating across many servers.
Action
A human sees a dashboard, or an alert fires and someone (or an automated system) responds.
This lifecycle repeats continuously, 24/7, for every metric in the system — which is why efficiency at each stage matters so much once you have thousands of servers.
Advantages, Disadvantages & Trade-offs
Monitoring is not free, and treating it as a purely positive addition tends to produce cluttered dashboards, noisy pagers, and inflated infrastructure bills. Looking at both sides honestly makes it far easier to design a stack that pays for itself.
Advantages
- Catches problems before customers notice them.
- Speeds up debugging with historical context.
- Enables data-driven capacity planning.
- Builds trust through measurable reliability (SLOs).
- Supports automation like auto-scaling and self-healing workflows.
Disadvantages / Costs
- Adds infrastructure cost (storage, compute for the monitoring stack itself).
- Too many alerts cause “alert fatigue” and get ignored.
- Requires ongoing maintenance and tuning.
- Risk of monitoring becoming a single point of failure.
- Instrumentation adds a small performance overhead to applications.
7.1 Common Trade-offs
| Trade-off | Choosing more of A | Choosing more of B |
|---|---|---|
| Resolution vs. Cost | Finer-grained data (every 1s) = more insight | Coarser data (every 60s) = cheaper storage |
| Retention vs. Storage | Keep years of data for trends | Keep weeks of data to save money |
| Sensitivity vs. Noise | Tight alert thresholds catch issues early | Loose thresholds reduce false alarms |
| Push vs. Pull | Push suits ephemeral jobs | Pull simplifies knowing what is “down” |
Performance & Scalability
When you are monitoring 10 servers, almost any tool works. When you are monitoring 50,000 servers generating millions of data points per second — like at a large cloud provider — the monitoring system itself becomes a serious engineering challenge.
8.1 Cardinality
Cardinality is the number of unique combinations of labels a metric can have. If you track http_requests_total by {method, status, user_id} and you have a million users, you suddenly have millions of unique time series — this is called a “cardinality explosion” and can overwhelm a time-series database, similar to how a spreadsheet with millions of unique row labels becomes slow to search.
Never put unbounded values (like a user ID, session ID, or raw URL with query parameters) directly into a metric label. It is one of the most common causes of monitoring systems falling over in production.
8.2 Scaling Techniques
- Sharding — splitting metrics across multiple storage nodes by hash, similar to splitting a phone book into multiple volumes by last name.
- Downsampling — reducing resolution of old data (e.g. converting per-second data older than 30 days into per-hour averages).
- Federation / hierarchical aggregation — regional collectors summarise data before sending it up to a global system, reducing the amount of data that needs to travel long distances.
- Sampling — for traces especially, only recording a percentage (e.g. 1%) of all requests in detail, since storing every single trace at massive scale is often unnecessary and expensive.
8.3 Algorithmic Considerations
Time-series databases often use specialised data structures: an LSM-tree (Log-Structured Merge-tree) for fast writes, similar to how you would jot quick notes on sticky notes throughout the day and organise them into a neat notebook later rather than rewriting the notebook every time. Compression algorithms like Gorilla encoding (from Facebook’s research) exploit the fact that consecutive timestamps and values change only slightly, shrinking storage size by 90% or more.
High Availability & Reliability
Here is an uncomfortable irony: what happens when your monitoring system — the thing meant to tell you when something is broken — breaks itself? This is why monitoring infrastructure needs its own reliability design, and treating it as “just another service” is where many outages actually start.
9.1 Replication
Just like important documents are kept in more than one place, monitoring data and services are often replicated — copied across multiple servers — so that if one fails, another can take over. Prometheus, for instance, is often run in pairs, with two identical instances scraping the same targets independently.
9.2 Redundant Alerting Paths
If your only way of alerting the on-call engineer is a service that is currently down, that is a critical flaw. Good designs have a “dead man’s switch” — a signal that says “monitoring is still alive” — and if that signal stops arriving, a completely separate, simpler system raises the alarm.
9.3 CAP Theorem in a Monitoring Context
The CAP theorem states that a distributed system can only guarantee two out of three: Consistency, Availability, and Partition tolerance. Monitoring systems usually favour Availability over strict Consistency — it is fine if two replicas briefly show slightly different numbers, but it is not fine if the whole dashboard goes blank during a network hiccup.
9.4 Consensus & Coordination
Alerting engines that run in multiple copies need to agree on who “owns” firing a particular alert, to avoid sending the same page five times. This is often solved using consensus protocols like Raft, or simpler leader-election mechanisms backed by something like etcd or ZooKeeper.
9.5 Failure Recovery
If a collector crashes and restarts, it typically resumes scraping from where it left off, and gaps in the data are visible on graphs as literal gaps — an honest signal rather than a fabricated one. Good systems avoid silently interpolating fake data over an outage.
A monitoring system that fails silently is worse than no monitoring at all — it gives you false confidence. Reliability engineering for the monitoring stack itself is therefore not optional at any real scale.
Security
Monitoring systems see almost everything happening inside your infrastructure, which makes them an attractive target — like a security guard’s control room full of camera feeds. If that room is not locked, the whole building’s privacy is compromised.
10.1 Security Controls at a Glance
Authentication
Every agent, collector, and dashboard endpoint should require credentials or mutual TLS — never leave a /metrics endpoint open to the public internet.
Encryption in Transit
Metrics and logs often travel across networks; TLS prevents eavesdropping or tampering along the way.
Access Control (RBAC)
Not everyone needs to see every dashboard — role-based access control limits exposure of sensitive data.
Sensitive Data Hygiene
Logs must never accidentally capture passwords, tokens, or personal data — this is a common and serious compliance risk.
Alert Integrity
An attacker who can silence alerts can hide an attack in progress — alerting pipelines need their own tamper protection.
Least Privilege
Agents collecting metrics should run with minimal system permissions, not as an all-powerful root user.
Monitoring the Monitors — Logging & Metrics of the Stack Itself
It sounds circular, but the monitoring stack needs to be monitored too — this is sometimes called “meta-monitoring.” A separate, simpler, independently-run system typically checks:
- Is the collector successfully scraping all expected targets?
- Is the time-series database running out of disk space?
- Are alert rules failing to evaluate due to a bug or overload?
- Is the notification channel (e.g. Slack webhook) actually reachable?
11.1 Structured Logging
Good observability practice also emphasises structured logging — writing logs as machine-readable key-value data (often JSON) instead of free-form sentences, so they can be automatically parsed, filtered, and correlated with metrics and traces.
{"timestamp":"2026-07-20T03:14:02Z","level":"ERROR","service":"orders","message":"DB timeout","trace_id":"a1b2c3d4"}Notice the trace_id field — this is what allows engineers to jump from “I see an error in the logs” to “let me see the full distributed trace for that exact request,” tying the three pillars of observability (metrics, logs, traces) together.
Deployment & Cloud
Monitoring can be deployed in a few different ways, each with its own trade-offs between control, cost, and operational overhead.
12.1 Deployment Models
Self-hosted
You run and maintain the entire stack (e.g. Prometheus + Grafana) on your own servers — full control, more operational work.
Managed / SaaS
A vendor (Datadog, New Relic, Grafana Cloud) runs the backend for you — less maintenance, ongoing subscription cost.
Cloud-native
Your cloud provider’s built-in tools (AWS CloudWatch, Google Cloud Monitoring, Azure Monitor) integrate tightly with that provider’s services.
Hybrid
Combining approaches — e.g. self-hosted Prometheus feeding into a managed long-term storage backend.
12.2 Monitoring in Kubernetes and Containers
In containerised environments, infrastructure is dynamic — containers are created and destroyed constantly, sometimes living for only seconds. Traditional “monitor this fixed server” approaches do not work well here. Instead, tools use service discovery to automatically detect new containers as they appear and start scraping them immediately, then stop when they disappear.
Storage, Caching & Load Balancing
The storage layer of a monitoring system is where scale-related decisions become concrete: how much data you keep, how quickly you can query it, and how much it costs. A few well-chosen techniques dominate here.
13.1 Time-Series Storage Choices
Popular time-series databases include Prometheus’s own TSDB, InfluxDB, TimescaleDB (built on PostgreSQL), and Cortex/Thanos/Mimir (which add long-term, horizontally scalable storage on top of Prometheus). The right choice depends on scale, retention needs, and query patterns.
13.2 Caching
Dashboards are often viewed repeatedly with the same queries (e.g. “last 1 hour” refreshed every 30 seconds). Query results are frequently cached briefly to avoid recomputing the same aggregation over and over, similar to a restaurant pre-chopping common ingredients instead of starting from scratch for every order.
13.3 Load Balancing the Collectors
At large scale, no single collector can scrape every target. Work is split across many collector instances — often using consistent hashing, so each collector “owns” a predictable subset of targets, and if one collector fails, only its subset temporarily loses fresh data rather than the whole system.
13.4 Partitioning
Data is typically partitioned by time (e.g. one storage block per 2-hour window) so that old blocks can be compressed, moved to cheaper storage, or deleted independently — like archiving old filing cabinet drawers by year instead of shuffling through one giant pile.
APIs & Microservices
In a microservices architecture, a single user action might touch a dozen small services. Monitoring becomes essential glue that lets engineers understand this web of interactions.
14.1 Distributed Tracing
When a request enters the system, it is tagged with a unique trace ID. As it passes from service to service, each service records a span — a timed record of the work it did — and all spans are stitched together using that shared trace ID, producing a timeline like the one below.
14.2 APIs for Querying Monitoring Data
Monitoring platforms expose their own APIs (often HTTP + JSON) so other tools can query metrics programmatically — for example, an auto-scaler service asking “what is the average CPU across the fleet right now?” every minute to decide whether to add more servers.
The OpenTelemetry project has become an important industry standard here — a vendor-neutral API and set of libraries for generating metrics, logs, and traces consistently, so you are not locked into one monitoring vendor’s proprietary format.
Design Patterns & Anti-Patterns
A handful of patterns show up in every well-run monitoring stack, and an equally small handful of anti-patterns show up in nearly every troubled one. Recognising them early saves a lot of pain later.
15.1 Good Patterns
- RED method (for services) — track Rate, Errors, Duration.
- USE method (for resources) — track Utilisation, Saturation, Errors.
- Symptom-based alerting — alert on what users actually experience (e.g. high error rate) rather than every possible internal cause.
- Runbooks linked to alerts — every alert links to a document describing exactly how to investigate and fix it.
15.2 Anti-Patterns to Avoid
Common Anti-Patterns
- Alert fatigue — so many noisy alerts that engineers start ignoring all of them, including real emergencies.
- Vanity metrics — tracking numbers that look impressive but do not inform any decision.
- Cardinality explosion — putting unbounded label values (user IDs, raw URLs) into metrics, overwhelming storage.
- Monitoring without ownership — dashboards nobody looks at and alerts nobody responds to.
- Single point of failure — one monitoring server with no redundancy.
Best Practices & Common Mistakes
If a monitoring review turns up any of the common mistakes below, treat it as a reliability risk waiting to happen rather than a purely cosmetic issue.
16.1 The Three Numbers That Matter Most
3 Pillars
Metrics, Logs, Traces — the three foundational data types every observability stack must be able to collect and correlate.
4 Golden Signals
Latency, Traffic, Errors, Saturation — the minimum set every user-facing service should expose out of the box.
1 Source of Truth per Metric
Each metric should have exactly one authoritative definition — conflicting duplicates cause the worst kind of hidden bugs.
16.2 Best Practices
- Alert on symptoms (user-facing impact), not every internal cause.
- Keep dashboards focused — a handful of key graphs beats fifty cluttered ones.
- Set SLOs collaboratively with the teams who own the service.
- Regularly review and prune alerts that never fire or always fire.
- Version-control your monitoring configuration (alerts, dashboards) just like application code.
- Practice incident response with fire drills (“game days”) before a real outage happens.
16.3 Common Mistakes
- Setting alert thresholds arbitrarily instead of based on historical data.
- Forgetting to monitor batch jobs and background workers, not just web servers.
- Not testing that alerts actually reach someone (an untested pager is a false sense of security).
- Collecting everything “just in case” without a plan for retention or cost.
Real-World / Industry Examples
Abstract patterns become much clearer once you see how they have actually played out inside companies operating at global scale. Each of the examples below maps back to a specific concept from earlier in this guide.

Netflix — Atlas
Built Atlas, an in-house time-series monitoring platform, to handle metrics from tens of thousands of instances streaming to hundreds of millions of users, with heavy emphasis on real-time dashboards during regional failovers.
Amazon — CloudWatch
Uses CloudWatch internally and externally, and pioneered the idea that every service should have its own dashboards and automated alarms tied directly to on-call rotations — a foundational SRE practice.
Google — SRE & Borgmon
Popularised Site Reliability Engineering (SRE) and concepts like SLOs and error budgets, using internal tools like Borgmon (a predecessor to Prometheus’s design).
Uber — M3
Built M3, an open-sourced, horizontally scalable metrics platform, to cope with the huge cardinality created by having metrics per city, per driver segment, and per feature flag simultaneously.
A common thread across all of these companies: as scale grows, off-the-shelf tools eventually hit limits, and each company built (and often open-sourced) custom systems focused on cardinality, scale, and reliability — a strong signal of how central monitoring is to running a large digital business.
Frequently Asked Questions
A few of the questions that come up most often when engineers, product managers, or curious readers first work seriously with infrastructure monitoring.
Not exactly. Monitoring is about watching known metrics and alerting on known problems. Observability is a broader property of a system — how well you can understand unknown problems by exploring metrics, logs, and traces together, even ones you never predicted in advance.
Monitoring is typically numeric and continuous (metrics over time), while logging captures discrete text events. They complement each other: metrics tell you that something is wrong; logs often tell you why.
It depends on the use case — 10–15 seconds is common for infrastructure metrics, while business dashboards might only need 1–5 minute resolution. Collecting more frequently increases both insight and cost.
Yes, even a single small server benefits from basic monitoring (disk space, uptime, error rates) — the tools can simply be lighter-weight and simpler at small scale.
It is the allowed amount of unreliability given an SLO. If your SLO is 99.9% uptime, your error budget is the remaining 0.1% — roughly 43 minutes of downtime per month you are allowed before breaching your target.
Yes — overly aggressive scraping, unbounded cardinality, or a bug in an alerting rule can overload systems. This is why monitoring infrastructure needs the same care and resilience thinking as the systems it watches.
Summary & Key Takeaways
Infrastructure monitoring is the practice of continuously observing the health, performance, and behaviour of servers, networks, and applications so that problems can be caught early — ideally before users ever notice. It has evolved from manual checks in the 1980s to today’s highly automated, distributed observability platforms capable of handling millions of data points per second.
Key Takeaways
- Monitoring rests on three pillars: metrics (numbers over time), logs (event records), and traces (request journeys across services).
- A typical architecture flows: instrumentation → exposition → collection → storage → querying → alerting/visualisation.
- SLIs, SLOs, and SLAs turn “is it working?” into a measurable, agreed-upon target.
- At scale, challenges shift toward cardinality control, storage efficiency, and the reliability of the monitoring system itself.
- Good alerting focuses on user-facing symptoms and avoids fatigue-inducing noise.
- Security matters: monitoring systems see everything, so they must be locked down like any other sensitive system.
- Industry leaders like Netflix, Amazon, Google, and Uber all built custom monitoring platforms once they outgrew off-the-shelf tools — proof of how central this discipline is to running reliable software at scale.
Whether you are a developer instrumenting your first service, an SRE tuning alert thresholds, or a manager deciding how much to invest in observability, the underlying idea is worth remembering: you cannot improve what you cannot see, and you cannot see anything without deliberately building the eyes for it.