What Is a Log, in Monitoring Terms?
A beginner-to-production guide to logs: what they actually are at the code level, why every serious system produces them, how logging pipelines are built at companies like Netflix and Uber, and how to use logs correctly without drowning in cost or noise.
The Software Logbook, From Mainframes to Microservices
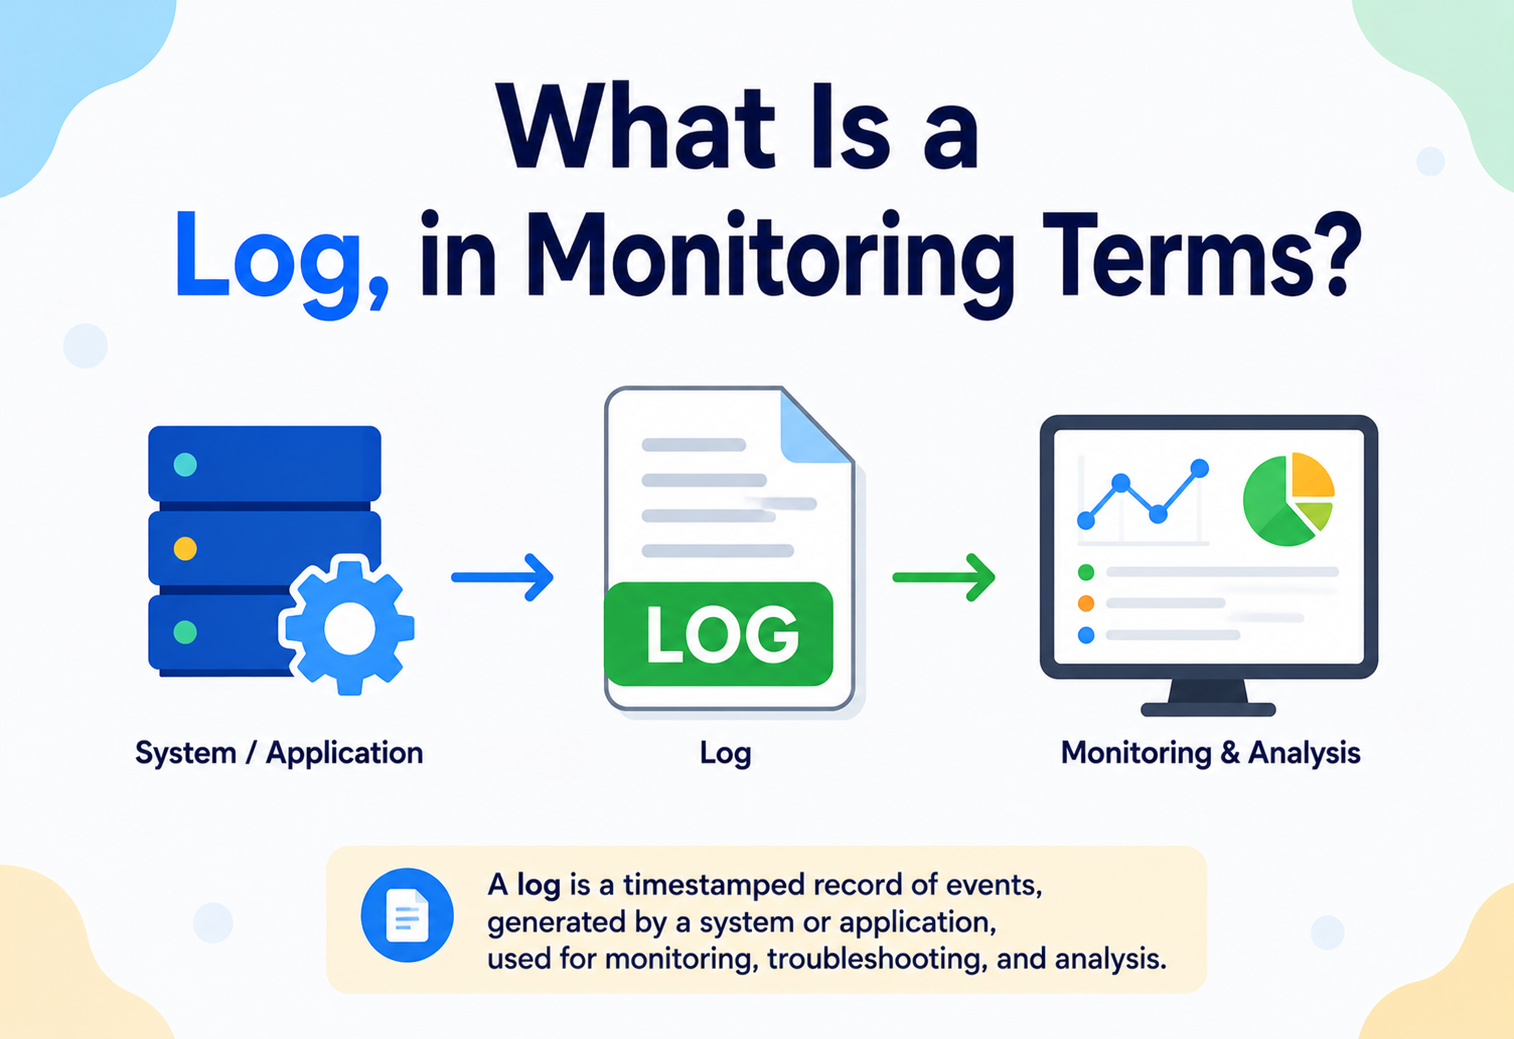
A log is simply the practice of writing down, as text, what a piece of software did and when it did it — so that a human (or another piece of software) can look back later and understand what happened.
Every piece of software, from a tiny script to a global-scale distributed system, does things while it runs: it starts up, it receives requests, it talks to databases, it makes decisions, and — sooner or later — it fails. A log is simply the practice of writing down, as text, what a piece of software did and when it did it, so that a human (or another piece of software) can look back later and understand what happened.
In monitoring and observability terms, a log is one of the “three pillars of observability” — the other two being metrics (numbers over time, like CPU usage or request count) and traces (the path a single request takes across multiple services). A log is the most detailed and most human-readable of the three: it is a timestamped record of a discrete event.
The Captain’s Logbook
Think of a ship’s captain’s logbook. Every few hours, the captain writes down the ship’s position, the weather, any incidents, and decisions made. If the ship runs into trouble weeks later, investigators read the logbook entry by entry to reconstruct exactly what happened, in order, with timestamps. A software log is the same idea — an appliance’s, a server’s, or an application’s logbook.
Your First Log Line
You write a small Java program that adds two numbers. If you add System.out.println("Adding 2 + 3") before the calculation and System.out.println("Result: 5") after, you have just created your first two log lines. That is literally what logging is — printing out what the program is doing, except done in a structured, controllable, and persistent way.
How Logging Grew Up
Logging as a discipline is almost as old as computing itself. Early mainframe operators in the 1950s and 1960s used printed console output — literally paper — to track what a batch job did overnight, because there was no other way to know if a multi-hour job had succeeded or failed. As operating systems matured, Unix popularized the idea of a syslog (system log) in the early 1980s, giving every program on a machine a common way to send text messages to a central place. Syslog (RFC 3164, later RFC 5424) became the de-facto standard for decades, and its severity levels — emergency, alert, critical, error, warning, notice, info, debug — still shape how most logging frameworks think about log levels today.
As applications moved from single machines to clusters, then to hundreds of microservices spread across cloud data centers, the old approach of “SSH into the server and read tail -f app.log” stopped working. You cannot SSH into 500 containers that live for a few minutes each. This problem — needing to see logs from many, many ephemeral sources in one place — is what gave birth to the modern centralized logging stacks (ELK, Loki, Splunk, Datadog, and others) that we will explore throughout this article.
By the end of this guide, you should be able to explain, in concrete terms, what a log actually is at the code level, how a single log line travels from a running Java process to a searchable dashboard, why teams obsess over log levels and structured formats, and how logs fit alongside metrics and traces to form a complete observability strategy for a production system.
Why We Log At All
Metrics answer “what” and “how much.” Logs answer “why” and “what exactly happened, in what order, to which specific request.”
Why do we need logs at all? Because software fails, and it usually fails in ways nobody predicted. A monitoring dashboard might tell you “checkout service error rate spiked to 12% at 3:41 AM,” but it cannot tell you why. Metrics answer “what” and “how much.” Logs answer “why” and “what exactly happened, in what order, to which specific request.”
Imagine a payment service that starts silently failing for 2% of users at 2 AM. Without logs, an engineer only has a vague metric graph showing “errors went up.” They cannot know which users were affected, what error message the downstream bank API returned, whether it was a timeout, a validation failure, or a null pointer exception. Debugging becomes guesswork, and outages drag on for hours instead of minutes.
The motivation for structured, centralized logging comes from several real pains engineering teams hit as systems grow:
- Debugging production issues — you cannot attach a debugger to a live production service handling real customer traffic; logs are often the only forensic evidence available after the fact.
- Auditing and compliance — regulations like SOC 2, HIPAA, PCI-DSS, and India’s DPDP Act require proof of who accessed what data and when. Audit logs are the evidence.
- Understanding user behavior — access logs reveal usage patterns, popular features, and abuse (e.g., bots scraping an API).
- Post-incident analysis — after an outage, teams write a “post-mortem,” and logs are the primary raw material used to build an accurate timeline of what went wrong.
- Distributed systems visibility — in a microservices world, a single user request might touch 15 services. Logs, when correlated with a request ID, let you reconstruct that entire journey.
The core tension that drives most of the design decisions you will see in this article is this: logs are extremely useful, but they are also extremely expensive — in disk space, in network bandwidth, in query cost, and in the cognitive load of searching through noise. Nearly every practice described here — log levels, sampling, structured logging, retention policies — exists to solve one side or the other of this cost-versus-value tradeoff.
A Precise Vocabulary of Logging
Before we can talk about pipelines, we need a shared vocabulary: what a log entry actually is, what severity levels mean, structured vs unstructured, and how logs relate to their two sibling pillars — metrics and traces.
3.1 What Exactly Is a Log Entry?
A log entry (also called a “log line,” “log record,” or “log event”) is a single, discrete, timestamped record describing something that happened. At a minimum, a good log entry has:
| Field | What it means | Example |
|---|---|---|
| Timestamp | Exactly when the event happened, usually in UTC with millisecond precision | 2026-07-20T09:14:32.104Z |
| Level / Severity | How important or serious the event is | ERROR |
| Logger / Source | Which component or class produced it | com.utivra.payments.PaymentService |
| Message | Human-readable description | "Payment declined by gateway" |
| Context fields | Structured metadata attached to the event | userId=8842, orderId=A19X, gateway=razorpay |
3.2 Log Levels (Severity)
Almost every logging framework offers a small set of severity levels so that developers can say “this matters a lot” versus “this is just background noise.” The most common hierarchy, from lowest to highest severity, is:
| Level | Meaning | Typical use |
|---|---|---|
TRACE | Extremely fine-grained, step-by-step detail | “Entering method calculateDiscount() with args…” |
DEBUG | Diagnostic information useful during development | “Cache miss for key user:8842” |
INFO | Normal but noteworthy business events | “Order A19X placed successfully” |
WARN | Something unexpected happened but the system recovered | “Retrying payment gateway call (attempt 2/3)” |
ERROR | An operation failed and needs attention | “Failed to charge card: gateway timeout” |
FATAL | The application cannot continue running | “Unable to connect to database at startup” |
In production, teams typically run at INFO or WARN level to avoid drowning storage systems in DEBUG/TRACE noise, and temporarily raise verbosity for a specific service when investigating an issue.
3.3 Unstructured vs. Structured Logs
This is one of the most important distinctions in modern logging.
2026-07-20 09:14:32 ERROR PaymentService - Payment declined for user 8842, order A19X, reason: insufficient_funds
Easy for a human to read in a terminal, but hard for a machine to search or aggregate — you’d need fragile regular expressions to pull out userId or reason.
{
  "timestamp": "2026-07-20T09:14:32.104Z",
  "level": "ERROR",
  "logger": "com.utivra.payments.PaymentService",
  "message": "Payment declined",
  "userId": 8842,
  "orderId": "A19X",
  "reason": "insufficient_funds",
  "traceId": "7fa9c2e1…"
}
Every field is queryable. You can ask a log system “show me every ERROR where reason=insufficient_funds in the last hour” instantly, without regex gymnastics.
Virtually every production system today uses structured (usually JSON) logging, because centralized log platforms (Elasticsearch, Loki, Splunk) index structured fields far more efficiently than free text.
3.4 Logs vs. Metrics vs. Traces
| Aspect | Logs | Metrics | Traces |
|---|---|---|---|
| Granularity | Per event | Aggregated (counters, gauges) | Per request, across services |
| Volume | Very high | Low, fixed cardinality | Medium |
| Best for | Root-cause debugging | Trend detection, alerting | Latency analysis across services |
| Storage cost | High | Low | Medium |
| Example tool | ELK, Loki, Splunk | Prometheus, Datadog | Jaeger, Zipkin, Tempo |
3.5 Correlation IDs
In a microservices system, a single user click might fan out into calls to 10 different services. A correlation ID (also called a trace ID or request ID) is a unique identifier generated at the very edge of the system (e.g., the API gateway) and passed along with every downstream call, and included in every log line written along the way. This lets an engineer search “traceId=7fa9c2e1” and see the entire journey of that one request across every service, in the correct order.
Courier Tracking Number
A correlation ID is like a courier tracking number. When you ship a parcel, the courier stamps the same tracking number on it at every warehouse it passes through. Even though the parcel is handled by ten different people in ten different cities, anyone can type that one number into a website and see its complete journey, in order. A trace ID does the same for a request bouncing across microservices.
Uber Ride Requests
At a company like Uber, a single “request a ride” action can touch the routing service, the pricing service, the driver-matching service, and the payments service. Every one of those services logs with the same trace ID, so when a ride fails to match a driver, an engineer searches for that one trace ID and instantly sees the exact service and exact reason the flow broke — without needing to guess which of dozens of services was at fault.
3.6 Log Formats and Parsers
Before structured JSON logging became standard, most logs were free text that had to be parsed using patterns. A classic example is the Apache/Nginx Common Log Format:
127.0.0.1 - - [20/Jul/2026:09:14:32 +0000] "GET /api/orders HTTP/1.1" 200 512To extract structured fields (IP, timestamp, method, path, status, size) from a line like this, log processors like Logstash use a pattern-matching syntax called Grok, which is essentially a library of reusable named regular expressions:
%{IP:clientIp} - - \[%{HTTPDATE:timestamp}\] "%{WORD:method} %{URIPATH:path} HTTP/%{NUMBER}" %{NUMBER:status} %{NUMBER:bytes}Grok parsing works, but it is fragile — a small, unexpected change in the log format from a library upgrade can silently break every downstream Grok pattern that depends on it. This exact fragility is the strongest practical argument for structured (JSON) logging: when the application emits fields directly as JSON, there is nothing left to parse or guess at.
Anatomy of a Production Logging Pipeline
A production logging system is not just “the app writes a file.” It is a full pipeline with several distinct stages, each with its own component — each one solving a specific reliability, cost, or scaling concern.
4.1 Application (the Source)
The application code itself, using a logging library (e.g., SLF4J + Logback in Java, Winston in Node.js, structlog in Python) to emit log lines — usually to standard output (stdout) in containerized environments, or to a local file on traditional VMs.
4.2 Log Agent / Shipper
A lightweight background process running on every host or as a sidecar container that reads new log lines and forwards them elsewhere. Popular shippers: Filebeat, Fluent Bit, Fluentd, Vector, and cloud-native agents like the AWS CloudWatch agent. The agent’s job is to be small, fast, and resilient — it should buffer logs locally if the network is briefly down, and never crash the application it’s attached to.
4.3 Message Broker (Buffer Layer)
At high scale, shipping logs directly into the storage system can overwhelm it during traffic spikes. Companies insert a durable buffer — commonly Apache Kafka or AWS Kinesis — between the shippers and the processors. This decouples “how fast logs are produced” from “how fast they can be indexed,” smoothing out bursts.
4.4 Log Processor / Pipeline
Tools like Logstash or Fluentd parse, enrich, filter, and transform log lines before they are stored — for example, parsing a plain-text Apache access log line into structured fields, adding a datacenter tag, or dropping noisy DEBUG lines entirely.
4.5 Storage & Index
The database that holds logs and makes them searchable. Elasticsearch (the “E” in ELK) is the most common choice — it builds an inverted index over every field so free-text and structured search are both fast. Grafana Loki takes a different, cheaper approach: it indexes only labels (like service=payments) and stores the raw log text compressed, trading some search flexibility for far lower cost.
4.6 Query & Visualization
Kibana (for Elasticsearch) or Grafana (for Loki, and increasingly for Elasticsearch too) provide the UI where engineers search logs, build dashboards, and correlate logs with metrics.
4.7 Alerting Engine
Rules that scan incoming logs (or metrics derived from logs) and fire notifications — e.g., “if more than 50 ERROR logs containing ‘OutOfMemoryError’ appear in 5 minutes, page the on-call engineer.”
4.8 Push vs. Pull Collection Models
There are two broad philosophies for how logs travel from an application to central storage:
| Model | How it works | Tradeoff |
|---|---|---|
| Push | The application (or its sidecar agent) actively sends log data outward to a collector | Simple and low-latency, but the app or agent must handle retries and backpressure itself |
| Pull | A central agent periodically reads (tails) log files or streams that the application merely writes locally | Decouples the app from network concerns entirely, but adds a small collection delay and requires the agent to track “where it left off” reading each file |
Most container-native pipelines (Fluent Bit as a Kubernetes DaemonSet) use a pull-like model — tailing the container runtime’s log files — while some cloud-native SDKs push log batches directly to a managed endpoint like CloudWatch Logs.
4.9 What a Good Log Agent Must Guarantee
Because the log agent sits directly in the critical path of observability without being allowed to affect the primary application’s performance, it carries several non-negotiable responsibilities:
- Low resource footprint — it should use a small, bounded amount of CPU and memory, since it runs alongside (or inside) every production host.
- Never block the application — a slow or unreachable downstream should never cause the application itself to stall or crash.
- At-least-once delivery — it should retry on failure using local buffering, accepting the small risk of duplicate log lines over the much worse risk of silently losing data.
- Graceful handling of log rotation — if it’s tailing a file that gets rotated out from under it, it must detect the rotation and switch to the new file without losing or duplicating lines.
How Logging Actually Happens in Code
Let’s ground this in Java, since that’s the primary stack used in most enterprise backend systems (including Spring Boot services). The same ideas — facade, structured emission, thread-local context, and async buffering — apply almost identically in other languages.
5.1 SLF4J: The Facade Pattern in Action
Java applications almost universally use SLF4J (Simple Logging Facade for Java) as an abstraction layer, with Logback (Spring Boot’s default) or Log4j2 doing the actual work underneath. This is a textbook example of the Facade design pattern: your code depends only on the SLF4J interface, so you can swap the underlying implementation without touching business code.
import org.slf4j.Logger;
import org.slf4j.LoggerFactory;
import net.logstash.logback.argument.StructuredArguments;

public class PaymentService {

    private static final Logger log = LoggerFactory.getLogger(PaymentService.class);

    public void chargeCard(String userId, String orderId, double amount) {
        log.info("Attempting payment charge",
                StructuredArguments.kv("userId", userId),
                StructuredArguments.kv("orderId", orderId),
                StructuredArguments.kv("amount", amount));
        try {
            paymentGateway.charge(userId, amount);
            log.info("Payment succeeded", StructuredArguments.kv("orderId", orderId));
        } catch (GatewayTimeoutException e) {
            log.warn("Gateway timeout, will retry",
                    StructuredArguments.kv("orderId", orderId),
                    StructuredArguments.kv("attempt", 1));
        } catch (PaymentDeclinedException e) {
            log.error("Payment declined",
                    StructuredArguments.kv("orderId", orderId),
                    StructuredArguments.kv("reason", e.getReason()), e);
        }
    }
}
Note that the exception object e is passed as the last argument to log.error — this tells Logback to print the full stack trace, which is essential for debugging.
5.2 Configuring JSON Output with Logback
To make logs machine-parseable, Spring Boot applications typically configure Logback to emit JSON using the logstash-logback-encoder library:
<!-- logback-spring.xml -->
<configuration>
    <appender name="STDOUT" class="ch.qos.logback.core.ConsoleAppender">
        <encoder class="net.logstash.logback.encoder.LogstashEncoder">
            <includeMdcKeyName>traceId</includeMdcKeyName>
            <includeMdcKeyName>userId</includeMdcKeyName>
        </encoder>
    </appender>
    <root level="INFO">
        <appender-ref ref="STDOUT" />
    </root>
</configuration>
5.3 MDC — Mapped Diagnostic Context
How does every log line in a request automatically get the same traceId without manually passing it into every log statement? The answer is MDC (Mapped Diagnostic Context) — a thread-local map that a filter populates at the start of a request and clears at the end:
import org.slf4j.MDC;
import javax.servlet.*;
import java.util.UUID;

public class TraceIdFilter implements Filter {
    @Override
    public void doFilter(ServletRequest req, ServletResponse res, FilterChain chain)
            throws java.io.IOException, ServletException {
        String traceId = UUID.randomUUID().toString();
        MDC.put("traceId", traceId);
        try {
            chain.doFilter(req, res);
        } finally {
            MDC.clear(); // critical: prevents leaking traceId into the next request
                         // on the same pooled thread
        }
    }
}Forgetting MDC.clear() in a finally block is a classic production bug: because application servers reuse threads from a pool, a stale traceId from a previous request can silently leak into the logs of a completely unrelated later request, corrupting your ability to trace issues.
5.4 How Log Level Filtering Avoids Wasted Work
A subtle but important internal detail: when you call log.debug(...) in a service that is configured to run at INFO level, the framework checks the configured level before doing any expensive work. This is why parameterized logging matters so much — SLF4J’s log.debug("value={}", expensiveObject) only calls expensiveObject.toString() if DEBUG is actually enabled, whereas log.debug("value=" + expensiveObject) always builds the string in Java, regardless of whether it will ever be printed, because string concatenation happens before the method call.
Radio Squelch Control
Log levels work like a radio squelch control. If you set your walkie-talkie to only let through “urgent” transmissions, quiet background chatter never reaches your speaker at all — the radio doesn’t even bother processing it. Setting a logger to INFO level means DEBUG-level “chatter” is filtered at the source, before it ever costs you disk space or CPU time.
The Million-Iteration Loop
If you write log.debug("Loop iteration: " + i) inside a loop that runs a million times, but your logger is set to INFO, nothing gets printed — yet Java still executes the string concatenation a million times. Switching to log.debug("Loop iteration: {}", i) avoids that wasted work entirely.
5.5 How the Write Actually Happens: Buffering and I/O
Internally, a logging framework does not usually write to disk synchronously on every single call, because disk I/O is slow relative to CPU work and would throttle your application’s throughput. Instead:
- The log call formats the message and appends it to an in-memory ring buffer (Log4j2’s
AsyncAppenderis a well-known example, built on the LMAX Disruptor library). - A dedicated background thread drains that buffer and writes to the actual destination (console, file, or network socket) in batches.
- If the buffer fills up faster than it can drain (e.g., a logging storm), the framework must decide: block the application thread, drop the log message, or grow the buffer. This is a real production tradeoff — async logging under extreme load can silently drop logs.
One Log Entry, Traced End to End
A single log line is not born in one place and consumed in another — it travels through a real distributed system on its way from the application to a human’s screen. Let’s trace that journey.
log.info() call inside an application to a Kibana search result — passing through an in-memory buffer, a shipper, Kafka, a processor, and finally the indexed store.The full lifecycle of one log entry, end to end, typically goes through these stages:
- Emission — application code calls
log.info(...), which formats a structured event with timestamp, level, and context fields. - Local buffering — the event sits briefly in memory to avoid blocking the request thread.
- Write to stdout/file — in containerized systems (Docker/Kubernetes), applications write to stdout, and the container runtime captures it; on VMs, it’s often written directly to a rotating log file.
- Collection by an agent — Filebeat/Fluent Bit tails the container’s log stream or the file, batching lines for efficiency.
- Transport — sent over the network, often through a durable buffer like Kafka, to survive downstream outages without losing data.
- Parsing & enrichment — a processor adds fields like
k8s.pod.name,region, or geo-IP lookups, and may redact sensitive fields. - Indexing — the log storage engine writes the event into an index (Elasticsearch) or a compressed chunk (Loki), making it searchable within seconds.
- Querying — engineers or automated alerts search the indexed logs.
- Retention & expiry — after a configured period (e.g., 30 days hot, 90 days cold, 1 year archived), old logs are moved to cheaper storage or deleted entirely to control cost and meet compliance rules.
Signal vs. Cost, the Central Logging Trade-off
Every design decision in logging is downstream of one fundamental tension: logs are the most useful diagnostic data you have, and they are simultaneously the most expensive.
Pros
- Extremely detailed — captures exact values, not just aggregates.
- Human-readable, great for root-cause analysis.
- Works even for unanticipated failure modes (“unknown unknowns”).
- Provides an audit trail for compliance.
- Structured logs are easily queried and aggregated.
Cons / Trade-offs
- Very high storage and processing cost at scale.
- Slower to query than pre-aggregated metrics.
- High cardinality fields can explode index size.
- Risk of leaking sensitive data (PII, secrets) if not careful.
- Excess logging can itself slow down the application (I/O overhead).
The central engineering tradeoff is signal vs. cost: logging everything at DEBUG level in production gives maximum forensic detail but can 10x your storage bill and slow ingestion pipelines; logging too sparingly saves money but leaves you blind during an incident. Most teams settle on INFO-level logging in production with the ability to dynamically raise log levels for a specific class or service when investigating an issue — without redeploying.
The Arithmetic of Logging at Scale
At scale, logging stops being a language-library concern and becomes an infrastructure line item. The numbers below are what drive every real decision about sampling, retention, and pipeline design.
8.1 Log Volume at Scale
A single moderately busy microservice handling 1,000 requests per second, logging 3 lines per request at ~300 bytes each, produces roughly 900 KB per second — over 75 GB per day, from just one service. Multiply that by hundreds of microservices, and centralized logging systems at large companies routinely ingest terabytes per day.
8.2 Sampling
To control cost, teams apply sampling — deliberately dropping a percentage of low-value logs (typically DEBUG/TRACE, or successful high-volume routine events) while always keeping 100% of ERROR and WARN logs. A common pattern: keep all logs for the first N seconds of an incident (burst logging) and sample down during steady state.
8.3 Cardinality
Cardinality refers to the number of unique values a field can take. A field like httpMethod has low cardinality (GET, POST, PUT…). A field like userId or orderId has extremely high cardinality (millions of unique values). Structured logging systems like Elasticsearch handle high-cardinality fields reasonably well because they full-text index everything, but metrics systems like Prometheus break badly if you attach a high-cardinality label to a metric — this is precisely why logs and metrics are separate tools with separate cost models.
8.4 Batching and Compression
Shippers batch dozens or hundreds of log lines into a single network request rather than sending one request per line, dramatically reducing network overhead. Storage systems like Loki compress raw log chunks (often with gzip or snappy), commonly achieving 10x or greater compression on repetitive log text.
Uber’s internal logging platform historically ingested well over 10 petabytes of log data per day across its microservices fleet, which is why companies at that scale build custom log pipelines on top of Kafka rather than relying on out-of-the-box tooling — the economics of storage and query at that volume demand serious engineering investment.
8.5 Working Through a Simple Cost Calculation
It helps to see the arithmetic that drives so many logging decisions. Suppose a fleet of 50 microservices each handles 500 requests per second at peak, and each request produces 4 structured log lines averaging 400 bytes:
- Bytes per second per service: 500 × 4 × 400 = 800,000 bytes/sec ≈ 0.76 MB/sec
- Across 50 services: ≈ 38 MB/sec at peak
- Over a day, even assuming average traffic is a third of peak: roughly 1 TB of raw log data per day
- At typical managed log-platform pricing (which can range widely, often in the ballpark of a dollar or more per GB ingested plus separate storage costs), this single fleet’s logs alone can become a five- or six-figure annual line item.
This is exactly why sampling, log-level discipline, shorter retention for low-value logs, and compression are not just “nice to have” — for any company beyond a handful of services, they are the difference between a manageable observability bill and one that rivals the cost of running the services themselves.
8.6 Choosing a Logging Stack: A Quick Comparison
| Stack | Indexing approach | Typical cost profile | Best fit |
|---|---|---|---|
| ELK (Elasticsearch, Logstash, Kibana) | Full-text inverted index on every field | Higher — indexing everything is compute- and storage-intensive | Rich ad-hoc search needs, security/SIEM use cases |
| Grafana Loki | Index labels only; compress raw text | Lower — much cheaper at high volume | Kubernetes-native teams already using Grafana/Prometheus |
| Splunk | Proprietary indexing, very feature-rich | Often the highest, licensed by data volume | Large enterprises, compliance-heavy environments |
| Managed cloud (CloudWatch/Cloud Logging) | Provider-managed | Convenient but can get expensive at scale | Teams wanting zero operational overhead |
Keeping the Logging Pipeline Alive When Things Break
A logging pipeline is itself a distributed system, and it needs the same reliability thinking as any other production system — arguably more, because during an outage of the primary application, engineers depend on logs working correctly to diagnose it.
9.1 Durable Buffering with Kafka
Placing Kafka between shippers and the indexing layer means that if Elasticsearch goes down or falls behind, log events sit safely in Kafka’s replicated, disk-backed topics rather than being lost. Kafka’s replication (each partition copied across multiple brokers) ensures that even a broker failure doesn’t lose log data — this directly echoes the same replication concepts used in databases.
9.2 Local Disk Buffering in the Agent
Good log shippers (Fluent Bit, Vector) write to a local on-disk buffer before attempting network delivery. If the network to Kafka is briefly unavailable, the agent keeps retrying from its local buffer instead of dropping data — a form of at-least-once delivery.
9.3 Failure Recovery and Backpressure
When downstream systems slow down, agents must apply backpressure — slowing down how fast they read new logs — rather than either crashing or unboundedly growing memory. This is conceptually the same problem as rate limiting and circuit breakers in application architecture, just applied to the logging pipeline itself.
9.4 CAP Theorem Applied to Log Storage
Distributed log stores like Elasticsearch are subject to the same CAP theorem tradeoffs as any distributed database: during a network partition between nodes, Elasticsearch favors availability (it keeps serving reads/writes from whichever nodes it can reach) over strict consistency — meaning a search performed during a partition might momentarily miss very recent log entries that haven’t yet replicated, a perfectly acceptable tradeoff for a logging system, unlike, say, a banking ledger.
9.5 Disaster Recovery for Logs
Many regulated companies replicate their log storage across regions or maintain periodic snapshots/backups of indices, so that logs required for a compliance audit survive even a full data-center loss.
Two Sides of the Log Security Coin
Logs are a favorite target for two very different reasons: attackers want to erase logs to hide their tracks, and logs themselves can accidentally become a data leak if developers aren’t careful.
10.1 Never Log Secrets or PII
log.info("User login: username={}, password={}", username, password);
This is a severe security bug. Passwords, credit card numbers, auth tokens, and personally identifiable information (PII) like Aadhaar numbers or full addresses should never appear in logs, because logs are typically retained for weeks or months, replicated to multiple systems, and accessed by a wide set of engineers — a much larger attack surface than the primary database.
10.2 Redaction and Masking
Production logging pipelines commonly apply automated redaction rules — for example, replacing anything matching a card-number pattern with ****-****-****-1234 — as a safety net at the processor stage, in addition to developer discipline at the source.
10.3 Log Integrity and Tamper Resistance
For audit and security logs specifically (e.g., “who accessed this patient record”), systems often write logs to append-only storage and sometimes cryptographically hash chains of log entries, so that any attempt to modify a historical entry is detectable — an approach borrowed from blockchain-style tamper evidence.
10.4 Access Control on Log Platforms
Not every engineer should be able to search every log. Centralized platforms like Elasticsearch/Kibana support role-based access control so that, for instance, only the payments team can query payment-service logs containing partial card data, while all engineers can see generic application logs.
10.5 Log Injection Attacks
If user-supplied input is written into logs unsanitized, an attacker can inject fake log lines (e.g., embedding newline characters and a forged “INFO: admin login successful” line) to confuse investigators — a class of vulnerability similar to SQL injection, mitigated by using structured logging (which encodes values as distinct JSON fields rather than concatenating raw strings).
10.6 Attackers Targeting Logs Directly
Logs are not just a passive record — they are frequently a direct target during an attack. A common step in a real intrusion is for the attacker to delete or truncate local log files right after gaining access, specifically to slow down the incident response team. This is one of the strongest arguments for shipping logs off the source host immediately and continuously, rather than only when someone remembers to back them up: once a log line has left the compromised machine and reached a separate, access-controlled log store, an attacker with control of the original host can no longer erase the evidence.
10.7 Regulatory Context: GDPR and India’s DPDP Act
Data protection regulations directly affect how logs must be handled. Under frameworks like the EU’s GDPR and India’s Digital Personal Data Protection (DPDP) Act, 2023, logs that contain personal data are themselves considered personal data, subject to the same principles of data minimization, purpose limitation, and the right to erasure. In practice, this means engineering teams cannot simply log “everything, forever” — they must be deliberate about which fields are personal data, apply appropriate redaction, and enforce retention limits so that personal data doesn’t linger in log storage indefinitely after it’s no longer needed.
Turning Logs Into Alerts
Logs become truly powerful for monitoring when they are turned into actionable signals rather than just being a place to search after something has already gone wrong.
11.1 Log-based Metrics
Many observability platforms let you derive a metric directly from a log stream — for example, counting the rate of ERROR level log lines matching PaymentDeclinedException per minute, and graphing that count as a time series just like any other metric.
11.2 Alerting on Logs
Alert rule (pseudo-config):
  name: high-payment-failure-rate
  query: level:ERROR AND logger:PaymentService AND message:"Payment declined"
  window: 5m
  threshold: count > 50
  action: page on-call-payments
This kind of alert catches issues metrics alone might miss, because it’s watching for a specific, named failure signature rather than just an aggregate error percentage.
11.3 Dashboards
Kibana and Grafana dashboards commonly show top error messages, error rate over time by service, and geographic/user distribution of failures — all built directly from indexed log data.
11.4 Structured Logging Enables SLOs
Because structured logs carry precise fields like httpStatus and latencyMs, teams often compute Service Level Indicators (SLIs) directly from access logs — e.g., “percentage of requests with httpStatus < 500 and latencyMs < 300” — feeding directly into SLA and SLO tracking.
11.5 Correlating Logs, Metrics, and Traces
Modern observability platforms (Datadog, Grafana, New Relic) let an engineer click on a spike in a metrics dashboard and jump directly to the exact log lines and distributed trace spans from that same time window and service — this “three pillars, one pane of glass” workflow is the current industry gold standard for incident response.
Logging in Containers and the Cloud
Container orchestration platforms, managed cloud services, and traditional VMs each have distinct logging conventions. Getting them right is what separates “you can search logs” from “you can’t.”
12.1 Container-native Logging
In Kubernetes, the standard convention is that applications write logs to stdout/stderr rather than to files inside the container. The container runtime (containerd/Docker) captures this stream, and a node-level agent (often Fluent Bit, deployed as a DaemonSet — one copy per node) tails these streams for every pod on that node and ships them centrally. This avoids the headache of managing persistent log files inside ephemeral, frequently-restarted containers.
12.2 Managed Cloud Logging Services
| Cloud | Managed logging service |
|---|---|
| AWS | CloudWatch Logs |
| GCP | Cloud Logging (formerly Stackdriver) |
| Azure | Azure Monitor Logs / Log Analytics |
These services remove the operational burden of running your own Elasticsearch cluster, at the cost of vendor lock-in and, at high volume, often higher per-GB pricing than a self-managed stack.
12.3 Log Rotation on Traditional VMs
On non-containerized servers, tools like logrotate (Linux) automatically rotate log files once they hit a size or age threshold — compressing the old file and starting a fresh one — preventing a runaway log file from filling the disk and crashing the server.
12.4 Retention Policies and Tiered Storage
A typical production retention policy: 7–30 days of logs in “hot” storage (fast SSD-backed, fully indexed, for active debugging), 90 days in “warm” or “cold” storage (cheaper, slower to query), and 1+ years in cheap object storage like Amazon S3 (for compliance, rarely queried, often not even indexed). This tiering directly mirrors the hot/warm/cold data architecture patterns used in data warehousing.
How Search Over Billions of Log Lines Stays Fast
The reason you can type a query into Kibana and get results in a second, even when the underlying store holds billions of log entries, is a few well-understood data-structure and load-distribution tricks — and a deliberate cost trade-off between Elasticsearch- and Loki-style stores.
13.1 Elasticsearch’s Inverted Index
Elasticsearch stores logs in indices, which are internally split into shards distributed across nodes — the same sharding concept used in horizontally-scaled databases. Each shard maintains an inverted index: a data structure mapping each distinct word to the list of documents (log entries) containing it, which is what makes free-text search across billions of log lines fast.
13.2 Time-based Indices
Because logs are almost always queried by recent time range, a common pattern is to create a new index per day (e.g., logs-2026-07-20). This makes deleting old data trivial (just drop yesterday’s index rather than deleting individual documents) and lets queries skip irrelevant indices entirely.
13.3 Loki’s Label-based Approach
Grafana Loki deliberately avoids full-text indexing every log line (unlike Elasticsearch) — it only indexes a small set of labels (like service, namespace, pod) and stores the actual log text as compressed chunks. This makes Loki dramatically cheaper to run at scale, at the cost of slower free-text search within a label’s logs, since Loki has to grep through compressed chunks rather than jump straight to an index.
13.4 Load Balancing Log Ingestion
Log processors (Logstash instances, Fluentd nodes) typically sit behind a load balancer or, more commonly, are organized as consumer groups reading from partitioned Kafka topics — each consumer instance handling a subset of partitions, which is a natural, built-in form of horizontal load distribution without needing an explicit load balancer in front.
13.5 Caching in Log Query Layers
Frequently-run dashboard queries (e.g., “error count for the last hour,” refreshed every 10 seconds) are often cached briefly at the query layer to avoid hammering the underlying index cluster with near-identical repeated queries — the same caching principle used to protect any hot-path database.
13.6 Replication for Log Durability
Just like a primary application database, Elasticsearch indices are typically configured with one or more replica shards — full copies of each primary shard held on a different node. If a node holding a primary shard fails, Elasticsearch promotes a replica to primary automatically, so recent log data survives individual node failures without operator intervention. This is the same replication concept covered in database internals, applied to a search-oriented data store instead of a transactional one.
13.7 A Worked Query Example
To make this concrete, here’s what a structured log query looks like in Elasticsearch’s query DSL, searching for payment failures for a specific user in the last hour:
GET /logs-2026.07.20/_search
{
  "query": {
    "bool": {
      "must": [
        { "match": { "level": "ERROR" } },
        { "match": { "logger": "PaymentService" } },
        { "match": { "userId": 8842 } }
      ],
      "filter": [
        { "range": { "timestamp": { "gte": "now-1h" } } }
      ]
    }
  },
  "sort": [ { "timestamp": "asc" } ]
}
Because userId, level, and logger were indexed as distinct structured fields at ingestion time, this query returns in milliseconds even across an index holding hundreds of millions of log entries — a search that would be practically impossible to run efficiently against raw, unstructured text files at that volume.
Logging Across Service Boundaries
Once logging leaves a single process and starts spanning services, queues, mobile apps, and third-party APIs, correlation and consistency become the whole ball game.
14.1 Propagating Correlation IDs Across Service Boundaries
In a microservices architecture, the correlation ID discussed earlier must be passed along in every outbound HTTP call, typically as a header:
// Outgoing call from order-service to payment-service
HttpHeaders headers = new HttpHeaders();
headers.set("X-Trace-Id", MDC.get("traceId"));
RestTemplate restTemplate = new RestTemplate();
HttpEntity<Void> entity = new HttpEntity<>(headers);
restTemplate.exchange(paymentServiceUrl, HttpMethod.POST, entity, PaymentResponse.class);

// Incoming filter on payment-service reads the same header
String incomingTraceId = request.getHeader("X-Trace-Id");
MDC.put("traceId", incomingTraceId != null ? incomingTraceId : UUID.randomUUID().toString());
14.2 Distributed Tracing Standards
Modern systems increasingly rely on the OpenTelemetry standard, which unifies how traceIds, span IDs, and log correlation work across languages and frameworks, replacing the older, fragmented, vendor-specific approaches.
14.3 Structured API Access Logs
API gateways (like Kong, or a Spring Cloud Gateway) commonly emit a structured access log per request, capturing method, path, statusCode, latencyMs, clientIp, and userId — this single log stream is often enough to build most of an API’s operational dashboard.
14.4 Logging in Event-driven Microservices
When services communicate asynchronously (e.g., via Kafka events using the outbox pattern), the correlation ID must be embedded in the event payload itself, since there’s no synchronous HTTP header to piggyback on — a subtlety teams often get wrong when first adopting event-driven architectures.
14.5 Client-side and Mobile Logging
Logging isn’t only a backend concern. Mobile apps and browser-based frontends also generate logs — crash reports, JavaScript console errors, user-flow breadcrumbs — which are typically batched locally on the device and uploaded to a backend endpoint (or a service like Sentry or Firebase Crashlytics) once connectivity is available. A well-designed system passes the same correlation ID from the client all the way through the API gateway and into every backend service, so an engineer investigating a customer complaint like “the app froze on checkout” can trace that single session from the phone’s local logs through to the exact backend call that stalled.
14.6 Rate Limiting Log Volume from Noisy Clients
Public-facing APIs sometimes face a specific problem: a single misbehaving client (buggy mobile app version, retry loop, or bot) can generate a disproportionate share of log volume by hammering an endpoint that keeps failing and logging an error each time. Many gateways apply per-client log sampling or rate limiting specifically to logging output — separate from request rate limiting — so that one noisy client cannot drown out signal from everyone else in the shared log stream.
Shapes That Help, and Shapes That Silently Hurt
Most logging pain in production isn’t caused by choosing the wrong tool; it’s caused by repeating a small set of anti-patterns everywhere. Naming them makes them dramatically easier to spot in code review.
15.1 Good Patterns
- Structured logging everywhere — always emit key-value fields, never free-form string concatenation.
- Correlation ID propagation — every request gets one ID that flows through every service and every log line it touches.
- Contextual loggers — attaching request-scoped context (userId, tenantId) once via MDC rather than repeating it in every log call.
- Log at boundaries — log when a request enters/exits a service, and when calling external systems (databases, third-party APIs), rather than logging every internal function call.
- Dynamic log level control — using tools like Spring Boot Actuator’s
/loggersendpoint to raise a specific package’s log level at runtime, without a redeploy.
15.2 Anti-patterns to Avoid
catch (Exception e) {
    log.error("Something went wrong", e);
    throw e; // caller logs it AGAIN when it catches this
}
Logging an exception and then re-throwing it usually causes the same error to be logged multiple times at different layers, cluttering the log stream and making error counts misleading. Generally, log where you handle the exception, not at every layer it passes through.
log.debug("value=" + expensiveToString(obj));
This builds the string even if DEBUG is disabled, wasting CPU. Use parameterized logging instead: log.debug("value={}", obj) — SLF4J only calls toString() if DEBUG is actually enabled.
Print statements bypass log levels, structured formatting, and centralized shipping entirely — they cannot be turned off, filtered, or searched centrally, making them close to useless in a production distributed system.
Emitting a log line per iteration of a loop processing 100,000 records will flood your logging pipeline and can noticeably slow the loop itself; log a summary before/after instead, or sample.
A Practical Checklist Your Future Self Will Thank You For
The gap between a team whose logs are useful during a 3 AM incident and one whose logs are useless is almost entirely a matter of a small set of habits, practiced consistently.
- Use structured (JSON) logging in every production service.
- Always include a correlation/trace ID.
- Log actionable events, not everything — ask “will anyone ever query this?”
- Never log secrets, passwords, tokens, or full PII.
- Set sensible retention policies per log type (security/audit logs often need longer retention than debug logs).
- Alert on log patterns that indicate real problems, not every occurrence of every exception.
- Use consistent field names across all services (
userId, notuser_idin one service anduidin another) so cross-service queries actually work. - Regularly review and prune noisy, low-value log statements — logging code needs maintenance just like any other code.
16.2 Changing Log Levels Safely in Production
Spring Boot Actuator exposes a /actuator/loggers endpoint that lets an operator change a specific package’s log level at runtime, without restarting the service:
POST /actuator/loggers/com.utivra.payments
Content-Type: application/json

{ "configuredLevel": "DEBUG" }
This is invaluable during an active incident: an engineer can temporarily raise verbosity for just the suspect component, capture the extra detail needed to diagnose the issue, and then immediately dial it back down to INFO once the investigation is done — avoiding the cost and noise of leaving DEBUG logging on permanently across the whole service.
16.3 Common Mistakes
| Mistake | Consequence | Fix |
|---|---|---|
| Logging at DEBUG in production by default | Massive storage cost, noisy searches | Default to INFO; enable DEBUG selectively per-incident |
| Inconsistent field naming across services | Cannot correlate logs across a request’s full journey | Adopt a shared logging schema/library org-wide |
| No retention policy | Storage grows unbounded, costs spiral | Configure index lifecycle management (ILM) policies |
| Treating logs as the only observability signal | Slow, expensive debugging; missed trends | Combine with metrics and traces |
| Logging full request/response bodies always | PII leakage, huge storage cost | Log selectively, redact sensitive fields |
How Real Companies Actually Handle Logs
Once the numbers get large enough, logging stops being a library configuration and starts being a serious engineering product on its own. Here’s how a few well-known teams shape their approach.
Netflix
Netflix’s engineering blog has described building large-scale internal logging and telemetry pipelines to handle the immense event volume generated by its microservices fleet serving hundreds of millions of members, using a combination of Kafka-based pipelines and purpose-built stream processing to keep both cost and query latency manageable at that scale.
Uber
Uber built its own logging platform (internally centered around Kafka and Elasticsearch-family technology) specifically because off-the-shelf ELK deployments could not economically handle the petabyte-scale daily log volume generated across its global microservices, illustrating how, past a certain scale, logging infrastructure itself becomes a serious engineering product.
Google’s internal logging and monitoring philosophy, described in the widely-read Site Reliability Engineering book, emphasizes that logs should support well-defined Service Level Objectives (SLOs) and that engineers should be deliberate about what is logged, because indiscriminate logging at Google’s scale would be operationally and financially unsustainable.
E-commerce Checkout
When you complete a purchase on an online store, dozens of log lines are typically generated in milliseconds — inventory check, price calculation, payment gateway call, order confirmation, email trigger — each carrying the same order ID so that if your payment ever “gets stuck,” a support engineer can search that one ID and see the exact step where the order flow failed.
Common Questions and What to Carry Away
A quick round of the questions people ask most often about logging — followed by a short, portable summary you can bring into any design review.
No. A log is a discrete, detailed record of one event; a metric is an aggregated number (like a count or average) tracked over time. Metrics are cheap and great for dashboards and alerting on trends; logs are expensive but essential for understanding exactly what happened in a specific case.
No. Log meaningful events — request boundaries, state changes, errors, and external calls. Logging every internal function call creates enormous noise and cost with little debugging value.
An application log records technical events for debugging (errors, request flow). An audit log specifically records security- and compliance-relevant actions (who accessed or changed what), and typically has stricter retention, integrity, and access-control requirements.
It depends on the log type and regulatory requirements — debug logs might live 7–14 days, application/audit logs often 90 days to several years depending on industry regulations (e.g., financial or healthcare compliance frameworks).
Not effectively on their own. Logs are best used alongside metrics (for trend detection and alerting) and traces (for cross-service latency analysis) — this combination is what “observability” means in modern systems.
Elasticsearch indexes every field, giving powerful, flexible free-text search at higher storage and compute cost. Loki indexes only a small set of labels and keeps raw text compressed, which is much cheaper at scale but makes searching within a label’s logs comparatively slower, since it has to scan compressed chunks rather than jump straight to a pre-built index. Teams already invested in Grafana/Prometheus for metrics, and running on Kubernetes, often lean toward Loki for cost reasons; teams with heavy, complex, ad-hoc search needs (or security/SIEM requirements) often lean toward Elasticsearch.
Log fatigue happens when there is so much noisy, low-value logging that engineers stop trusting or reading logs at all, similar to alert fatigue with paging systems. Teams avoid it by being deliberate about what gets logged at INFO and above, regularly pruning stale debug statements, and reserving ERROR/WARN levels strictly for things that genuinely need attention rather than routine, expected conditions.
Key Takeaways
- A log is a timestamped, discrete record of a software event — one of the three pillars of observability alongside metrics and traces.
- Structured (JSON) logging with consistent field names is the modern standard, replacing free-text logs, because it enables fast, reliable machine querying.
- A production logging pipeline has many components: application, agent/shipper, message broker, processor, indexed storage, and query/visualization layer.
- Correlation IDs are essential in microservices to trace a single request across many services.
- Logging is a cost/value tradeoff — over-logging is expensive and noisy; under-logging leaves you blind during incidents.
- Security matters: never log secrets or unredacted PII; control access to log platforms.
- Logs feed directly into alerting, SLOs, and dashboards when combined with a solid observability platform.
- At extreme scale (Netflix, Uber, Google), logging infrastructure becomes its own serious engineering discipline, built on technologies like Kafka and Elasticsearch/Loki.
A log is a timestamped record of something a piece of software did, structured so machines can search it and humans can understand it — and modern logging is really the discipline of turning millions of those records per minute into signal without going bankrupt on storage.