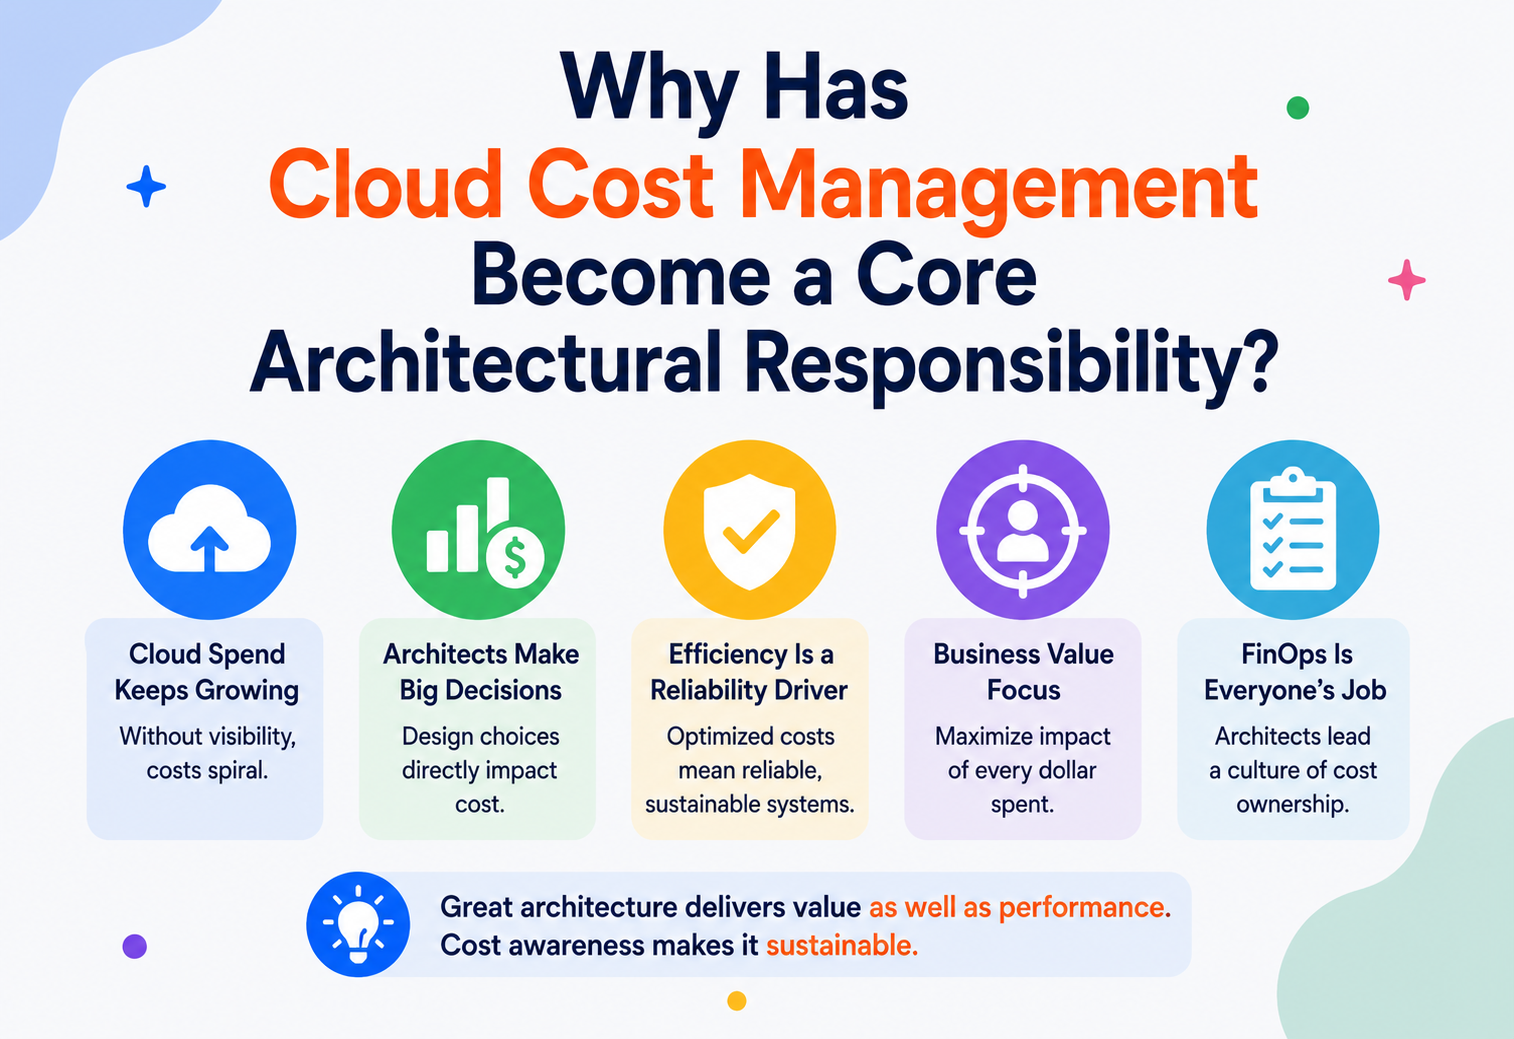
Why Has Cloud Cost Management Become A Core Architectural Responsibility?
A deep, beginner‑friendly guide to why the “cost line” moved from the finance department onto the architect’s whiteboard — and how to design systems that are fast, reliable, and affordable at the same time.
Introduction & History
Cost stopped being a fixed, one‑time purchase the moment computing became a metered utility. Understanding why architects now own the bill starts with the story of how the bill itself changed shape.
Imagine you rent a car. If you pay a flat monthly fee, you don’t think twice about driving an extra 20 miles to see a friend. But if you’re paying per mile, per minute, and per gigabyte of fuel injected — with the price changing depending on the time of day — you’d suddenly start planning your routes very carefully. That’s what happened to software engineering when computing moved from “buy a server and own it” to “rent computing power by the second.”
In the old world of on‑premises data centers, a company bought servers once every few years. An architect’s job was almost entirely about correctness, performance, and reliability — the bill was already paid, sunk into hardware sitting in a rack. Whether an application used 10% or 90% of that server’s capacity, the monthly cost to the business was basically the same.
Cloud computing broke that assumption completely. Amazon Web Services launched EC2 in 2006, followed by Google Cloud and Microsoft Azure. For the first time, computing became a utility — like electricity or water — billed by the hour, the second, the gigabyte, or the request. This was revolutionary for flexibility: a startup could rent a supercomputer for an afternoon and give it back. But it also meant that every architectural decision — how you store data, how you scale, how you design an API — now had a direct, continuous, and sometimes surprising effect on the monthly invoice.
2006 — The utility model arrives
AWS launches EC2. Compute becomes rentable by the hour instead of purchased outright.
2010s — Elastic everything
Auto‑scaling, serverless (Lambda, 2014), and managed databases let systems grow and shrink automatically — and so does their cost.
2012–2015 — Cost anarchy
Teams spin up resources freely with self‑service consoles. Bills spike unpredictably; nobody owns the number.
2016–2019 — Rise of FinOps
Cross‑functional teams of engineers, finance, and product form to bring accountability to cloud spend. The FinOps Foundation forms in 2019.
2020s — Cost becomes a design input
Cost is now treated the way we treat latency or availability: a non‑functional requirement designed for from day one, not fixed after the fact.
This history matters because it explains why cost management is no longer “something the finance team handles after the fact.” The people who make the technical decisions — which database to use, how to shard data, whether to use a queue or a synchronous call — are the same people whose decisions determine 90% of the bill. Finance can negotiate a discount, but only an architect can decide not to over‑provision in the first place.
It also helps to understand what changed at a mechanical level, not just a philosophical one. Before elastic computing, an engineer’s mental model was: “I have this box. I must make my software fit inside it.” The box was fixed, so the engineering conversation revolved almost entirely around correctness and speed. After elastic computing, the mental model flipped to: “I can have as many boxes as I want, of any size, for as long as I want them.” That sounds like unlimited freedom — and it is — but unlimited freedom without a corresponding sense of responsibility is exactly how bills spiral. It’s the digital equivalent of an all‑you‑can‑eat buffet with no plate size limit; the food is there for the taking, but someone still has to pay for what’s eaten versus what’s left to spoil.
The early 2010s in particular were a kind of “wild west” period for cloud spend. Self‑service consoles made it trivially easy for any engineer — often without any budget approval step at all — to spin up a database, a fleet of virtual machines, or a training job costing thousands of dollars an hour. This was liberating for speed of experimentation, and it is genuinely one of the reasons cloud computing enabled so much innovation so quickly. But it also meant that, for the first time in the history of enterprise computing, an individual engineer’s keyboard could directly and immediately create a large financial obligation without any of the traditional checks — purchase orders, procurement reviews, hardware lead times — that used to naturally throttle spending in the on‑premises era.
By the time FinOps emerged as a formal discipline in the late 2010s, the underlying lesson had already become clear across the industry: bolting cost controls onto a system after it’s built is far more expensive, both financially and organizationally, than designing for cost awareness from the outset. That lesson is the entire reason this topic now belongs on the architect’s whiteboard rather than solely in a monthly finance meeting.
The Problem & Motivation
Cloud bills are large, unpredictable, and driven by decisions made far away from the finance department — inside the codebase and the architecture diagrams.
Let’s define the problem in plain terms: cloud bills are large, unpredictable, and driven by decisions made far away from the finance department — inside the codebase and the architecture diagrams. A single line of code that logs too verbosely, or a database query missing an index, can quietly cost a company hundreds of thousands of dollars a year without ever throwing an error.
Why this catches teams off guard
Cloud pricing is not like a phone bill with three line items. AWS alone has tens of thousands of SKUs (billable units) across compute, storage, network, and managed services — each with its own pricing tiers, regions, and discount structures. No single person can hold all of it in their head, which is exactly why it must be designed for, not memorized.
Consider a few very ordinary architectural choices and their surprising financial consequences:
Chatty microservices
Splitting a monolith into 40 services that call each other synchronously can multiply network transfer costs and force you to over‑provision every hop for the slowest one.
Logging everything
Verbose debug logs shipped to a managed logging service are often billed per gigabyte ingested — “just in case” logging can become a top‑5 line item.
Always‑on dev environments
A staging environment identical to production, left running 24/7, can cost as much as production itself if nobody remembers to schedule it off at night.
Cross‑region chatter
Data transfer between regions or out to the internet is often the most expensive byte you’ll ever move — and it’s invisible until the bill arrives.
The motivation for treating cost as an architectural concern is simple: the earlier you catch a cost problem, the cheaper it is to fix. Just like a security flaw is far cheaper to fix in design review than in production, an inefficient data access pattern is far cheaper to redesign on a whiteboard than to refactor after it’s serving live traffic and the team’s muscle memory has built up around it.
There’s also a strategic motivation. In a fixed‑cost world, a company with better cost efficiency doesn’t win much of a competitive advantage — everyone pays roughly the same for hardware. In the cloud, cost efficiency directly funds product velocity: every dollar saved on idle infrastructure is a dollar that can hire an engineer, run more experiments, or extend a startup’s runway by another quarter.
There’s a second, subtler motivation that’s easy to miss: cost is one of the very few signals that touches literally every layer of a system at once. A latency metric tells you about one request path. An error rate tells you about one failure mode. But the monthly bill is a rollup of every architectural decision made across the entire system — every database query pattern, every retry policy, every log statement, every third‑party API call. In that sense, a sudden spike in cost is often the earliest, cheapest‑to‑notice symptom of a much deeper problem: a retry loop gone wrong, a cache that stopped working, a background job that’s now running far more often than intended. Teams that watch cost closely often catch these bugs days before a customer would ever notice anything wrong, simply because the bill moved before the user experience visibly degraded.
It’s also worth being honest about why this problem is genuinely hard, rather than just a matter of discipline. Pricing itself is enormously complex and constantly shifting: providers introduce new instance families, change discount structures, and offer time‑limited promotions. A cost optimization that was correct last quarter can quietly become wrong this quarter simply because the underlying price list changed — nobody touched the code at all. This is fundamentally different from a security vulnerability, which typically stays fixed once patched. Cost efficiency is not a one‑time destination; it’s closer to a garden that needs ongoing tending, because the ground itself keeps shifting beneath it.
Core Concepts & Terminology
Before going further, let’s build a shared vocabulary. Each term below is a small tool in a toolbox — you don’t need to master all of them at once, just know what each one is for.
FinOps
FinOps (short for “Financial Operations”) is a cultural practice — much like DevOps — where engineering, finance, and product teams share responsibility for cloud spending decisions in real time, rather than reviewing a bill once a quarter. Think of it as a shared dashboard in the cockpit of a plane: the pilot (engineering), the co‑pilot (finance), and the navigator (product) all see the same fuel gauge.
Unit Economics
This means measuring cost per unit of value instead of in absolute dollars — for example, “cost per 1,000 API requests” or “cost per active user” rather than just “total monthly bill.” A bill that doubles is scary; but if it doubled because your user base tripled, unit economics tell you that’s actually a win.
TCO (Total Cost of Ownership)
The full cost of a system over its life — not just the sticker price of a service, but engineering time to build it, operational time to run it, and the cost of the risk if it fails. A “free” open‑source tool can have a higher TCO than a paid managed service once you count the 2am pages.
Showback and Chargeback
Showback means showing each team what their part of the infrastructure costs, without actually billing them internally. Chargeback goes a step further and actually debits each team’s budget for their usage — like splitting a restaurant bill item by item instead of just showing everyone the total receipt.
Tagging / Cost Allocation
A tag is a label attached to a cloud resource (like team:payments or env:staging) that lets billing systems group costs by owner, project, or environment. Without tags, a bill is one enormous, unlabeled grocery receipt — you know the total, but not what any of it was for.
Reserved, Spot, and On‑Demand Pricing
- On‑Demand: pay full price, whenever you want, no commitment — like a taxi.
- Reserved / Committed Use: commit to using a resource for 1–3 years for a large discount — like an annual gym membership.
- Spot / Preemptible: use spare, unused capacity at a steep discount, but the provider can take it back with little notice — like standby airline tickets.
Elasticity vs Over‑Provisioning
Elasticity is a system’s ability to automatically grow and shrink with real demand. Over‑provisioning is when a team, worried about running out of capacity, simply requests far more than needed “to be safe” — like renting a 10‑bedroom house because you might, someday, host a big party.
Simple analogy
Think of cloud spend like a home electricity bill. Turning off lights in empty rooms (autoscaling), buying efficient appliances (right‑sizing), and choosing a better rate plan (reserved pricing) all help — but none of it works if nobody ever looks at the bill (observability) or knows which family member left the lights on (tagging).
Cost Efficiency vs Cost Cutting
These sound similar but are quite different, and confusing the two causes a lot of unnecessary pain on engineering teams. Cost cutting is a one‑time, often reactive act — shutting things down, freezing budgets, saying “no” more often. Cost efficiency is an ongoing design property — getting more useful work out of every dollar spent, ideally while growing, not shrinking. A healthy organization aims for the second and treats the first as an emergency measure, not a strategy.
Idle vs Waste
It’s worth distinguishing “idle” capacity from “waste.” Idle capacity that’s intentionally held in reserve for a traffic spike or failover event is a deliberate insurance cost. Waste is idle capacity nobody meant to pay for — an old test environment nobody remembered to delete, a database backup snapshot kept indefinitely with no retention policy. Good cost management isn’t about eliminating all idle capacity; it’s about making sure every dollar of idle capacity is a conscious choice, not an accident.
Architecture & Components Of A Cost-Aware System
A cost‑aware architecture is not one extra box on a diagram — it’s a set of concerns woven through every layer.
Let’s walk through each piece:
Billing export
Every cloud provider can export a detailed, line‑by‑line record of usage (e.g. AWS Cost and Usage Report). This is the raw material for everything else.
Cost data lake
Raw billing data — often millions of rows a day — is stored somewhere queryable, like a data warehouse, so it can be sliced by team, service, or time.
Tagging & allocation engine
Software that maps each dollar to an owner using tags, naming conventions, or account structure — turning a wall of numbers into “team X spent $Y on Z.”
Dashboards
Human‑readable views (often built on tools like Grafana, CloudHealth, or custom BI tools) so engineers can see spend the same way they see error rates.
Anomaly detection
Statistical or ML‑based systems that flag “this service’s cost jumped 300% overnight” before it becomes a shock at month’s end.
Guardrails
Automated policies — budget alerts, quotas, approval workflows — that prevent runaway spend the same way a rate limiter prevents runaway traffic.
Notice the feedback loop in the diagram: cost data flows all the way back into architecture decisions. This is the crucial shift — cost visibility isn’t a dashboard you glance at once a month, it’s an input into design the same way a load test result is.
It’s worth pausing on why the tagging and allocation engine sits at the center of this diagram rather than off to the side. In practice, this component is often the single hardest piece to get right, and also the piece that determines whether everything downstream is trustworthy. Think of it like the return address on a piece of mail: if it’s missing or wrong, the mail still arrives — the resource still runs, the workload still completes — but nobody can ever trace it back to figure out who sent it or why. A billing report with poor tagging coverage looks precise (it has exact dollar amounts, down to the cent) while actually being nearly useless for decision‑making, because “exact but unattributed” doesn’t tell anyone what to change.
Many organizations solve this not with willpower alone, but by making tagging structurally difficult to skip — for example, using infrastructure‑as‑code policies that reject a deployment outright if required tags (owner, environment, cost‑center) are missing, the same way a compiler refuses to build code with a syntax error. This turns “please remember to tag your resources” from a hopeful request into an enforced guarantee, which is usually the difference between a tagging coverage rate of 40% and one above 95%.
The anomaly detection component deserves equal attention. Naive threshold alerts (“tell me if spend exceeds $10,000 a day”) are simple to build but produce two kinds of failure: they miss slow, creeping waste that never crosses any single threshold, and they generate false alarms during genuinely good events, like a successful marketing campaign that legitimately drives more traffic and more cost. More sophisticated systems compare spend against a rolling baseline adjusted for known seasonality — much like a fitness tracker that learns your normal resting heart rate and only alerts you when today’s reading is unusual for you, not against some generic population average.
How It Works Internally
Let’s open the hood. When you run a virtual machine for one hour, how does that turn into a line on your invoice weeks later?
1. Metering
The cloud provider’s hypervisor and control plane record fine‑grained usage events — CPU‑seconds, bytes stored, bytes transferred, API calls made.
2. Rating
Each metered event is matched against a price list (which varies by region, instance type, commitment level, and sometimes negotiated enterprise discounts).
3. Aggregation
Rated events are rolled up per resource, per account, per day.
4. Export
The provider publishes a detailed report (e.g. hourly, per‑resource‑ID) that downstream systems can ingest.
5. Allocation
Internal tooling joins that report against tags and account/project structure to assign cost to a team or feature.
6. Presentation
Dashboards, alerts, and reports surface the result to humans in near‑real time (though bills are typically finalized with a lag of hours to a day).
It’s worth noting that these six steps happen continuously and largely independently of any human action — nobody manually “generates a bill” the way a waiter tallies a restaurant check. Instead, this pipeline runs constantly in the background across millions of customers simultaneously, which is precisely why it’s built as an automated data pipeline rather than a manual process. Understanding this pipeline matters for architects because it explains an easily‑missed truth: the cost of a resource is not determined at the moment you look at a price list, but at the moment metering actually happens. A virtual machine’s advertised hourly price can be modified by a dozen different multipliers behind the scenes — a committed‑use discount here, a volume discount there, a temporary promotional credit somewhere else — meaning two engineers running the identical workload in two different accounts can see meaningfully different final costs, even though the sticker price they both looked up was the same.
Here’s a small, illustrative Java example of how an internal cost‑allocation service might parse a billing export and roll it up by team tag — simplified, but representative of what many companies build in‑house on top of raw billing data:
public class CostAllocator {

    // Represents one line item from a cloud billing export
    record UsageRecord(String resourceId, String team, String service, double costUsd) {}

    public Map<String, Double> allocateCostByTeam(List<UsageRecord> records) {
        Map<String, Double> costByTeam = new HashMap<>();

        for (UsageRecord record : records) {
            // Fall back to "unallocated" when a resource is missing its team tag —
            // this is exactly the kind of gap that causes "mystery spend"
            String team = (record.team() == null || record.team().isBlank())
                    ? "unallocated"
                    : record.team();

            costByTeam.merge(team, record.costUsd(), Double::sum);
        }
        return costByTeam;
    }

    public void flagAnomalies(Map<String, Double> todayCost,
                              Map<String, Double> sevenDayAvgCost,
                              double thresholdPct) {
        for (var entry : todayCost.entrySet()) {
            double baseline = sevenDayAvgCost.getOrDefault(entry.getKey(), 0.0);
            if (baseline > 0 && entry.getValue() > baseline * (1 + thresholdPct)) {
                System.out.printf(
                    "ALERT: team '%s' spend $%.2f is %.0f%% above baseline $%.2f%n",
                    entry.getKey(), entry.getValue(),
                    ((entry.getValue() / baseline) - 1) * 100, baseline);
            }
        }
    }
}
Notice the “unallocated” fallback bucket — in almost every real company, this bucket is uncomfortably large at first. It grows every time someone spins up a resource without a tag, and shrinking it is usually one of the very first wins a cost‑aware team achieves.
Why lag matters
Because billing exports often lag by hours, real‑time guardrails (like hard resource quotas) matter more than dashboards for stopping a runaway cost event while it’s happening, not just reporting on it afterward.
Data Flow & Lifecycle
Let’s trace the entire lifecycle of a dollar of cloud spend, from the moment an engineer writes code to the moment a finance leader sees it on a report.
The important thing about this lifecycle is the feedback loop distance — the time between an engineer making a decision and that engineer learning what it cost. In an immature setup, this loop can take a month (waiting for the monthly invoice). In a mature, cost‑aware architecture, the loop can be same‑day or even real‑time, letting engineers course‑correct almost as fast as they’d fix a failing test.
| Maturity level | Feedback loop | Typical behavior |
|---|---|---|
| Reactive | Monthly invoice | Surprise, blame, one‑time cost cutting sprints |
| Aware | Weekly dashboard review | Trends spotted late, but before they compound |
| Proactive | Daily anomaly alerts | Issues caught within a day of introduction |
| Embedded | Pre‑deployment cost estimate | Cost is a code review criterion, like test coverage |
It’s useful to compare this to how the software industry already solved a very similar feedback‑loop problem for bugs. Decades ago, defects were often caught only when a customer complained — an extremely slow, expensive feedback loop. Automated testing, continuous integration, and code review compressed that loop from months down to minutes, and the entire discipline of software quality improved as a direct result of that compression. Cost management is going through the exact same maturation curve: the organizations seeing the best results are the ones actively working to shrink the time between “an engineer makes a decision” and “that engineer sees the financial consequence,” using exactly the same tools — automation, tight feedback, and visibility built into daily workflows — that already worked for quality and reliability.
Advantages, Disadvantages & Trade-offs
Treating cost as an architectural responsibility is powerful, but it isn’t free (no pun intended) — it comes with its own trade‑offs.
Advantages
- Prevents runaway bills before they happen, not after
- Improves margins directly, funding more product work
- Forces better design — cost‑aware systems are often simpler and faster too
- Builds a culture of ownership and accountability
- Makes scaling predictable for the business, not just for engineering
Disadvantages / Trade-offs
- Adds process overhead — tagging discipline, reviews, guardrails
- Over‑optimizing cost too early can slow down experimentation
- Aggressive cost‑cutting (e.g. too much spot usage) can hurt reliability
- Requires tooling investment that itself costs money and engineering time
- Risk of “penny wise, pound foolish” decisions if unit economics aren’t considered
The central trade‑off architects juggle constantly is the classic triangle: cost, performance, and reliability rarely improve all at once — usually you are trading one for another, deliberately and visibly, rather than by accident.
One trade‑off deserves special mention because it’s so easy to get backwards: the trade‑off between engineering time and infrastructure spend. It’s tempting to treat every dollar of cloud spend as pure waste to be eliminated, but engineering time is also a cost — often a far larger one per hour than the infrastructure itself. Spending two weeks of a senior engineer’s time to save $200 a month in compute costs is a bad trade; spending an afternoon to save that same $200 a month, repeated across two hundred similar services, is an excellent one. Mature cost management always weighs the cost of the optimization effort itself, not just the size of the potential saving, the same way a person wouldn’t drive across town to save two cents on a gallon of gas.
Performance & Scalability
Performance and cost are two sides of the same coin: most performance techniques are also cost techniques, because being fast usually means doing less wasted work — and wasted work is exactly what you’re billed for.
Right‑sizing
Right‑sizing means matching the size of a resource (a virtual machine, a database instance) to its actual, observed usage — not its worst‑case guess. Many teams provision for “3am on Black Friday” every single hour of the year, which is like keeping your car’s engine revved to highway speed while parked in the driveway.
Autoscaling
Autoscaling automatically adds and removes capacity based on real‑time demand signals (CPU load, queue depth, request rate). This is the single biggest lever for aligning cost with actual usage — but it must be tuned carefully; scaling too slowly hurts performance, scaling too eagerly hurts cost.
Caching & Batching
Caching avoids repeating expensive work; batching avoids paying the fixed “per‑request” overhead many times over. Both are performance techniques that directly cut cost, since many cloud services charge per operation, not just per byte.
High Availability & Reliability
Reliability costs money — redundant servers, multi‑region failover, and extra replicas all sit idle most of the time, “just in case.”
Reliability costs money — redundant servers, multi‑region failover, and extra replicas all sit idle most of the time, “just in case.” This is a legitimate and necessary cost, but it must be a deliberate investment sized to the actual business risk, not an unconscious default.
A common trap
Teams sometimes copy a “best practice” reference architecture (triple‑region, active‑active, five nines) for a system where a few minutes of downtime a month would barely be noticed by users. The extra reliability, and its cost, should match the actual cost of downtime — not a template.
A cost‑aware approach to reliability asks: “What does an hour of downtime actually cost this specific system, in lost revenue or trust?” and sizes redundancy to that number, the same way an insurance policy is sized to the value of what it protects.
Active‑active multi‑region
Highest reliability, highest cost — pays for full duplicate capacity at all times.
Active‑passive failover
Cheaper standby capacity, slightly slower recovery, but far less idle spend.
Backup & restore
Lowest ongoing cost, longest recovery time — fine for systems that can tolerate hours of downtime.
Spot instances are a great example of the cost/reliability trade‑off in miniature: they’re 60–90% cheaper, but can disappear with two minutes’ notice. Using them for stateless, retryable batch work is smart architecture; using them for your primary database is not.
Security & Cost
Security and cost interact in two directions — and, surprisingly, weak cost controls are themselves a security gap.
Security and cost interact in two directions. First, security tooling itself has a cost — encryption, logging for audit trails, dedicated security scanning, and compliance certifications all show up on the bill. Second, and less obviously, weak cost controls are themselves a security gap.
Cost as an attack surface
Leaked cloud credentials are commonly used by attackers to mine cryptocurrency on someone else’s account — turning a security incident directly into a cost incident, sometimes tens of thousands of dollars within hours. A tight budget alert can be one of the fastest ways to detect this kind of breach.
This is why mature organizations treat budget alerts and anomaly detection as part of their security posture, not just their finance process — an unexpected spike in GPU or compute usage overnight is a classic early signal of compromised credentials, well before any security scanner might notice.
There’s also a compliance dimension worth mentioning. Regulated industries — finance, healthcare, government contracting — often require detailed audit logs, encryption at rest and in transit, and long data retention windows. All of these carry real, recurring costs: audit logging services are frequently billed per gigabyte, and long retention windows on that logging can, surprisingly, become one of the largest recurring line items in a security‑conscious organization’s cloud bill. This isn’t a reason to skip the controls — it’s a reason architects need to size retention windows and logging verbosity deliberately, based on actual regulatory requirements, rather than defaulting to “log everything, forever, just in case,” which is expensive and often provides little additional protection beyond what’s actually required.
Least‑privilege access as a cost control
Tightly scoped IAM (Identity and Access Management) permissions are usually framed purely as a security best practice, but they double as a cost control. If an engineer’s credentials are scoped only to the specific resources they need, a leaked credential — or an honest mistake — can only do limited financial damage, the same way a hotel key card that only opens one room limits the damage if it’s lost, compared to a master key that opens the whole building.
Monitoring, Logging & Metrics
You cannot manage what you cannot measure — and cost observability follows the exact same principles engineers already use for uptime and latency.
Cost metrics
Spend per service, per team, per environment, per customer — tracked as a time series, just like request latency.
Unit cost metrics
Cost per request, per user, per transaction — the number that actually tells you if you’re becoming more or less efficient as you grow.
Alerts
Threshold and anomaly‑based alerts, mirroring the same on‑call practices used for error‑rate alerts.
Cost dashboards in code review
Some teams attach an estimated cost delta to pull requests that change infrastructure, the same way they attach test coverage.
Practical tip
Put a cost dashboard next to your latency and error‑rate dashboards on the same wall or the same on‑call runbook. When cost is visually adjacent to the metrics engineers already care about, it stops being “someone else’s problem.”
Deployment & Cloud Strategy
How and where you deploy has enormous cost implications, and this decision increasingly sits with architects rather than being a purely operational choice.
Single‑cloud vs Multi‑cloud
Multi‑cloud can improve negotiating leverage and avoid vendor lock‑in, but it also multiplies the complexity of cost tooling, since each provider bills differently — like trying to compare grocery receipts written in three different currencies and formats.
Regions and Availability Zones
Prices vary meaningfully by region — sometimes 20–30% for the identical resource — and cross‑region or cross‑AZ data transfer often carries its own charge. A globally‑distributed architecture must weigh latency benefits against these transfer costs deliberately.
Environments
Production, staging, and development environments are frequently over‑provisioned uniformly, when in reality only production needs peak‑capacity, high‑availability infrastructure. Scheduling non‑production environments to shut down outside working hours is one of the highest ROI, lowest‑effort savings available to most teams.
Hybrid Cloud and Repatriation
Some organizations, after years of pure cloud adoption, have started moving certain steady, predictable workloads back to owned or colocated hardware — a trend often called “repatriation.” This isn’t a rejection of the cloud; it’s a recognition that the cloud’s pay‑as‑you‑go pricing is most valuable for variable workloads, while very steady, predictable workloads can sometimes be run more cheaply on owned infrastructure, the same way it’s cheaper to own a car you drive every day than to rely on taxis for daily commuting, even though taxis are perfect for occasional trips. Recognizing which category a given workload falls into is itself an architectural cost decision.
Infrastructure as Code and Cost Estimation
Because most cloud infrastructure today is defined declaratively (via tools like Terraform or CloudFormation), it has become possible to estimate the cost impact of a proposed infrastructure change before it is ever deployed — much like a linter catches a bug before code ships. Integrating a cost estimation step into the same pull‑request workflow used for code review means an engineer can see “this change adds approximately $400/month” right next to the diff, turning cost from an invisible consequence into a visible, reviewable part of the change itself.
Databases, Caching & Load Balancing
These three components deserve special attention because they are consistently among the largest and least visible cost drivers in a system.
Databases
Managed databases are billed for compute, storage, I/O operations, and sometimes backup retention separately. A single missing index can force a query to scan an entire table, multiplying I/O cost while also slowing everything down — a rare case where fixing performance and fixing cost are the exact same fix.
Caching
A cache (like Redis or Memcached) trades a small, predictable cost for avoiding a much larger, more expensive database round‑trip. Caching is one of the purest examples of spending a little to save a lot — but an oversized, underused cache is itself waste, so cache sizing needs the same right‑sizing discipline as compute.
Load Balancing
Load balancers are often billed per hour and per gigabyte processed. Fan‑out architectures that route the same request through multiple load balancers (e.g., API gateway → internal gateway → service mesh) can quietly multiply this per‑byte charge several times over for a single user request.
// A simplified illustration of a query cost that changes dramatically with an index

// Without an index: full table scan, high I/O cost, slow response
String slowQuery = "SELECT * FROM orders WHERE customer_email = ?";

// With an index on customer_email: targeted lookup, low I/O cost, fast response
String fastQuery = "SELECT * FROM orders WHERE customer_email = ? -- backed by idx_customer_email";

// The SQL text is identical in spirit — the cost difference lives entirely
// in the schema design decision made ahead of time.
It’s worth calling out that these three components — databases, caches, and load balancers — tend to be where the biggest, most persistent costs hide, precisely because they’re considered “foundational” and therefore get set up once, early in a project, and rarely revisited. A compute fleet gets right‑sized regularly because everyone can see CPU utilization graphs easily. A database’s storage growth or query efficiency is much less visible day‑to‑day, so it silently accumulates cost the way clutter accumulates in a garage — nobody notices until it’s overflowing.
Storage tiers and retention
Most managed storage systems offer multiple tiers with dramatically different prices — “hot” storage for data accessed constantly, “cool” or “infrequent access” storage for data touched occasionally, and “archive” storage, sometimes 80–90% cheaper, for data that’s rarely if ever read again but must be retained for compliance. An architecture that automatically moves data through these tiers as it ages — similar to how a library might move a rarely‑borrowed book from the front shelf to a back‑room archive — can produce enormous savings with no impact on user experience, provided the access patterns are understood well enough to set the tiering rules correctly.
Connection pooling and load balancer sizing
Database connections and load balancer capacity are also frequently over‑provisioned defensively — allocating far more concurrent connections or throughput than any realistic traffic pattern requires. Connection pooling middleware, which reuses a small set of already‑open connections instead of opening a new one per request, both improves latency and reduces the size (and cost) of the database tier needed to serve the same traffic, again illustrating how performance and cost improvements are so often the very same change viewed from two different angles.
APIs & Microservices
Microservices offer real benefits — but every network hop has a price, in both latency and dollars.
Microservices architectures offer real benefits — independent deployment, isolated failure domains, team autonomy — but they also introduce a cost multiplier that’s easy to overlook: every network hop has a price, in both latency and dollars.
Each arrow above represents a network call that is metered, logged, and potentially billed for data transfer — and each service also needs its own baseline compute capacity kept warm and ready, even if traffic to it is thin. This is why some organizations deliberately merge overly‑fragmented services back together (“service consolidation”), not for simplicity alone, but because the cost of coordination between tiny services outweighed the architectural benefits.
Rule of thumb
Split services along real organizational and scaling boundaries — not just for the sake of it. A service boundary should pay for itself in independence and scalability, or it’s just added cost with no return.
API design choices carry their own quieter cost implications too. An API that returns far more data than a client actually needs — a common outcome of generic, one‑size‑fits‑all endpoints — forces every caller to pay for network transfer and serialization of bytes that are simply thrown away on the receiving end. Techniques like field selection, pagination, and purpose‑built endpoints for high‑traffic use cases exist partly for developer convenience, but they also directly reduce the volume of data moving through metered infrastructure. It’s a good example of how a decision made purely for “good API design” reasons often turns out to be a cost decision in disguise, discovered only once someone traces a data‑transfer line item back to its source.
Design Patterns & Anti‑patterns
A short catalogue of the shapes that consistently save money, and the shapes that consistently burn it.
Helpful patterns
Scale‑to‑zero
Serverless and container platforms that shut down entirely when idle, so you never pay for silence.
Tiered storage
Automatically moving old, rarely‑accessed data to cheaper “cold” storage tiers, like archiving old paperwork instead of keeping it on your desk.
Cost budgets as code
Defining spend limits declaratively alongside infrastructure‑as‑code, so budgets are reviewed in the same pull request as the infrastructure itself.
Graceful degradation
Designing systems to shed non‑critical, expensive features under load rather than over‑provisioning for worst‑case demand year‑round.
Common anti-patterns
Provisioning for peak, forever
Sizing every resource for the busiest hour of the year and never scaling back down.
Untagged sprawl
Resources created without ownership metadata, becoming permanent “mystery cost” nobody wants to touch.
Zombie resources
Snapshots, unattached storage volumes, and idle load balancers left behind after a project ends.
Cost as an afterthought
Reviewing spend only once a quarter, long after the architectural decisions that caused it are locked in.
A useful way to internalize the difference between a pattern and an anti‑pattern is to ask: “Was this decision made deliberately, with the trade‑off understood, or was it made by default, because nobody thought about it?” Provisioning generous headroom for a payments system that absolutely cannot fail during a holiday sales spike is a deliberate, well‑reasoned pattern. Provisioning the exact same generous headroom for an internal admin tool that three employees use twice a week is the anti‑pattern — not because extra capacity is inherently bad, but because it wasn’t a conscious choice weighed against its cost.
This is also why “cost optimization” as a one‑time project so often fails to stick. A team might spend a month aggressively right‑sizing everything, celebrate a 30% reduction in the bill, and then watch costs quietly creep back up over the following year as new features ship without the same scrutiny. The pattern that actually holds is treating cost review as a recurring, lightweight habit — much like a smoke detector needs a fresh battery every year, not just once when the house was built — rather than a single dramatic renovation.
Best Practices & Common Mistakes
A distilled, side‑by‑side view of what consistently works and what consistently doesn’t.
Best practices
- Tag every resource at creation time, enforced automatically
- Review cost dashboards on the same cadence as reliability metrics
- Set budget alerts before launch, not after a surprise bill
- Use unit economics, not raw totals, to judge efficiency over time
- Right‑size on a recurring schedule, not just once
- Make cost a criterion in architecture review, alongside security and scalability
Common mistakes
- Treating cost cutting as a one‑time “sprint” instead of an ongoing discipline
- Optimizing cost in isolation, breaking reliability or performance
- Letting only finance own the cost conversation
- Ignoring “small” recurring costs that compound over years (e.g., idle snapshots)
- Chasing the cheapest option without considering engineering time to maintain it
Perhaps the most important best practice, sitting underneath all of the specific tactics above, is cultural rather than technical: giving engineers permission to talk about cost openly, without it feeling like an accusation. In organizations where cost conversations only happen after something has gone wrong, engineers naturally start to associate the topic with blame, and that association makes people quietly avoid it — nobody wants to be the one who “caused” an expensive incident. Contrast that with organizations where cost dashboards are just another normal, ambient signal, discussed in the same neutral tone as latency graphs. In those environments, an engineer who notices a cost anomaly reports it the same way they’d report a slow endpoint — as a routine observation, not a confession. That cultural shift, more than any single dashboard or tool, is usually what determines whether cost‑aware architecture actually sticks for the long run or fades after the initial enthusiasm wears off.
Real‑World & Industry Examples
Four familiar organizations, four different angles on the same underlying discipline.
Netflix
Publicly discusses using a mix of reserved and spot capacity, along with sophisticated autoscaling, to run massive video encoding workloads cost‑efficiently while maintaining strict streaming reliability for paying customers.
Amazon (internal teams)
Long practiced “you build it, you run it, you pay for it” ownership, making cost visibility per team a foundational part of how services are staffed and reviewed.
Uber
Has written publicly about consolidating overly‑fragmented microservices and improving data infrastructure efficiency as usage scaled, treating architecture simplification as a cost lever, not just a maintainability one.
Popularized “site reliability engineering” practices that explicitly balance reliability targets (error budgets) against the cost of achieving ever‑higher availability, refusing to over‑invest past the point of diminishing returns.
The common thread across all of these organizations isn’t a specific tool — it’s that cost visibility was pushed as close as possible to the engineers making day‑to‑day decisions, rather than staying locked inside a finance spreadsheet.
It’s also worth noting a pattern shared across nearly every large‑scale public case study in this space: the improvements rarely came from a single silver‑bullet fix. Instead, they came from many small, compounding changes — a slightly better instance type here, a cache added there, a service boundary redrawn somewhere else — each individually modest, but collectively substantial when applied consistently across hundreds or thousands of services. This mirrors how compound interest works in personal finance: no single contribution feels dramatic, but consistency over time produces outsized results. The organizations that succeed at cost management long‑term are rarely the ones with the cleverest one‑time trick; they’re the ones that built the habits and tooling to keep finding these small improvements, quarter after quarter, without needing a crisis to prompt the search.
Frequently Asked Questions
The questions engineers, architects, and finance leaders ask most often about treating cloud cost as an architectural responsibility.
Q1: Isn’t cost management just finance’s job?
Finance can track and forecast spend, but only engineers control the architectural decisions — data models, scaling policies, service boundaries — that actually determine how much a system costs to run. Finance owns the budget; architecture owns the bill.
Q2: Won’t focusing on cost slow down innovation?
Not if it’s done well. Cost‑aware design usually overlaps heavily with good design generally — efficient systems tend to also be simpler, faster, and easier to reason about. The risk is optimizing prematurely or in isolation, not considering cost at all.
Q3: Do small companies need to worry about this, or just big ones?
Small companies arguably need it more — a runaway bill that’s a rounding error for a large enterprise can wipe out a startup’s runway. The habits are just easier to build early, before scale makes them harder to retrofit.
Q4: What’s the single highest‑leverage first step?
Enforced tagging plus a basic dashboard. You cannot optimize a cost you cannot attribute to anyone, so allocation always comes before optimization.
Q5: Does using serverless automatically make things cheaper?
Not automatically — serverless removes idle capacity waste, but its per‑invocation pricing can become more expensive than provisioned capacity at very high, steady traffic volumes. It’s a tool, not a guarantee.
Q6: How is this different from just “using a cheaper cloud provider”?
Switching providers can occasionally help, but it rarely solves the underlying issue, because the same architectural inefficiencies — over‑provisioning, missing indexes, chatty services — get carried over and simply billed at a different rate. Cost management is fundamentally about how efficiently a system uses whatever resources it has, not about which storefront you’re shopping at.
Q7: Who should actually own the cost number — engineering or finance?
In mature organizations, both, but for different parts of the problem. Finance typically owns forecasting, budgeting, and negotiating provider discounts. Engineering owns the architectural decisions that determine how much of that budget any given feature actually consumes. Neither can do the other’s job well, which is exactly why FinOps exists as a shared practice rather than a department that reports to either side alone.
Summary & Key Takeaways
Cost stopped being a downstream consequence of architecture and became one of its inputs, alongside latency, availability, and security.
Cloud computing turned infrastructure from a fixed, sunk cost into a continuous, decision‑driven expense — and that shifted the center of gravity for cost control from the finance department to the architecture table. Every choice about how data is stored, how services communicate, and how systems scale now has a direct financial consequence, visible almost in real time.
- Cost became architectural the moment infrastructure became metered and elastic, tying spend directly to design decisions, not procurement cycles.
- Visibility (tagging, dashboards, unit economics) has to come before optimization — you can’t fix what you can’t attribute.
- Cost, performance, and reliability form a triangle of trade‑offs; good architecture makes that trade‑off deliberate, not accidental.
- The highest‑leverage savings usually come from right‑sizing, autoscaling, and eliminating idle “zombie” resources — not just negotiating discounts.
- Treating cost like any other non‑functional requirement — reviewed in design, monitored in production, alerted on when it breaks — is what separates reactive bill‑shock from proactive engineering discipline.
If there’s one idea worth carrying away from all of this, it’s that cost stopped being a downstream consequence of architecture and became one of its inputs, alongside latency, availability, and security. None of those other non‑functional requirements are things a team addresses once and forgets — they’re continuously measured, continuously designed for, and continuously revisited as a system evolves. Cost now belongs firmly in that same category. The teams that internalize this earliest tend to build systems that are not only cheaper, but simpler and more resilient too, because the same clarity of thinking that keeps a bill under control — knowing exactly what each component does, why it exists, and what it costs to keep running — is the same clarity that makes a system easier to operate, debug, and trust.
Final thought
Cost is not a punishment for using the cloud. It’s a live, honest signal of every architectural decision a team is making right now — and, treated as such, it becomes one of the most useful design inputs an architect ever gets.