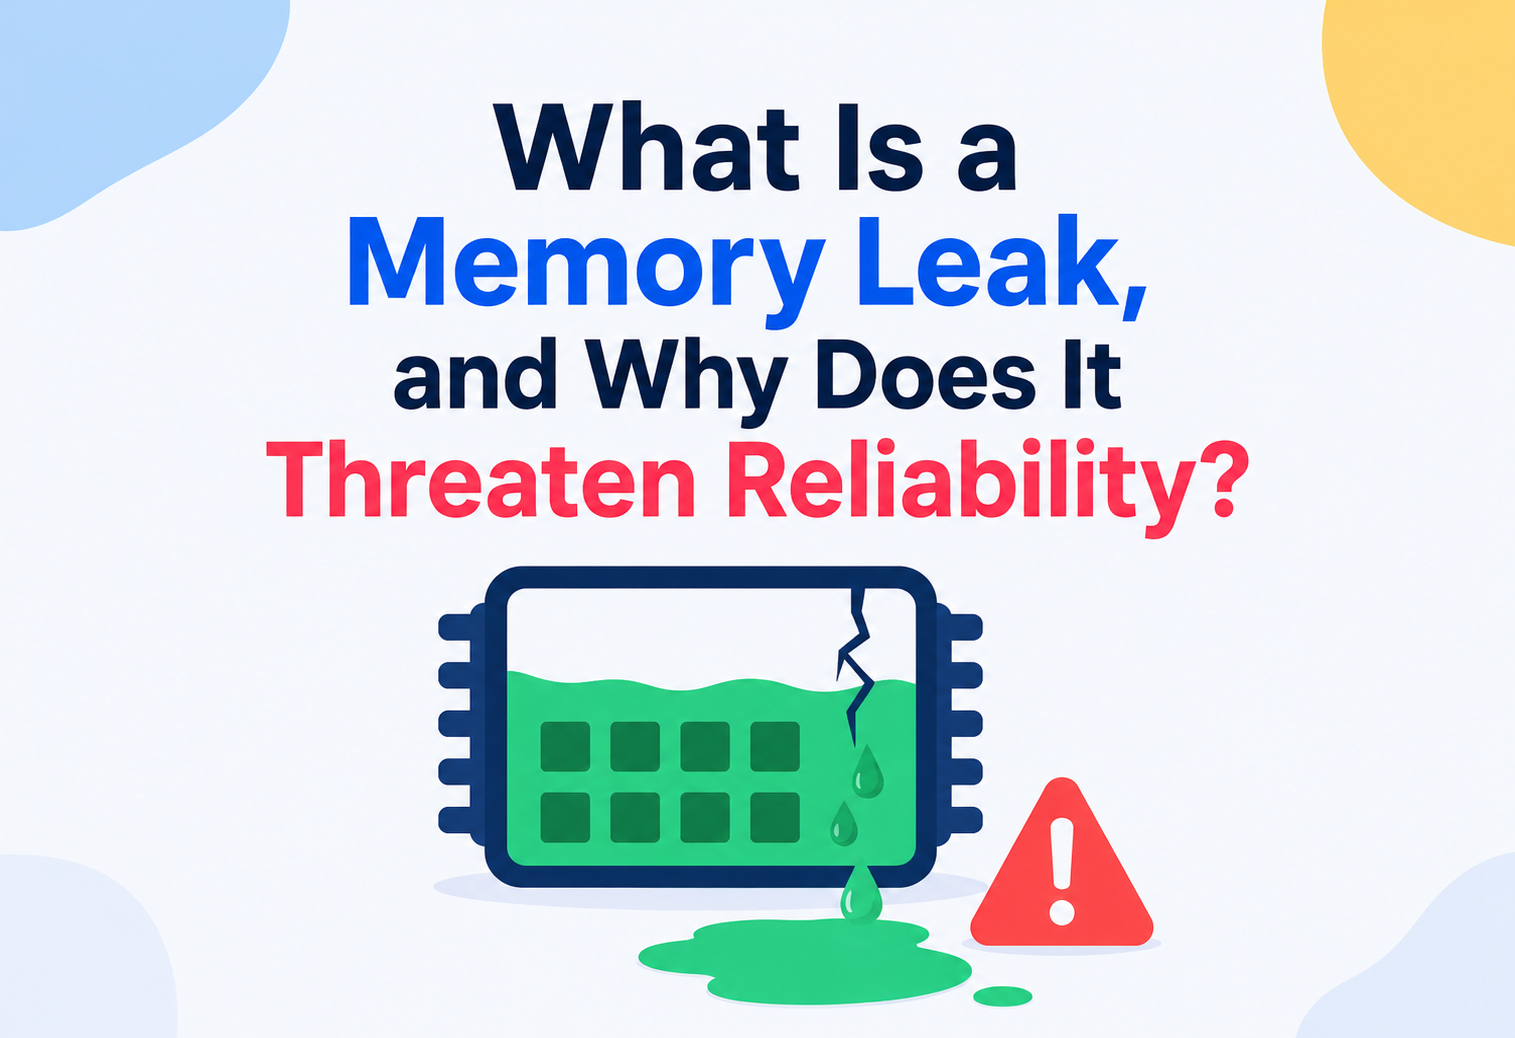
What Is a Memory Leak, and Why Does It Threaten Reliability?
A beginner-to-production guide to memory leaks — what they are, how they quietly build up inside running software, and why they are one of the sneakiest causes of crashes, slowdowns, and outages in real systems, from a single Android app to a streaming platform’s backend fleet.
Intro & History
Imagine you fill a bathtub, but the drain is slightly clogged. Water still goes in fine. But a little bit never leaves. Day after day, someone keeps adding a bit more water and never fully draining it. Eventually, the tub overflows and floods the house — even though nobody ever poured in more water than the tub could technically hold at any one moment.
A memory leak is the software version of that clogged drain. A running program keeps asking the computer for small pieces of memory to do its work, but never gives some of that memory back when it is done. Each leak by itself is often tiny — a few bytes, a few kilobytes. But over hours, days, or weeks of a program running non-stop (which is exactly how most real servers run), those tiny unreturned pieces pile up until the computer runs out of memory entirely.
The idea of a “leak” goes back to the earliest days of computing, when programmers manually managed every byte of memory themselves using languages like C. If you asked the computer for memory (using something like malloc) and forgot to give it back (using free), that memory was gone — leaked — until the program was restarted. As software moved to languages like Java, C#, Python, and JavaScript, an automatic helper called a garbage collector was introduced specifically to hunt down and reclaim memory that was no longer needed, so programmers would not have to do it by hand.
You might think that automatic garbage collection made memory leaks a solved problem. It did not. It just changed the disguise. Even with a garbage collector working tirelessly in the background, programs can still leak memory — not because the language forgot to clean up, but because the program itself is still holding a reference to something it should have let go of. That distinction is the heart of this entire article, and it is why memory leaks remain one of the most common causes of real-world reliability incidents today, even in modern, memory-managed languages like Java and Kotlin.

A memory leak happens when a program keeps memory alive that it will never use again, causing memory usage to grow over time until the system runs out and fails.
A Short History of the Idea
In the 1960s and 1970s, when computers had kilobytes of memory rather than gigabytes, every byte mattered enormously, and programmers tracked allocations almost by hand. As operating systems and languages like C and C++ matured in the 1970s and 1980s, memory management became an explicit contract: you asked for memory with malloc(), and you were personally responsible for returning it with free(). Forgetting was — and still is — called a leak, borrowing the plumbing metaphor because the symptom looks exactly like water slowly draining out of a system that should be sealed.
The 1990s brought a wave of managed, garbage-collected languages — Java in 1995, followed by C#, and later JavaScript engines maturing rapidly, Python, Ruby, and Go. These languages promised to end the era of manual memory bugs. They succeeded at ending one huge class of them: dangling pointers, double frees, and use-after-free bugs that plagued C and C++ programs for decades. But they could not, and cannot, end memory leaks, because a memory leak is fundamentally a logic bug about what the program chooses to remember, not a bookkeeping bug about how memory is physically allocated and freed.
This is why, more than two decades after Java’s release, memory leaks remain one of the top causes of production incidents in large-scale systems at cloud companies, even though every single one of those systems runs on a fully automatic garbage collector. Understanding this history helps explain why the fix for a leak is almost never “use a different language” — it is almost always “hold references more carefully.”
Problem & Motivation
Why should you, as a developer, care about this at all? Because memory leaks are one of the few bugs that are almost invisible during development and testing, yet devastating in production.
When you build a feature and test it on your laptop, you probably run the app for a few minutes, click around, and stop it. A slow, small leak will not show up in five minutes. It only becomes obvious after the application has been running continuously for hours, days, or weeks — which is precisely the situation every real backend server, mobile app, or long-running desktop application eventually finds itself in.
This creates a dangerous gap: the bug passes every test, passes code review, and gets deployed to production successfully. Then, quietly, memory usage starts climbing. Nobody notices at first because the app still works. Days later, the server starts slowing down. Eventually it crashes with an OutOfMemoryError, taking down real user traffic with it — often at the worst possible time, like during a big sale or a live event, when the system is under the most load and generating (and failing to release) the most memory.
Think of a restaurant kitchen where the staff keep pulling out clean plates for every new dish but never wash and put back the dirty ones. For the first hour, there are enough plates and nobody notices. By dinner rush, the kitchen has run out of plates entirely and cannot serve any more food — even though the kitchen has plenty of food, just no clean plates to put it on.
This is exactly why memory leaks are treated as a reliability problem, not just a performance nuisance. Reliability is about whether a system keeps working correctly over time, under real conditions. A memory leak is a slow-motion failure: the system does not break the moment the bug is introduced, it breaks later, unpredictably, often after the person who wrote the leaking code has moved on to other work.
Why Traditional Testing Misses Leaks
Most automated test suites are built around correctness: given this input, is the output right? A test for a login feature checks that a valid password logs the user in and an invalid one does not. It almost never checks “if I call this function one million times over three days, does memory usage stay flat?” That kind of test — a soak test or endurance test — requires deliberately running the application under sustained, realistic load for hours or days, which is expensive and slow, so many teams skip it or run it far too briefly to catch slow leaks.
This blind spot is made worse by a second factor: modern development environments are often more generous with memory than small production containers. A leak that takes three weeks to matter on a developer’s 32 GB laptop might take three hours to matter inside a 512 MB production container — the same bug, wildly different time-to-failure, purely because of the environment it runs in.
Being able to reason about, detect, and fix memory leaks is considered a senior-engineer skill precisely because it requires understanding what happens to a program over time and under load — not just whether a single request returns the right answer. It is one of the clearest signals of production readiness in a code review.
The remainder of this guide builds up exactly that skill, layer by layer: first the underlying mental model of how memory and garbage collection actually work, then how leaks form internally in real code, then how they show up operationally in monitoring, deployment, databases, and APIs, and finally the concrete patterns and habits that prevent them from reaching production in the first place.
Core Concepts
Before going further, it helps to separate two words that get used almost interchangeably in casual conversation but mean very different things in this context: “memory usage” and “memory leak.” Memory usage is simply how much RAM a program is using right now, at this exact moment — a healthy number for one program might be an alarming number for another, entirely depending on what that program is supposed to be doing. A memory leak is not about the number itself; it is about the trend of that number over time, specifically the portion of it that keeps growing even though the actual amount of work the program needs to do has not grown to match. Keeping this distinction sharp is the single most useful mental habit for reasoning about reliability problems in long-running software.
What “Memory” Means Here
Every running program needs a workspace to store the data it is working with — variables, objects, lists, strings, images, network buffers, and so on. This workspace comes from the computer’s RAM (Random Access Memory). RAM is fast, but it is also limited and shared among every program running on the machine.
In languages like Java, this workspace is split broadly into two areas:
- Stack — small, fast, automatically cleaned up storage used for method calls and local variables. Memory here is reclaimed the instant a method finishes, so leaks essentially never happen on the stack.
- Heap — the much larger area where objects (instances of classes, arrays, collections) live. This is where memory leaks happen, because objects on the heap only get cleaned up when nothing is using them anymore — and deciding “nothing is using them” is exactly where bugs creep in.
Reachability: The Concept Everything Depends On
A garbage collector does not ask “is this object old?” or “has this object been used recently?” It asks one simple question: can this object still be reached by following references, starting from something the program definitely still cares about (called a GC root)? If yes, the object is kept alive. If no path exists, the object is garbage, and its memory is reclaimed.
Reachability Graph
- GC Root (an active thread or a static field) → Object A: Cache
- Object A → Object B: Old User Session → Object D: Large byte array
- Object A → Object C: Another Old Session
- Object X — no path from any GC Root → will be collected on the next cycle.
In the diagram above, Object X has no path from any GC Root, so it will be collected. But Objects B, C, and D are still reachable through Object A — even if the program logically has no use for them anymore. This is the trap: the garbage collector is only asking “can I reach it?”, not “should the program still care about it?” A memory leak is when the answer to “can I reach it?” stays “yes” long after the honest answer to “should the program still care?” became “no.”

In garbage-collected languages, a memory leak is not memory the computer lost track of. It is memory the program is still, technically and correctly, holding onto — just uselessly.
How the Garbage Collector Actually Decides: Mark-and-Sweep
The most fundamental garbage collection algorithm, still at the heart of modern collectors, is called mark-and-sweep. It runs in two phases:
- Mark — starting from every GC Root, the collector walks every reference it can follow, marking each object it reaches as “alive.” This is a graph traversal, conceptually identical to a breadth-first or depth-first search you would use on any graph data structure.
- Sweep — the collector then scans the entire heap. Anything not marked “alive” is genuinely unreachable and its memory is reclaimed.
Modern JVM collectors (G1, ZGC, Shenandoah) are more sophisticated evolutions of this idea — generational (splitting the heap into young and old regions so short-lived objects are collected cheaply and often), and increasingly concurrent (doing most of the marking work while the application keeps running, to minimize pause times). But every single one of them still relies on the same reachability rule described above. No matter how advanced the algorithm, if your code keeps a reference alive, the object stays alive — the algorithm’s job is to correctly reclaim the unreachable, not to guess at what is logically unneeded.
Strong, Weak, Soft, and Phantom References
Java exposes a small hierarchy of reference types precisely to give programmers fine-grained control over this reachability rule:
| Reference type | Behavior | Typical use |
|---|---|---|
| Strong reference | Default. Object is never collected while reachable via this reference. | Normal variables and fields — most code, most of the time. |
| Soft reference | Collected only when the JVM is close to running out of memory. | Memory-sensitive caches that should shrink under pressure instead of causing an OutOfMemoryError. |
| Weak reference | Collected on the very next GC cycle if no strong references exist. | Listener/observer registries, canonical caches (e.g. WeakHashMap). |
| Phantom reference | Never lets you access the object; used purely to get notified after finalization/collection. | Advanced cleanup coordination, rarely used directly by application code. |
The Data Structures That Matter Most for Leak-Awareness
A handful of everyday data structures are disproportionately involved in real leak incidents, simply because they are the most common place developers store growing collections of state:
- HashMap / ConcurrentHashMap — the default go-to for any “keep track of things by ID” need, and therefore the most common home for an unbounded cache leak.
- ArrayList / LinkedList — used for append-only logs or history lists that are easy to forget to trim.
- LinkedHashMap with access order — the standard building block for a hand-rolled LRU (Least Recently Used) cache, since it can be configured to evict its eldest entry automatically once a size threshold is crossed.
// A minimal, bounded LRU cache using LinkedHashMap's built-in eviction hook
public class LruCache<K, V> extends LinkedHashMap<K, V> {
    private final int maxEntries;

    public LruCache(int maxEntries) {
        super(16, 0.75f, true); // true = order by access, not insertion
        this.maxEntries = maxEntries;
    }

    @Override
    protected boolean removeEldestEntry(Map.Entry<K, V> eldest) {
        // Returning true here tells the map to automatically evict
        // the least-recently-used entry once we exceed maxEntries.
        return size() > maxEntries;
    }
}
This fifteen-line class is a genuinely production-viable bounded cache for many use cases, and it illustrates a broader point: fixing or preventing most memory leaks is not about exotic technique, it is about choosing a data structure that has an eviction policy built in, rather than reaching for a plain, unbounded HashMap by default.
Architecture & Components
To understand where leaks come from, it helps to know the pieces involved in managing memory inside a typical Java Virtual Machine (JVM), since Java’s memory model is one of the most widely deployed in production systems.
| Component | What it does | Leak relevance |
|---|---|---|
| Heap | Stores all objects created with new. | Where almost all leaks physically live. |
| Young Generation | Holds newly created, short-lived objects. | Rarely a leak source; objects die fast here. |
| Old Generation (Tenured) | Holds objects that survived many collections. | Leaked objects accumulate here — a growing Old Gen is the classic leak fingerprint. |
| Metaspace | Stores class metadata. | Can leak if classes are dynamically loaded and never unloaded (e.g. classloader leaks). |
| Garbage Collector (GC) | Finds and reclaims unreachable objects. | Cannot fix a leak — it only reclaims what is truly unreachable. |
| GC Roots | Starting points for reachability (static fields, active threads, JNI references). | Anything hanging off a long-lived root risks leaking. |
JVM Heap at a Glance
- JVM Heap
- Young Generation — new, short-lived objects; frequent, cheap collections.
- Old Generation — objects that survived many young-gen collections; leaked objects quietly pile up here.
- Metaspace — class metadata, separate from the heap; grows when classes are loaded but never unloaded.
- Garbage Collector — scans both Young and Old generations to find and reclaim unreachable objects.
Notice the note on the Old Generation row: this is the single most useful fact for spotting leaks in practice. Healthy applications show a “sawtooth” memory pattern — memory rises as objects are created, then drops sharply when garbage collection runs, over and over. A leaking application shows the sawtooth teeth rising on a slowly climbing staircase — each collection reclaims less than the last, because more and more objects are truly unreachable-yet-referenced.
Comparing Modern JVM Collectors
Different garbage collectors make different trade-offs between throughput, pause time, and memory overhead, but none of them change the fundamental leak story — a leak still shows up as a rising Old Generation floor no matter which collector is running underneath.
| Collector | Design goal | Typical use case |
|---|---|---|
| Serial GC | Simplicity, low overhead, single-threaded. | Small applications, constrained environments. |
| Parallel GC | Maximum throughput, multi-threaded collection. | Batch processing, throughput-sensitive workloads. |
| G1 (Garbage-First) | Balanced throughput and pause time, region-based heap. | Default for most modern general-purpose server applications. |
| ZGC / Shenandoah | Ultra-low, near-constant pause times regardless of heap size. | Very large heaps, latency-critical services. |
An important practical point: switching to a fancier low-pause collector like ZGC can make a leaking application feel healthier for longer, because pauses stay short even as the heap fills — but this is deceptive. The underlying leak is still growing at exactly the same rate; the collector has simply gotten better at hiding its performance symptom until the moment memory truly runs out, at which point the crash arrives with less warning, not more.
Internal Working: How a Leak Actually Forms
Let’s walk through a concrete, minimal Java example of a leak forming, step by step.
import java.util.*;

public class SessionCache {
    // A static field lives as long as the class is loaded — essentially forever.
    private static final Map<String, UserSession> cache = new HashMap<>();

    public void onUserLogin(String userId, UserSession session) {
        // Every login adds an entry, but nothing ever removes one.
        cache.put(userId, session);
    }
}
Here is what happens internally, in order:
- The JVM starts. The static field
cacheis created and becomes a GC Root — it will exist as long as theSessionCacheclass is loaded, which is typically the entire lifetime of the application. - Every time a user logs in, a new
UserSessionobject is created and placed in the map, keyed by user ID. - Users log out, close their browser tabs, or their sessions time out logically — but nothing in this code ever calls
cache.remove(userId). - The garbage collector runs. It checks: is the
UserSessionobject reachable? Yes — it is inside the map, and the map is reachable from a static field, which is a GC Root. So the GC correctly leaves it alone. - This repeats for every login, forever. The map only ever grows. Memory usage in the Old Generation climbs steadily, collection after collection, day after day.
The garbage collector did nothing wrong. It behaved exactly as designed. The bug is entirely in the program’s logic: something was added to a long-lived structure and never removed once it was no longer needed.
The Fix, for Contrast
import java.util.concurrent.ConcurrentHashMap;
import java.util.concurrent.TimeUnit;
import java.util.Map;

public class SessionCache {
    // A time-based eviction cache instead of a plain, ever-growing map.
    private final Map<String, UserSession> cache =
        com.google.common.cache.CacheBuilder.newBuilder()
            .expireAfterAccess(30, TimeUnit.MINUTES) // auto-remove idle sessions
            .maximumSize(100_000)                    // hard upper bound
            .build()
            .asMap();

    public void onUserLogin(String userId, UserSession session) {
        cache.put(userId, session);
    }

    public void onUserLogout(String userId) {
        cache.remove(userId); // explicit cleanup on a known lifecycle event
    }
}
The fixed version bounds the cache’s growth two ways: an explicit removal on logout, and a safety-net expiry so that even sessions that never trigger a logout event (crashed browser, killed app) still get cleaned up automatically after being idle.
A Second Example: The Classic Android Listener Leak
Mobile development has its own famous version of this bug. An Activity (roughly, one screen of an app) registers itself as a listener with a long-lived singleton, but forgets to unregister when the screen closes:
public class MainActivity extends Activity {
    @Override
    protected void onCreate(Bundle savedInstanceState) {
        super.onCreate(savedInstanceState);
        // LocationManager is a long-lived, app-wide singleton
        LocationManager.getInstance().addListener(this::onLocationUpdate);
        // Missing: no corresponding removeListener() in onDestroy()
    }
}
Because LocationManager outlives any individual screen, and it now holds a reference to this Activity instance, the entire Activity — along with every view, bitmap, and object it references — cannot be garbage collected even after the user navigates away and the screen is destroyed. Rotate the screen a dozen times during testing, and a dozen “dead” activities pile up in memory, each one fully intact because of a single un-removed listener.
A Third Example: WeakHashMap Breaking the Chain Deliberately
import java.util.WeakHashMap;
import java.util.Map;

public class ListenerRegistry {
    // Keys are held weakly: once nothing else references a given key object,
    // its entry is automatically removed on the next GC cycle — no manual
    // cleanup code required.
    private final Map<Object, Runnable> listeners = new WeakHashMap<>();

    public void register(Object owner, Runnable callback) {
        listeners.put(owner, callback);
    }
}
This is the direct, structural fix to the Android example above: if the registry held its keys weakly, a destroyed Activity with no other strong references would simply vanish from the map on the next collection, with zero risk of the developer forgetting to call a manual “unregister” method.
Walking Through a Real Diagnosis, Step by Step
Suppose a team notices their order-processing service restarts every four days with an OutOfMemoryError. Here is a realistic diagnostic walkthrough:
- Confirm the trend. Graph JVM heap usage over the last two weeks. The floor after each GC cycle rises steadily rather than staying flat — confirmed leak, not a one-off spike.
- Capture a heap dump close to, but before, the point of crash, using
jmapor an automatic dump-on-OOM flag. - Open the dump in a heap analysis tool and sort by retained size (how much memory each object is responsible for keeping alive, including everything it references).
- Identify the dominant class. Suppose the tool shows 40,000 instances of
OrderEventListener, retaining 1.2 GB combined — far more than expected for a service handling a few thousand active orders at a time. - Trace the reference path from a sample
OrderEventListenerinstance back to its GC Root. The path shows: staticEventBus.listenersfield →List<OrderEventListener>→ the specific instance. - Read the relevant code. The order-processing module calls
eventBus.subscribe(listener)when an order is created, but the correspondingeventBus.unsubscribe(listener)call, meant to run when an order reaches a terminal state, was accidentally removed during a recent refactor. - Fix and verify. Restore the missing unsubscribe call, deploy to a canary instance, and confirm over the following days that the heap floor stays flat instead of climbing.
This walkthrough is a template that applies almost unchanged across languages and platforms: confirm the trend, capture a snapshot, find the dominant retained class, trace the reference path back to a root, and fix the specific missing cleanup step in the code that created that path.

Data Flow & Lifecycle of a Leaking Object
Every memory leak has the same shape at its core: an object’s logical usefulness ends, but its physical presence in memory does not, because some reference chain to a GC Root was never broken. The sequence below traces that gap for a single leaked session object.
Lifecycle of a Single Leaked Object
| Step | Actor | What Happens |
|---|---|---|
| 1 | Application code | Creates new UserSession() and hands it off to the cache. |
| 2 | JVM heap | Places the object in a static map — now reachable from a GC Root. |
| 3 | User | Logs out. Logical need for the object ends. |
| 4 | JVM heap | Object is still referenced by the map; no code has removed it. |
| 5 | Garbage collector | Scans for unreachable objects and finds this one is still reachable — skips it. |
| 6 | JVM heap | Memory usage keeps climbing across successive collections. |
| 7 | JVM heap → OS | Requests more RAM as the heap grows to accommodate more leaked objects. |
| 8 | Operating system | Eventually refuses; the JVM throws OutOfMemoryError and the process fails. |
This sequence is the entire story of almost every memory leak: the object’s logical lifecycle ends (the user logged out), but its physical lifecycle inside memory does not, because a reference chain to a GC Root was never broken. The gap between “logically done” and “still referenced” is where every leak lives.
To-do list app
A to-do list app keeps a global list of every to-do item ever created, even completed and deleted ones, because the “delete” button only hides them from the screen instead of removing them from the list.
Payment microservice
A payment microservice registers a listener on every incoming order event but never unregisters it when the order is closed, so listener objects — and everything they reference — accumulate for months until a restart.
Lifecycle Under Concurrency: Thread Pools
Thread pools add an extra wrinkle to object lifecycle. Threads in a pool (created with Executors.newFixedThreadPool(n), for example) are reused across many tasks rather than created and destroyed each time. Anything stored in a ThreadLocal variable rides along with the thread itself, not the task — so if a task sets thread-local data and does not clear it, that data outlives the task and silently becomes available to whatever unrelated task the pool assigns that thread to next. Over the pool’s lifetime (often the lifetime of the whole application), each thread can accumulate stale state from every task type it has ever handled, unless every code path is disciplined about clearing what it sets.
A ThreadLocal Leak in a Pool
- Task A sets a value on a
ThreadLocalwhile running on Pooled Thread #3. - Task A finishes but never clears the
ThreadLocal. Thread #3 returns to the pool holding stale data. - Task B is later scheduled onto Thread #3. It reads the stale value left behind by Task A.
- Result: incorrect behavior for Task B and a leaked reference to whatever object Task A stored.
ThreadLocal.remove() call can silently corrupt unrelated later tasks running on the same pooled thread.Advantages, Disadvantages & Trade-offs
It may sound strange to talk about “advantages” of a bug, but it is useful to compare memory management strategies and see where each one’s trade-offs create leak risk.
| Approach | Advantage | Leak Risk |
|---|---|---|
| Manual memory management (C/C++) | Full control, minimal overhead. | High — every allocation needs a matching, correctly-timed free. |
| Garbage collection (Java, C#, Go) | No manual frees; whole classes of bugs (double-free, use-after-free) eliminated. | Medium — leaks still happen via lingering references, but they are logical bugs, not memory-corruption bugs. |
| Reference counting (Python, Swift) | Deterministic, immediate cleanup when count hits zero. | Medium — reference cycles (A points to B, B points to A) can leak unless a cycle detector runs. |
| Ownership model (Rust) | Compiler enforces exactly one owner; leaks are rare. | Low — but not zero (e.g. deliberately leaking with Box::leak, or cycles via Rc). |
The trade-off worth internalizing: automatic memory management removes an entire category of bugs (accidentally freeing memory too early) but does not remove the category this article is about (forgetting to let go of memory once you are logically finished with it). No mainstream strategy fully eliminates leaks — they just change what kind of mistake causes one.
Reference Cycles: The Leak That Reference Counting Cannot See
It is worth understanding why reference-counted languages like Python and Swift are specifically vulnerable to cycles. Reference counting keeps a running count on every object: how many other things currently point to it. When the count hits zero, the object is freed immediately. This is simple and fast — but it breaks down when two objects reference each other:
# Python example of a reference cycle
class Node:
    def __init__(self):
        self.parent = None
        self.child = None

parent = Node()
child = Node()
parent.child = child
child.parent = parent   # cycle: parent -> child -> parent

del parent
del child
# Both objects' reference counts never reach zero, because they
# still reference each other, even though nothing external
# references either one anymore.
Python solves this with a supplementary cyclic garbage collector that runs periodically to specifically hunt for these cycles — essentially borrowing the same mark-and-sweep idea used by Java, layered on top of reference counting for the normal case. This hybrid approach is a good illustration that in practice, most languages combine multiple strategies rather than relying on one pure technique.
Choosing a Strategy: What It Means for You as a Developer
You rarely get to choose your language’s memory strategy on a given project — it is usually already decided by the platform (Java for a Spring Boot backend, Swift for an iOS app, JavaScript for a browser app). What you do control is how disciplined your code is about the patterns most likely to trigger a leak under that specific strategy: unbounded collections and inner-class references in Java, retain cycles in Swift and Objective-C, closures capturing large scopes in JavaScript, and manual allocation pairing in C/C++.
Performance & Scalability
A leak’s damage to performance builds up in a predictable, worsening sequence:
- Rising heap usage — the used portion of memory grows release after release of the garbage collector.
- More frequent GC cycles — as usable free space shrinks, the collector has to run more often to try to find room.
- Longer GC pauses — with more live (reachable, leaked) objects to scan through on every cycle, each collection takes longer. In many collectors, application threads must pause while this scanning happens.
- Rising latency — users and calling services experience slower and slower response times as GC pauses eat into request-handling time.
- Thrashing / OutOfMemoryError — eventually the JVM cannot find enough contiguous free memory even after a full collection, and the process either grinds to a near-halt or crashes outright.
The Leak Feedback Loop
Heap usage rises → GC runs more often → GC pauses get longer → request latency increases → timeouts and retries add more load → heap usage rises even faster (loop).
Notice the feedback loop at the bottom of the diagram: as latency rises, calling services often retry failed or slow requests, which adds even more load to an already-struggling instance — accelerating its collapse. This is exactly why memory leaks scale so badly under real traffic: the more successful and busy your application is, the faster the leak fills up and the sooner it fails.
Horizontal scaling (adding more servers) does not fix a leak — it just buys time, since each new instance leaks independently and will eventually hit the same wall. Leaks must be fixed in code, not “scaled around.”
Why GC Tuning Is Only a Band-Aid
When a service shows GC-related slowness, a common first response is to tune the garbage collector — switch from the default collector to G1 or ZGC, increase heap size, adjust generation ratios. These changes can genuinely help with normal, healthy memory pressure (lots of legitimate short-lived allocations under heavy traffic). But against a true leak, tuning only delays the inevitable: a larger heap means the eventual OutOfMemoryError takes longer to arrive, and a more efficient collector spends less time per cycle, but the underlying object count is still climbing without bound. Teams sometimes spend days tuning GC flags for a problem that a single missing cache.remove() call would have fixed outright.
Throughput vs. Pause Time Under Leak Pressure
Garbage collectors are generally tuned along a spectrum between maximizing throughput (least total time spent on GC) and minimizing pause time (shortest individual pauses, for latency-sensitive services). Under leak pressure, both metrics degrade together in an unusual way: throughput drops because the collector must repeatedly scan a growing set of live-but-useless objects, and pause times grow because more live objects means more work per collection cycle before the application can resume. This dual degradation, appearing on both throughput and latency dashboards simultaneously, is itself a useful diagnostic signal — a leak rarely affects only one of the two.
High Availability & Reliability
This is the section this article is really about: why a memory leak is treated as a top-tier reliability threat, not a minor inefficiency.
Why Leaks Are Uniquely Dangerous
- They are silent. Unlike a crash-on-startup bug, a leak passes every functional test. The application behaves correctly for hours or days before symptoms appear.
- They are time-bombed. The exact moment of failure depends on traffic volume, so it cannot be predicted from code review alone — it might fail in 2 hours under heavy load or 2 weeks under light load.
- They cause correlated failures. If every instance behind a load balancer was deployed at the same time and receives similar traffic, they tend to leak at a similar rate — meaning multiple instances can approach OutOfMemoryError around the same time, defeating the redundancy that high availability depends on.
- They degrade before they die. Long before the crash, rising GC pause times quietly increase latency and error rates, which can trip cascading failures in dependent services (timeouts, retry storms, circuit breakers opening).
A leak is less like a light bulb that suddenly burns out, and more like a slow gas leak in a house — nothing seems wrong at first, then people start feeling mildly unwell, and only much later does it become an emergency. By the time it is obvious, the damage has been building for a while.
How Teams Build Reliability Despite Leaks
| Technique | What it does |
|---|---|
| Rolling restarts | Periodically and automatically restart instances before memory climbs too high — a band-aid, not a fix, but limits blast radius. |
| Health checks + auto-healing | Orchestrators like Kubernetes detect an unresponsive/OOM instance and replace it automatically. |
| Memory limits + alerts | Alert well before the hard limit so engineers can investigate before an outage, not after. |
| Canary deployments | Roll new code to a small percentage of traffic first, so a new leak is caught on a few instances instead of the whole fleet. |
| Load shedding | Deliberately reject some requests when memory pressure is high, protecting the rest of the service instead of collapsing entirely. |
Failure Recovery: What Happens After the Crash
Understanding recovery behavior matters as much as understanding the failure itself. When a Java process dies from an OutOfMemoryError, in-flight requests are lost, any in-memory state not yet persisted is gone, and — depending on how the process was supervised — there may be a gap of several seconds before a new instance is ready to take traffic. In a well-designed system, this is where several reliability disciplines intersect: requests should be idempotent (safe to retry) so a client retry after a crash does not cause duplicate side effects like double-charging a payment; state that matters should be persisted to a database or durable queue rather than held only in memory; and health checks should be strict enough that a load balancer stops sending traffic to a struggling instance before it fully crashes, not just after.
The SLA Connection
Most production services are held to a Service Level Agreement (SLA) — a promised percentage of uptime, like 99.9%. A single memory leak, left unmonitored, can be the entire difference between meeting and missing that promise. At 99.9% uptime, a service is allowed roughly 8.75 hours of downtime per year — a single unnoticed leak causing a crash-and-recover cycle every few days can burn through that budget quickly, especially if each recovery takes several minutes across multiple affected instances.
Proactively Testing for Leaks With Chaos and Soak Engineering
Some organizations go further than passive monitoring and deliberately test for memory reliability before a release ever reaches real users. A soak test runs a representative workload continuously against a staging environment for an extended period — often 24 to 72 hours — specifically to surface slow leaks that a five-minute smoke test would never catch. Chaos engineering practices sometimes extend this further by deliberately injecting memory pressure (allocating large dummy objects) into a running staging instance to verify that alerting, auto-healing, and load-shedding mechanisms actually behave as designed when memory genuinely runs low, rather than assuming they will and finding out otherwise during a real incident.
Security
Memory leaks intersect with security in two important ways, and both are frequently overlooked because memory management is usually treated as a purely operational concern rather than a security one. Security reviews tend to focus on input validation, authentication, and encryption, while memory lifecycle bugs quietly slip through as “just a performance issue” — even though, as the two subsections below show, they can directly enable service disruption and data exposure.
1. Denial of Service (DoS)
If an attacker can find an input that triggers a leak faster than normal (for example, an endpoint that adds an entry to an unbounded cache per request, keyed by user-controlled input), they can deliberately flood that endpoint to exhaust server memory and crash the service for everyone — a memory-exhaustion Denial of Service attack, without needing to breach any authentication.
Any cache, map, or list keyed directly by unvalidated user input (IP address, session token, uploaded filename) is a potential DoS lever if it has no size limit or expiry.
2. Sensitive Data Lingering in Memory
Leaked objects do not just waste space — if those objects contain sensitive data (passwords in memory before hashing, authentication tokens, personal information, decrypted payloads), that data stays alive in the heap far longer than intended. This increases the window during which a memory dump, crash report, or debugging tool could expose it. Proper lifecycle management (clearing sensitive byte arrays, using short-lived scoped objects) reduces this exposure window.
3. Heap Dumps as an Accidental Data Leak
Ironically, the very tool used to diagnose a memory leak — a heap dump — is itself a security-sensitive artifact. A heap dump is effectively a complete snapshot of everything in memory at that moment, which can include unencrypted passwords, session tokens, and personal data that were only ever meant to exist transiently. Teams debugging a leak in production must handle heap dump files with the same care as a database backup: encrypted storage, restricted access, and deletion once the investigation is complete. A well-known category of security incident is a heap dump file left in an unsecured location (a public cloud storage bucket, an unprotected debug endpoint) after being generated for troubleshooting and then forgotten.
Never enable verbose heap-dump-on-error settings in a production environment without also securing where those dump files land — the fix for a leak should not create a bigger security problem than the leak itself.
Monitoring, Logging & Metrics
You cannot fix what you cannot see. Detecting a leak before it causes an outage is a monitoring discipline, not a guessing game.
What to Watch
- Heap usage over time — the single most telling graph. Look for a rising floor between GC cycles, not just rising peaks.
- GC pause frequency and duration — climbing pause times are an early warning, often visible before memory alerts fire.
- Old Generation occupancy — a steadily climbing Old Gen after full GCs is the clearest leak fingerprint in Java.
- Object counts by class — tools that show “how many instances of class X exist” reveal exactly what is accumulating.
Tools of the Trade
| Tool | Purpose |
|---|---|
| JVM heap dump + Eclipse MAT / VisualVM | Snapshot all live objects and their reference chains to find what is holding memory. |
| Prometheus + Grafana | Continuous heap/GC metrics graphed over time in production. |
| Java Flight Recorder (JFR) | Low-overhead, always-on profiling built into the JVM. |
| Chrome DevTools Memory tab | Equivalent tooling for leaks in JavaScript/browser applications. |
// Enabling a heap dump automatically on OutOfMemoryError (JVM flag)
-XX:+HeapDumpOnOutOfMemoryError
-XX:HeapDumpPath=/var/log/app/heapdump.hprof
Capture two heap dumps hours apart under similar load, then diff them (most heap analysis tools support this directly). Whatever object type grew the most between the two snapshots is almost always your leak source.
Reading a “Dominator Tree”
Heap analysis tools like Eclipse MAT organize a heap dump into a dominator tree, which answers a very specific and useful question: if I removed this one object, how much other memory would become unreachable along with it? An object that “dominates” a large amount of memory is a high-value target for investigation, because fixing the one reference holding it alive frees not just that object but everything hanging off it — often the difference between a 50 MB fix and a 5 KB fix that misses the real problem entirely.
A Minimal Command-Line Workflow
# 1. Find the process ID of the running JVM
jps -l

# 2. Take a heap dump without stopping the process
jmap -dump:live,format=b,file=heap1.hprof <pid>

# ... wait a few hours under normal traffic ...

jmap -dump:live,format=b,file=heap2.hprof <pid>

# 3. Open both files in Eclipse MAT and use the
#    "Compare Basket" feature to see which classes
#    grew the most between the two snapshots
Beyond ad hoc dumps, mature teams wire heap and GC metrics directly into their standard observability stack (Prometheus scraping JMX metrics, visualized in Grafana), with alerts configured on the trend of Old Generation occupancy over a rolling window — not just a static threshold — since a trend catches a slow leak long before it crosses any fixed danger line.
Designing a Good Memory Alert
A poorly designed alert either fires constantly on harmless, temporary spikes (alert fatigue, eventually ignored) or never fires until the crash has already happened (too late to act). A well-designed memory alert usually combines two conditions rather than one:
| Condition | Why it is included |
|---|---|
| Absolute threshold (e.g. heap > 80% of max) | Ensures the alert only fires when there is genuinely limited headroom left, not on every minor fluctuation. |
| Sustained trend (e.g. rising for 3+ consecutive GC cycles) | Filters out normal, temporary load spikes that a healthy sawtooth pattern absorbs on its own. |
| Restart frequency (e.g. more than one OOM-triggered restart per day) | Catches leaks that are severe enough to already be causing crash-and-recover cycles, even if nobody is watching the heap graph. |
Combining an absolute threshold with a trend condition means the alert stays quiet through ordinary traffic spikes and Black-Friday-style peak load, but still fires early and reliably when a genuine leak is underway — giving engineers time to investigate during business hours rather than being paged by a crash at 3 a.m.
Deployment & Cloud
In containerized and cloud environments, memory leaks have consequences beyond a single crashing process.
- OOMKilled containers — in Kubernetes, a container that exceeds its memory limit is killed by the kernel’s OOM killer, visible as the infamous
OOMKilledstatus, and restarted by the orchestrator — masking the leak behind seemingly “self-healing” restarts while the underlying bug remains. - Wasted cloud spend — teams often respond to leak symptoms by simply provisioning larger, more expensive instances rather than fixing the leak, quietly inflating cloud bills over time.
- Autoscaling confusion — memory-based autoscaling can misfire, scaling out (adding more instances) to “fix” what is actually a code bug, adding cost without addressing root cause.
The OOMKilled Restart Loop
Container memory leak → hits Kubernetes memory limit → kernel OOM killer terminates the container → Kubernetes restarts it → leak resumes from zero → loop.
This restart loop can persist for months, appearing in dashboards as “occasional restarts” rather than being correctly flagged as a memory leak, especially if the interval between restarts is long enough that nobody connects the dots.
Setting Memory Limits Correctly
A subtle but critical detail in containerized Java deployments: the JVM’s own heap sizing must be set with the container’s memory limit in mind, not the host machine’s total memory. Modern JVMs (Java 10+) are container-aware by default and size their heap as a fraction of the container’s cgroup limit, but older configurations or explicit flags can override this and cause the JVM to think it has far more memory available than the container will actually allow — guaranteeing an early, confusing OOMKill that looks unrelated to any leak at all.
# Kubernetes container resource definition
resources:
  requests:
    memory: "512Mi"
  limits:
    memory: "768Mi"   # Hard ceiling — exceeding this triggers OOMKilled

# JVM flag to explicitly respect the container's cgroup limit
-XX:+UseContainerSupport
-XX:MaxRAMPercentage=75.0   # Use at most 75% of the container's limit for heap
Leaving headroom between the JVM’s heap limit and the container’s hard memory limit (as shown above) is essential, because the JVM process also consumes memory outside the heap — thread stacks, Metaspace, JIT-compiled code, and native buffers — all of which count against the container’s limit even though they are invisible to a heap-only view of memory.
Cost Visibility
Cloud cost dashboards rarely say “this line item is a memory leak.” They say “instance type upgraded from 2 GB to 4 GB” or “autoscaling group average instance count increased.” Connecting a rising cloud bill back to a specific leaking service usually requires correlating cost trend data with the same heap and restart metrics discussed above — a habit worth building into regular cost-review meetings, not just incident postmortems.
Blue-Green and Rolling Deployments as Accidental Leak Resets
Modern deployment strategies like blue-green deployments and rolling updates replace running instances with fresh ones every time new code ships. In services that deploy multiple times a day, this side effect can accidentally mask a slow leak entirely — the leaking instance never lives long enough between deployments to accumulate a dangerous amount of memory. This is a genuine reason why some leaks go undetected for a long time in fast-moving teams, and it resurfaces painfully during any quiet period (a holiday freeze, a low-deploy-frequency stretch) when instances suddenly live far longer than usual and the leak finally has enough time to matter.
Databases, Caching & Load Balancing
Not every leak is about ordinary objects sitting in a heap. Some of the most damaging production leaks involve database connections, cache entries, sticky sessions, and driver-internal caches — each a separate resource with its own lifecycle rules that must be respected.
Connection Leaks
A very common production leak is not about plain objects at all — it is about database connections. Each connection from a pool (like HikariCP) consumes real memory and a limited server-side resource. If code borrows a connection and forgets to return it (especially on an exception path), the pool slowly empties.
// LEAKS a connection if an exception occurs before close()
Connection conn = dataSource.getConnection();
Statement stmt = conn.createStatement();
stmt.executeUpdate("UPDATE orders SET status = 'PAID' WHERE id = ?");
conn.close(); // never reached if executeUpdate() throws

// FIXED: try-with-resources guarantees close() runs even on exception
try (Connection conn = dataSource.getConnection();
     Statement stmt = conn.createStatement()) {
    stmt.executeUpdate("UPDATE orders SET status = 'PAID' WHERE id = ?");
} // conn and stmt are automatically closed here, always
Cache Leaks
Caches are, ironically, one of the most common leak sources, because their entire purpose is to hold onto data — the risk is holding onto it forever instead of for a bounded time or size. Every cache in production should have either a maximum size, an expiry policy, or ideally both.
Load Balancer & Sticky Sessions
Systems that use sticky sessions (routing a user’s requests to the same server based on session data held in server memory) multiply leak impact: if that server leaks and crashes, all users pinned to it lose their session state simultaneously, unlike stateless load balancing where any healthy instance can pick up the request.
Prepared Statement Caches
A less obvious database-adjacent leak comes from prepared statement caches maintained by JDBC drivers or ORMs. Each unique SQL statement shape is cached to avoid re-parsing it every time. If application code generates SQL dynamically with slightly different text each time — for example, embedding values directly into the query string instead of using bind parameters — the driver can end up caching thousands of “unique” statements that are never reused, slowly growing this cache without bound. This is also a strong argument for always using parameterized queries: it improves both security (preventing SQL injection) and memory behavior (keeping the prepared statement cache small and genuinely reusable) at the same time.
Result Set and Cursor Leaks
Similarly, database result sets and cursors that stream large query results must be explicitly closed once consumed, especially when a query is abandoned partway through (for example, a client that disconnects before reading all rows). An unclosed cursor can hold server-side and client-side buffers alive indefinitely, and at scale — many concurrent users, many abandoned queries — this becomes indistinguishable from a classic in-process object leak, just with database-side resource exhaustion (running out of available cursors) as the failure mode instead of a JVM OutOfMemoryError.
APIs & Microservices
Long-running services — the norm in microservice architectures — are exactly where leaks accumulate the most, because unlike short scripts that exit and release all memory back to the OS, a microservice instance might run continuously for weeks between deployments.
Common Leak Sources at the API Layer
- Unclosed HTTP client connections — forgetting to close response bodies or connection pools in HTTP clients like Apache HttpClient or OkHttp.
- Event listeners never removed — subscribing to a message queue or event bus on every request without ever unsubscribing.
- Thread-local variables — especially dangerous in thread-pool-based servers, since threads are reused indefinitely and thread-local data can silently persist across requests if not cleared.
- Unbounded request logging/metrics buffers — collecting per-request diagnostic data into an in-memory list “for later” that never gets flushed or capped.
// Thread-local leak risk in a pooled-thread server (e.g. Tomcat)
private static final ThreadLocal<RequestContext> context = new ThreadLocal<>();

public void handleRequest(RequestContext ctx) {
    context.set(ctx);
    // ... process request ...
    // MISSING: context.remove();
    // The thread returns to the pool still holding this RequestContext,
    // which stays alive until this same thread handles another request
    // that happens to overwrite it — an unpredictable, hard-to-trace leak.
}
The fix is a single, easily forgotten line: context.remove() in a finally block, guaranteeing cleanup regardless of how the request handling exits.
Streaming APIs and Long-Lived Connections
Server-Sent Events, WebSockets, and gRPC streaming connections keep a connection — and typically a per-connection buffer or state object — open far longer than a normal request-response HTTP call. A service handling thousands of concurrent long-lived streams must be especially disciplined about cleaning up per-connection state the moment a client disconnects, since these connections do not naturally “end” the way a short HTTP request does; the server has to detect disconnection explicitly (via a closed-connection callback or a heartbeat timeout) and release associated memory at that point, rather than assuming the request lifecycle will do it automatically.
API Gateways and Request/Response Logging
API gateways sitting in front of a microservice fleet often log full request and response bodies for debugging and auditing. If this logging pipeline buffers data in memory before writing it out (for batching efficiency) and the write-out step falls behind under high traffic — due to a slow downstream logging backend, for instance — the in-memory buffer can grow without bound, turning a logging feature into an accidental memory leak under exactly the high-traffic conditions when the gateway can least afford it.
Why Microservices Change the Leak Calculus
Splitting a monolith into many small services does not reduce the total risk of memory leaks — it distributes it. Instead of one large application with one heap to monitor, a microservice architecture might have dozens or hundreds of independently deployed services, each with its own heap, its own GC behavior, and its own potential leak sources. This raises the operational bar: monitoring, alerting, and diagnostic tooling need to scale across the whole fleet, not just one process, and a leak in a rarely-deployed, low-traffic internal service can go unnoticed for far longer simply because fewer engineering eyes are on its dashboards day to day. Standardizing on shared libraries for common patterns — a single, well-reviewed caching library, a single HTTP client configuration — used consistently across every service is one of the most effective ways large organizations reduce this distributed leak surface.
Design Patterns & Anti-patterns
Some structural patterns quietly invite leaks; others build cleanup directly into their shape. Being able to spot the difference in a code review is one of the highest-leverage habits an engineer can develop.
| Anti-pattern | Why it leaks | Better pattern |
|---|---|---|
| Unbounded static collection | Static fields are GC Roots; anything added is kept forever by default. | Bounded cache with eviction (size and/or time-based). |
| Listener/observer never unregistered | The subject holds a reference to every listener, keeping them (and everything they reference) alive. | Weak references for listeners, or explicit unregister on lifecycle end (e.g. Android’s onDestroy). |
| Inner class holding outer class reference | Non-static inner/anonymous classes in Java implicitly hold a reference to their enclosing instance. | Use static nested classes, and pass only what is needed explicitly. |
| Classloader leak | Dynamically loaded classes/frameworks not unloaded on app redeploy, common in old app servers. | Ensure frameworks clean up thread-locals and static references on shutdown hooks. |
| Long-lived cache with no bound | Grows forever as new keys appear. | WeakHashMap, LRU cache, or a library like Caffeine/Guava Cache with maximumSize/expireAfterAccess. |
A WeakReference tells the garbage collector “you may reclaim this object if nothing else strongly references it, even if I’m still holding onto it.” It is the standard tool for caches and listener registries where you want automatic cleanup without manual bookkeeping.
The Observer Pattern, Done Safely
The Observer design pattern — where a subject notifies a list of registered observers when something changes — is one of the most common sources of listener leaks precisely because it is so widely used. A safe implementation makes unregistration a required, structural part of the observer’s own lifecycle rather than an optional courtesy:
public class Subject {
    private final List<WeakReference<Observer>> observers = new ArrayList<>();

    public void addObserver(Observer o) {
        observers.add(new WeakReference<>(o));
    }

    public void notifyAll(Event e) {
        Iterator<WeakReference<Observer>> it = observers.iterator();
        while (it.hasNext()) {
            Observer o = it.next().get();
            if (o == null) {
                it.remove(); // observer was already garbage collected — clean up the stale entry
            } else {
                o.onEvent(e);
            }
        }
    }
}
This pattern trades a small amount of extra complexity (wrapping each observer in a WeakReference and periodically pruning dead entries) for a strong structural guarantee: forgetting to call removeObserver() becomes a performance quirk rather than a hard memory leak, because the garbage collector will eventually reclaim the observer regardless.
The Builder and Object Pool Patterns
Object pooling — reusing a fixed set of expensive-to-create objects (like database connections or thread-pool threads) instead of creating new ones each time — is itself a deliberate, controlled form of “holding memory alive,” and it is a good pattern precisely because the pool has an explicit, bounded size and a clear return contract. The anti-pattern version of pooling is an unbounded pool with no maximum size and no clear rule for when objects are returned, which behaves exactly like the unbounded-cache anti-pattern discussed earlier — the intent is good, but the missing bound turns it into a leak.
Best Practices & Common Mistakes
Most leaks in production would have been prevented by a handful of small, boring habits applied consistently. The lists below capture what to do — and what to stop doing — long before an incident forces the lesson.

Best Practices
- Always pair “start” and “stop” lifecycle calls (open/close, register/unregister, acquire/release) using
try-with-resourcesorfinallyblocks. - Give every cache a maximum size and/or expiry — never let a map grow without bound.
- Prefer static nested classes over non-static inner classes when the inner class outlives a short scope.
- Clear thread-locals in a
finallyblock, especially in pooled-thread environments. - Load test with realistic, sustained duration (hours, not minutes) before shipping long-running services.
- Set memory alerts well below hard limits so there is time to investigate before a crash.
- Favor existing, well-tested caching libraries (Caffeine, Guava) over hand-rolled caching logic, since eviction edge cases are easy to get subtly wrong.
- Review any new static field or singleton collection with the specific question: “what removes entries from this, and when?” during code review.
- Treat every listener/observer registration as incomplete until the matching unregistration call exists in the same code review.
Common Mistakes
- Assuming “it is garbage collected, so it is fine” — forgetting that reachability, not usefulness, is what the GC checks.
- Testing only in short-lived local runs where slow leaks never have time to show up.
- Adding a cache “temporarily” for a quick fix without a bound, and never revisiting it.
- Treating repeated container restarts as normal infrastructure noise instead of investigating the underlying memory trend.
- Fixing symptoms (bigger instances, more frequent restarts) instead of the root cause in code.
A Pre-Production Checklist
Before shipping a new long-running service or a significant change to caching/listener logic, it is worth explicitly running through a short checklist rather than relying on memory alone:
| Check | Question to ask |
|---|---|
| Bounded growth | Does every collection that can grow with user activity have a maximum size or expiry? |
| Paired lifecycle calls | Does every open/register/acquire have a matching close/unregister/release, guaranteed via try-with-resources or finally? |
| Soak test | Has this code path been run continuously under realistic load for at least several hours, with heap graphed over that period? |
| Container limits | Is the JVM heap sized appropriately below the container’s hard memory limit, leaving room for non-heap memory? |
| Alerting | Is there an alert on the trend of memory usage, not just a static “memory too high” threshold? |
None of these checks require exotic tooling — most are a matter of discipline and a few hours of deliberate testing before a risky change reaches production traffic at scale.
Real-World / Industry Examples
Memory leaks look remarkably similar across radically different industries, once you know what to look for. The examples below sample a handful of domains where this pattern shows up under different names, on different scales.
Netflix-style platforms
Long-running playback and recommendation services process millions of continuous sessions; teams rely heavily on heap dump diffing and automated canary analysis specifically to catch leaks before they reach the full production fleet, given the scale at which even a small leak becomes costly.
Amazon-style peak sales
Sustained high traffic during flash sales accelerates any existing leak dramatically — a leak that might take weeks to matter under normal load can exhaust memory within hours under sale-day traffic, which is why load testing at realistic sustained volume is standard practice before major sale events.
Uber-style ride-hailing
Systems that track live location updates for millions of active trips are especially exposed to per-entity state that must be explicitly cleared when a trip ends — forgetting to clear driver/rider state on trip completion is a textbook leak pattern in this domain.
App servers
Classic “classloader leak” incidents from repeated hot-redeployment of Java web applications on shared app servers (Tomcat, WebLogic) were common enough in the 2000s–2010s that most JVM app servers eventually added specific detection and warning tooling for exactly this pattern.
Chrome-style engines
Browser engines juggle thousands of open tabs’ worth of DOM nodes, event listeners, and detached JavaScript closures; browser vendors publish and maintain their own dedicated heap-snapshot tooling specifically because tab-level memory leaks were, for years, one of the most common user-facing complaints about browser performance.
Trading systems
Low-latency trading platforms are especially sensitive to GC pause growth caused by leaks, since even a modest increase in pause time can translate directly into missed trading opportunities — which is part of why this industry was an early, aggressive adopter of low-pause and pauseless garbage collection technology.
Across every one of these domains, the pattern repeats: the specific object type differs (sessions, listeners, DOM nodes, order state), but the structural cause is identical — something is added to a long-lived structure on a well-defined event, and the corresponding removal, tied to the matching end-of-life event, is missing or incomplete.
It is also worth noting what these industries have in common operationally: each one eventually invested in dedicated internal tooling, dashboards, and even entire teams focused partly on memory reliability, precisely because the cost of an undetected leak at their scale — millions of concurrent users, life-critical timing, or financial transactions — was high enough to justify it. Smaller teams rarely need anything nearly that elaborate, but the underlying lesson scales down cleanly: the earlier a leak is caught, the cheaper it is to fix, and the cheapest possible time to catch one is still during code review, long before it ever reaches a production dashboard.
FAQ, Summary & Key Takeaways
A short set of the questions that come up most often once the theory is out of the way, followed by a compact recap of the ideas most worth keeping.
Can a garbage-collected language still have memory leaks?
Yes. Garbage collection prevents forgetting to free memory that is truly unused, but it cannot prevent a program from holding an unnecessary reference to something it no longer needs. That reference is exactly what defines a leak in these languages.
How is a memory leak different from just “using a lot of memory”?
Using a lot of memory for active, needed data is normal and expected. A leak specifically means memory usage keeps growing over time for data that is no longer needed but never released — the defining signal is an upward trend over time, not a high absolute number at one moment.
Does restarting the application “fix” a leak?
It resets memory to zero temporarily, masking the symptom, but the underlying code bug remains and the leak will begin accumulating again immediately after restart.
What is the fastest way to confirm a suspected leak?
Graph heap usage after each garbage collection cycle over several hours under steady load. A flat, sawtooth-bottomed line is healthy; a line whose lowest points keep climbing is a leak.
Is a memory leak the same thing as high memory usage?
No. A service that legitimately needs 4 GB to hold its working data set and stays steady at 4 GB is not leaking — it is just memory-intensive. A service that starts at 500 MB and climbs to 4 GB over a week with no corresponding increase in real workload is leaking. The distinguishing factor is the trend over time relative to actual demand, not the absolute number.
Can memory leaks happen in JavaScript, even though browsers manage memory automatically?
Yes — closures that capture large scopes and are stored in a long-lived variable, detached DOM nodes still referenced by JavaScript event handlers, and forgotten setInterval timers are all common JavaScript-specific leak patterns, following the exact same reachability logic described throughout this article, just in a browser’s JavaScript engine instead of the JVM.
Should every application add memory monitoring, even small ones?
Any application expected to run continuously for more than a few hours — which describes almost every production backend service — benefits from at least basic heap and restart-frequency monitoring, since the cost of adding it is low and the cost of an undiagnosed leak causing an outage is typically much higher.
Do interpreted languages like Python leak memory differently than compiled languages like Java?
The underlying cause is identical — an object stays reachable longer than it is logically needed. What differs is the mechanism: Python’s reference counting plus cyclic collector versus Java’s generational mark-and-sweep-based collectors. Diagnostic tools differ accordingly (Python’s tracemalloc and objgraph versus Java’s heap dump analyzers), but the reasoning process — find what is growing, trace what is still referencing it, break that reference — is the same in every language.
Key Takeaways
- A memory leak is memory the program keeps alive that it will never actually use again — not memory the computer “forgot about.”
- Garbage collectors reclaim unreachable objects; leaks happen because a reference chain keeps an unneeded object technically reachable.
- Leaks are dangerous specifically because they are silent and slow — they pass tests, then cause failures much later, often unpredictably and under the worst possible load.
- The clearest fingerprint of a leak is a steadily rising memory floor after each garbage collection cycle, not a single high memory reading.
- Common real-world causes: unbounded caches, forgotten listener/observer unregistration, unclosed connections, uncleared thread-locals.
- Fixes are almost always about explicit, guaranteed cleanup:
try-with-resources, bounded caches with eviction, and clearing thread-locals infinallyblocks. - In cloud and containerized environments, leaks often hide behind auto-restarts (like Kubernetes OOMKilled loops), so restart frequency itself deserves monitoring as a leak signal.
- No memory management strategy — manual, garbage-collected, reference-counted, or ownership-based — fully eliminates leaks; each just changes the kind of mistake that causes one.
Ultimately, treating memory leaks as a reliability concern rather than a niche performance detail changes how a team builds software. It means bounded collections and paired lifecycle calls become a default habit rather than an afterthought, soak testing becomes a normal part of shipping long-running services rather than an optional luxury, and memory trend graphs earn a permanent place on production dashboards next to error rates and latency. None of this requires exotic tooling or deep low-level expertise — it requires the same discipline this entire article has been building toward: always ask, for anything a program remembers, exactly when and how it will be allowed to forget.