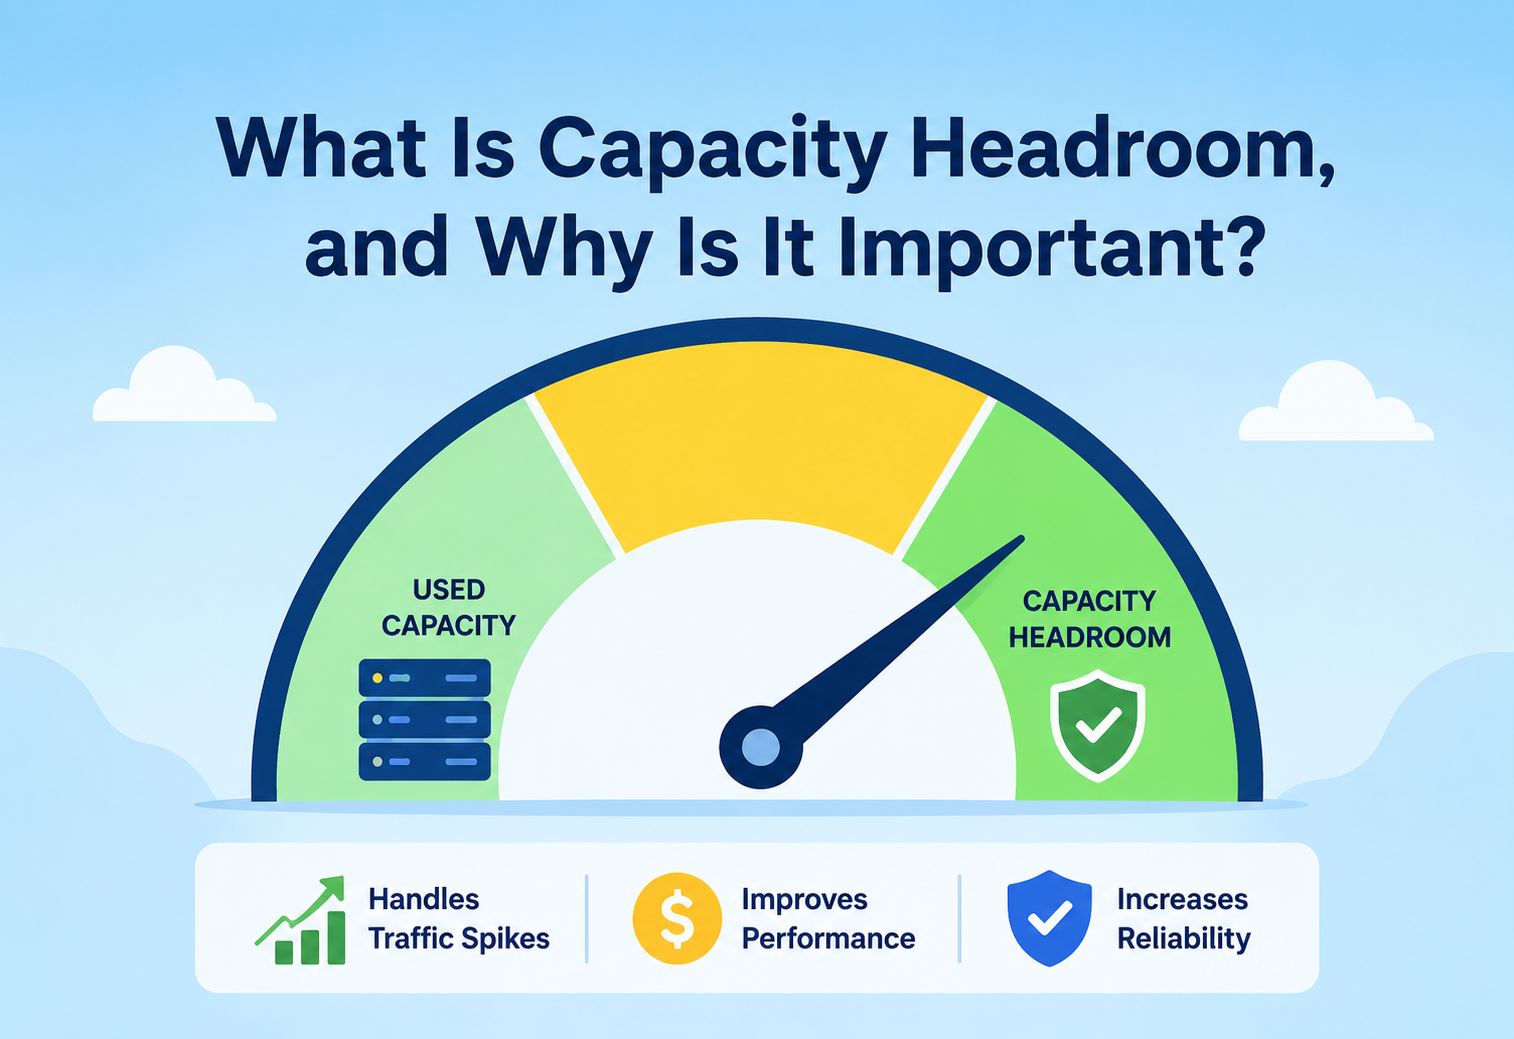
What Is Capacity Headroom, and Why Is It Important?
A complete, beginner-to-production guide to understanding spare capacity in systems — what it is, how to measure it, how to plan for it, and how the biggest platforms in the world use it to survive their worst days.
The Spare Room in Every Well-Run System
Capacity headroom is the deliberate, quietly reserved slack that lets a system absorb its worst moments without collapsing — the difference between infrastructure that merely runs and infrastructure that stays trustworthy on the days that actually matter.
Imagine you own a small tea stall. On a normal day, you serve 100 cups of tea. Your stove, your kettle, your cups, and your helper can easily handle that. But one day, a cricket match finishes nearby and 300 people walk toward your stall at once. If you only ever prepared for exactly 100 cups a day, you would run out of cups, run out of gas, and run out of patience within minutes. Half the crowd would leave angry, and some might never come back.
Now imagine a smarter version of you. You always keep a stove that can handle 150 cups, an extra gas cylinder in the back, and 50 spare cups washed and ready. That extra capacity you were not using on a normal day — that “just in case” buffer — is exactly what engineers call capacity headroom.
In computer systems, capacity headroom means the same thing: the gap between how much load your system is actually handling right now and how much load it is capable of handling before it starts to slow down, error out, or crash. It is the spare room left in your servers, databases, networks, and queues after today’s normal traffic has already been served. Understanding this one idea well will make almost every other topic in system design — scaling, reliability, monitoring, and cost — noticeably easier to reason about.

A Short History
The idea of keeping spare capacity is not new — it existed long before computers. Telephone exchanges in the early 1900s were built with extra switchboard lines because engineers knew that on holidays like New Year’s Eve, everyone would try to call at once. Power grid engineers have always built extra generation capacity above the expected peak demand, because a blackout during a heatwave can be dangerous, not just inconvenient.
When computing moved from single mainframes to networks of servers in the 1990s and then to internet-scale systems in the 2000s, the same instinct carried over. Early web companies learned this lesson the hard way. Websites would launch, get featured on the news, and then crash within minutes because they had built servers for “normal” traffic and never planned for a spike. This repeated failure across the industry — often called being “hugged to death” or experiencing the “Slashdot effect” — is what pushed capacity planning and capacity headroom from being a nice-to-have into being a core discipline of system design, especially as companies like Amazon, Google, and Netflix grew to serve hundreds of millions of users.
Today, capacity headroom is a first-class concept in Site Reliability Engineering (SRE), cloud infrastructure planning, and system design interviews, because almost every major outage in tech history — from e-commerce sites crashing during sales, to ticket-booking systems failing during ticket drops, to government portals going down during exam result releases — traces back to running with too little headroom.
Think of capacity headroom the way you think of an emergency lane on a busy highway. On an ordinary day, cars are not supposed to drive on it — it looks like “wasted” road. But the moment an ambulance needs to pass or a lane closes for repair, that lane is what keeps traffic moving instead of grinding to a halt. In production systems, headroom looks exactly like waste until the day it turns out to be the reason the whole thing did not collapse.
Why Running “Full” Is a Trap
Why do systems need spare capacity at all? Why not just build a system that uses 100% of what it has, all the time, so nothing is “wasted”? This sounds efficient, but it is actually a trap. Let us understand why.
The Core Problem: Traffic Is Never Flat
Real-world traffic to any system is almost never a smooth, constant line. It moves up and down because of:
- Daily cycles — more people shop online in the evening than at 4 AM.
- Weekly cycles — a food delivery app is busier on Friday and Saturday nights.
- Seasonal spikes — a retail site gets 10x traffic during a festival sale.
- Sudden viral events — a product goes viral on social media and traffic jumps 50x in an hour.
- Internal failures — one server in a cluster of 10 crashes, and the other 9 must absorb its share of the load instantly.
If a system is built to run at 100% of its maximum capacity during normal times, then it has zero room to absorb any of the events above. The moment traffic rises even slightly, or one piece of infrastructure fails, the entire system tips over — much like a bus that is already 100% full cannot pick up even one more passenger without someone falling off.
An elevator rated for “10 people” is not actually built to snap the moment the 11th person tries to enter. Engineers design it with a safety margin far beyond its rated capacity. But that margin is not meant to be used every day — it exists for the rare moment something goes slightly wrong: a heavier-than-average group, a small mechanical wear-and-tear, or an overload sensor calibration error. Capacity headroom in computing plays exactly this safety-margin role, except we design it deliberately and measure it constantly, rather than leaving it to guesswork.
What Happens Without Headroom — The Hockey Stick Curve
When a system runs too close to its limit, small increases in load cause disproportionately large problems. This is because most system resources — CPU, memory, database connections, network bandwidth — do not degrade gracefully in a straight line. They degrade in a curve that gets steep very fast near the limit.
This diagram shows something crucial: response time does not increase gently as load increases. It stays flat for a long time, and then near the system’s limit, it explodes upward almost vertically. This is sometimes called the “hockey stick curve” of system performance. Capacity headroom exists specifically to keep a system operating on the flat, safe part of this curve — far away from the steep, dangerous part.
The Business Motivation
This is not just a technical concern; it has direct, measurable business consequences that reach well beyond the engineering team, touching customer support volumes, marketing return on investment, and even a company’s brand reputation in the press. A production system with insufficient headroom leads to:
- Lost revenue during traffic spikes (the exact moments when a business needs its system the most, like a flash sale).
- Damaged customer trust — users who see errors during checkout often do not come back.
- Cascading failures — one overloaded service can bring down other healthy services connected to it.
- On-call engineers being paged at 3 AM to firefight a preventable outage.
- Regulatory or reputational damage for critical systems like banking, healthcare, or government portals.
Capacity headroom, therefore, is the technical answer to a very human and business problem: how do we keep our promise to users even on our worst days, not just our average days?
There is also a quieter, longer-term cost that is easy to overlook: teams that repeatedly operate close to the edge of their capacity tend to accumulate stress and slow down in unrelated ways. Engineers become reluctant to ship new features close to a known busy period out of fear of tipping an already-strained system over. Planned maintenance gets delayed because there is never a “safe enough” window. Over time, a chronic lack of headroom quietly taxes an entire engineering organization’s ability to move confidently, not just the uptime of a single service on its worst day. A healthy headroom culture, by contrast, tends to show up as calmer on-call rotations, more predictable release schedules, and engineers who trust their own infrastructure enough to ship changes with confidence rather than dread.
The Vocabulary of Spare Capacity
Let us break capacity headroom down into precise, learnable pieces. Every term below is something you will hear again and again in real engineering teams — in design documents, in incident post-mortems, in on-call handoffs, and in system design interviews.
Getting comfortable with this exact vocabulary is often what separates someone who has an intuitive feel for “systems should have some spare room” from someone who can actually sit down, measure a real system’s headroom, defend a scaling decision with numbers, and explain trade-offs clearly to both engineers and non-technical stakeholders.
3.1 Capacity
What it is: The maximum amount of work a system, service, or resource can handle in a given time period while still meeting its performance and reliability targets.
Why it exists: Every physical or virtual resource — a CPU core, a network cable, a database connection pool — has an upper limit. Capacity is simply that ceiling, measured in a unit that matches the resource: requests per second, transactions per second, connections, megabits per second, or CPU cores.
A water pipe has a capacity — the maximum litres of water it can carry per minute before pressure problems start. A classroom has a capacity — the maximum number of students it can seat comfortably.
Software example: A single instance of a Spring Boot REST API, running on a given machine, might be able to handle 500 requests per second before response times start to degrade. That 500 req/s is its practical capacity.
Production example: Netflix’s video streaming edge servers are provisioned with a known maximum throughput per server (measured in gigabits per second of video data), which feeds directly into how many servers they need in each region.
3.2 Utilization
What it is: The percentage of capacity currently being used. If a system’s capacity is 500 requests/second and it is currently receiving 300 requests/second, utilization is 60%.
If your classroom seats 40 students and 28 are present today, the classroom is at 70% utilization.
Formula:

Utilization (%) = (Current Load / Maximum Capacity) × 100
3.3 Capacity Headroom
What it is: The unused portion of capacity — the gap between current utilization and 100% capacity. It is usually expressed as a percentage.
Headroom (%) = 100% − Utilization (%)
Headroom (%) = ((Maximum Capacity − Current Load) / Maximum Capacity) × 100
If a database can handle 1,000 transactions per second at its safe operating limit, and it is currently processing 650 transactions per second, then Utilization = 650 / 1000 × 100 = 65%, and Headroom = 100% − 65% = 35%. This system has 35% headroom — meaning traffic could grow by roughly another 54% from its current level (350 more transactions per second) before hitting its known safe limit.
3.4 Peak Load vs Average Load
Two numbers matter enormously in capacity planning, and confusing them is one of the most common beginner mistakes:
- Average load — the typical, everyday amount of traffic a system sees, averaged over a day, week, or month.
- Peak load — the highest amount of traffic the system experiences, usually during a specific short window (a sale, a launch, a viral moment).
Capacity headroom must always be calculated against expected peak load, not average load. A system sized only for average load will look perfectly healthy 95% of the time and then fail catastrophically during the 5% of moments that matter most to the business.
3.5 Safety Margin / Buffer
What it is: A deliberately planned percentage of headroom that is always kept in reserve, even above expected peak load, to absorb the unexpected — sudden spikes, hardware failures, or estimation errors. Many teams target keeping normal peak utilization around 60–70% of maximum capacity, deliberately leaving 30–40% headroom as a safety margin.
3.6 Bottleneck
What it is: The single resource in a system that runs out of headroom first, and therefore limits how far the whole system can scale — even if every other resource still has plenty of room. A system is only ever as strong as its tightest bottleneck.
A four-lane highway that suddenly narrows to one lane at a bridge. It does not matter how wide the rest of the highway is — the bridge decides the maximum traffic flow for the entire route.
3.7 Elasticity
What it is: The ability of a system to automatically add or remove capacity in response to real-time demand, rather than relying purely on a fixed, pre-provisioned buffer. Cloud auto-scaling groups are the most common real-world implementation of elasticity.
3.8 Sustained Load vs Burst Load
What it is: Two different traffic patterns that stress headroom in different ways. Sustained load is traffic that stays elevated for a long period — hours or days — such as the extended busy period during an entire festival shopping week. Burst load, by contrast, is a very short, sharp spike — often lasting only seconds or a few minutes — such as the instant a popular concert’s tickets go on sale.
Sustained load is like a restaurant being consistently busy every evening for a whole month of a local festival. Burst load is like every single table being requested in the first sixty seconds after the restaurant opens its doors on a single, famous opening night.
Why the distinction matters: auto-scaling handles sustained load reasonably well, because it has time to add servers gradually as load climbs. Burst load is far more dangerous, because there is often no time to scale before the peak has already arrived and gone — this is exactly why a static safety buffer, kept ready at all times, remains essential even in highly automated, elastic systems.
3.9 Warning Threshold vs Critical Threshold
What it is: Most mature monitoring setups define at least two thresholds for headroom, not just one. A warning threshold (for example, headroom falling below 30%) triggers a notification for engineers to plan proactive action, like scheduling additional capacity. A critical threshold (for example, headroom falling below 10%) triggers an urgent, often automated response, like immediate auto-scaling or emergency load shedding.
A car’s fuel gauge has a soft warning light at roughly a quarter tank, giving the driver time to plan a stop, and a much more urgent, flashing warning near empty, demanding an immediate reaction. Headroom thresholds work the same way — a gentle early signal followed by an urgent late one.
3.10 Effective Capacity vs Theoretical Capacity
What it is: Theoretical capacity is what a resource could handle under perfect, laboratory conditions. Effective capacity is what it can actually sustain in the messy real world, accounting for factors like network latency between regions, garbage collection pauses in managed-memory languages like Java, background maintenance jobs, and the overhead of monitoring and logging itself. Effective capacity is almost always meaningfully lower than theoretical capacity, and it is effective capacity — not the number on a hardware spec sheet — that should be used when calculating real headroom.
Headroom Lives at Every Layer
Capacity headroom is not a single number sitting in one place — it is something you must track across every layer of a system’s architecture, because each layer can become the bottleneck independently.
Each box in this diagram has its own capacity ceiling and therefore its own headroom number. A production-ready system tracks headroom at every one of these layers, because an outage can be caused by exhausting headroom in any single one of them, regardless of how healthy the rest look.
4.1 Compute Layer (CPU & Memory)
Every application server has a CPU and memory ceiling. Once CPU utilization crosses roughly 70–80% sustained, response times typically start climbing sharply due to context-switching overhead and thread contention. Memory headroom matters even more directly: if memory runs out, the operating system may start swapping to disk (drastically slowing everything down) or the process may simply crash with an out-of-memory error.
4.2 Network Layer (Bandwidth & Connections)
Load balancers, network interfaces, and firewalls all have a maximum throughput measured in requests per second or megabits per second, and a maximum number of concurrent open connections. Running out of headroom here shows up as connection timeouts even when application servers themselves are healthy.
4.3 Database Layer (Connections, IOPS, Storage)
Databases have several independent capacity ceilings at once: the number of simultaneous connections allowed, the disk input/output operations per second (IOPS) it can sustain, and the raw storage space available. A database can be at 20% CPU utilization and still be completely out of headroom because its connection pool is exhausted.
4.4 Queueing & Messaging Layer
Message queues (like Kafka or RabbitMQ) have throughput limits and, more subtly, a “queue depth” headroom — how much backlog can build up before consumers can no longer catch up, causing ever-growing delay.
4.5 Third-Party & Downstream Dependencies
Many teams forget that external APIs, payment gateways, and SMS/email providers also have their own rate limits and capacity ceilings. Your own system might have plenty of headroom while a downstream partner’s API does not — and that becomes your bottleneck during a spike.
A practical step many teams skip is simply drawing out a full dependency map before a major event: every internal service, every external vendor, and every shared piece of infrastructure that sits anywhere on a critical user journey, along with each one’s known rate limits or contractual capacity guarantees. Without this map, it is easy to spend weeks confidently scaling your own infrastructure for a big sale, only to discover on the day itself that a third-party SMS provider used for order confirmations has a much lower ceiling than your own checkout flow does, quietly capping your effective capacity regardless of how much headroom your own servers have.
How Engineers Actually Arrive at the Numbers
Capacity headroom is calculated using a mix of historical data, load testing, and mathematical modeling. Let us walk through how engineers actually arrive at the numbers — step by step, with real formulas and code.
5.1 Step 1 — Establish Maximum Safe Capacity
This is usually found through load testing: deliberately sending increasing amounts of synthetic traffic to a system in a controlled environment until a defined performance target (like “95% of requests complete within 200ms”) is violated. The load level just before violation is recorded as the safe maximum capacity — not the absolute breaking point, but the point beyond which service quality degrades.

5.2 Step 2 — Measure Current and Historical Load
Using monitoring tools, engineers track requests per second, transactions per second, or concurrent users over time, usually looking at percentiles (like the 95th or 99th percentile of daily peak) rather than a single average, since averages hide dangerous spikes.
5.3 Step 3 — Apply the Headroom Formula per Resource
Headroom (%) = ((Max Safe Capacity − Peak Observed Load) / Max Safe Capacity) × 100
This is calculated separately for CPU, memory, database connections, network throughput, and any other constrained resource — because, as covered above, the lowest headroom number across all resources is the one that actually matters (this is called the binding constraint).
5.4 Step 4 — Forecast Future Demand
Capacity planning is forward-looking. Engineers use historical growth trends (for example, “traffic has grown 8% month over month for the last six months”) combined with known future events (a marketing campaign, a product launch, a festival sale) to forecast what peak load will look like weeks or months ahead, then check whether current headroom will still be sufficient by that date.
5.5 A Java Example: Calculating Headroom Programmatically
Here is a simple Java utility a monitoring service might use to calculate headroom across multiple resources and flag the tightest one — the binding constraint.
import java.util.*;

public class CapacityHeadroomCalculator {

    // Represents one resource's capacity snapshot
    record ResourceCapacity(String name, double maxCapacity, double currentLoad) {
        double utilizationPercent() {
            return (currentLoad / maxCapacity) * 100.0;
        }
        double headroomPercent() {
            return 100.0 - utilizationPercent();
        }
    }

    public static void main(String[] args) {
        List<ResourceCapacity> resources = List.of(
            new ResourceCapacity("App Server CPU", 100.0, 62.0),   // in % CPU
            new ResourceCapacity("DB Connections", 200.0, 168.0),  // pool size
            new ResourceCapacity("Network Bandwidth (Mbps)", 1000.0, 410.0),
            new ResourceCapacity("Message Queue (msgs/sec)", 5000.0, 4700.0)
        );

        System.out.println("Resource Headroom Report");
        System.out.println("-------------------------------------------------");

        ResourceCapacity bottleneck = null;
        double lowestHeadroom = Double.MAX_VALUE;

        for (ResourceCapacity r : resources) {
            double headroom = r.headroomPercent();
            System.out.printf("%-28s Utilization: %5.1f%%  Headroom: %5.1f%%%n",
                    r.name(), r.utilizationPercent(), headroom);

            if (headroom < lowestHeadroom) {
                lowestHeadroom = headroom;
                bottleneck = r;
            }
        }

        System.out.println("-------------------------------------------------");
        System.out.printf("Binding constraint (lowest headroom): %s (%.1f%% headroom left)%n",
                bottleneck.name(), lowestHeadroom);

        if (lowestHeadroom < 20.0) {
            System.out.println("WARNING: Headroom is critically low. Scale this resource soon.");
        }
    }
}
Notice how the message queue, at 4700 out of 5000 messages/sec, has only 6% headroom — even though the CPU still has 38% headroom and the network has 59%. This is the binding constraint: the queue is the resource that will fail first if traffic keeps rising, and it is the one engineers must act on, regardless of how comfortable the other resources look.
5.6 Forecasting With Growth Rates: A Worked Example
Suppose a service currently handles a peak of 4,000 requests per second, and its tested maximum safe capacity is 6,000 requests per second. Today’s headroom is:
Headroom today = ((6000 − 4000) / 6000) × 100 = 33.3%
Now suppose historical data shows traffic has been growing at a steady 10% per month for the last several months. To find out how many months remain before headroom is exhausted, engineers project forward month by month:
Month 0: 4000 req/s   → Headroom = 33.3%
Month 1: 4400 req/s   → Headroom = 26.7%
Month 2: 4840 req/s   → Headroom = 19.3%
Month 3: 5324 req/s   → Headroom = 11.3%
Month 4: 5856 req/s   → Headroom = 2.4%
Month 5: 6442 req/s   → Headroom = NEGATIVE (over capacity)
This simple projection tells the team something extremely actionable: at the current growth rate, they have roughly four months before headroom drops below a safe 10% threshold, and about five months before the system is projected to exceed its tested safe capacity entirely. This kind of forward-looking math is what allows infrastructure scaling to be planned calmly, on a normal engineering timeline, instead of being triggered by a crisis after the fact. Note that real growth is rarely as perfectly linear as this simplified example, which is exactly why the projection should be revisited every month with fresh data, rather than trusted blindly for half a year at a time.
5.7 Little’s Law — A Useful Mental Model
A classic formula from queueing theory, Little’s Law, helps reason about headroom in systems with queues (like thread pools or message queues):
L = λ × W

L = average number of requests in the system
λ = average arrival rate of requests
W = average time a request spends in the system
In simple terms: if requests are arriving faster than they can be processed, the number of requests waiting in the system (L) grows without bound, and headroom disappears — even if each individual request is technically still “succeeding,” just very slowly. This is exactly what happens during cascading slowdowns.
The Capacity Planning Cycle That Never Stops
Capacity headroom is not a one-time calculation; it is a continuous cycle that repeats throughout the life of a production system.
- Measure — Collect real usage data: CPU, memory, database load, request rates, and their peaks (not just averages).
- Forecast — Combine historical growth trends with known upcoming events to project future peak demand.
- Test — Run load tests and stress tests to confirm the actual maximum safe capacity of the current setup (this number drifts over time as code changes, so it must be re-tested periodically).
- Compare — Check forecasted peak demand against tested safe capacity to compute projected future headroom.
- Decide — If projected headroom will fall below the team’s safety threshold (commonly 20–30%), plan a scaling action before that date arrives, not after.
- Scale — Add capacity where the projection says it will be needed — vertically, horizontally, or via auto-scaling policies — ideally well before the projected exhaustion date.
- Monitor — Once running, continuously watch real-time metrics with alerting so that unexpected deviations are caught immediately, and the cycle restarts.
This lifecycle is why capacity planning is treated as an ongoing engineering practice, not a one-off project — a system that had 40% headroom six months ago may have only 5% today if user growth was not tracked.
Cost vs Risk, Made Explicit
Capacity headroom is fundamentally a trade-off between infrastructure spend and operational risk. Naming both sides honestly is the first step to choosing a target that fits the business.
7.1 Advantages of Maintaining Healthy Headroom
Why Healthy Headroom Pays Off
- Resilience — the system absorbs unexpected spikes without falling over.
- Graceful failure handling — if one node fails, remaining capacity absorbs its share.
- Room to deploy safely — rolling and canary releases need spare capacity to run old and new versions side by side.
- Better user experience — response times stay stable and predictable under load.
- Time to react — engineers get early warning and can scale before a crisis.
The Real Costs of Headroom
- Idle cost — unused capacity still costs money on every billing cycle.
- Complexity — tracking and forecasting per service requires tooling and discipline.
- Over-provisioning risk — excessive “just to be safe” buffers waste budget.
- False sense of security — on-paper headroom is meaningless if the real binding constraint was measured wrong.
7.2 The Core Trade-off
Capacity headroom is fundamentally a trade-off between cost and risk. More headroom means more safety but more spend on infrastructure that mostly sits idle. Less headroom means lower cost but higher risk of outages during spikes. There is no universally “correct” headroom percentage — it depends on how critical the system is, how unpredictable its traffic is, and how expensive an outage would be for the business.
| System Type | Typical Target Headroom | Reasoning |
|---|---|---|
| Payment / checkout systems | 40–50%+ | Outages directly cost revenue and trust; traffic can spike sharply during sales. |
| Internal admin tools | 10–20% | Predictable, low-stakes traffic; downtime is inconvenient, not critical. |
| Ticket-booking / flash-sale platforms | 60%+ or elastic auto-scaling | Extreme, short, unpredictable spikes at launch time. |
| Batch / reporting jobs | 5–15% | Not latency-sensitive; can queue and catch up later. |
Two Ways to Grow, Both Tied to Headroom
Capacity headroom is deeply tied to how a system scales. There are two broad scaling strategies, and each interacts with headroom differently.
8.1 Vertical Scaling (Scale Up)
Adding more power to an existing machine (more CPU, more RAM). This increases the maximum capacity ceiling of a single node, effectively creating more headroom without adding new nodes — but it has a hard limit (the biggest machine you can buy) and typically requires downtime to apply.
8.2 Horizontal Scaling (Scale Out)
Adding more machines/nodes behind a load balancer. This is the more common approach for headroom management at internet scale, because it can, in principle, be increased indefinitely and can be automated.
8.3 Auto-Scaling: Turning Headroom Into an Automated System
Modern cloud platforms allow headroom management to be automated through auto-scaling groups, which watch a metric (like CPU utilization) and automatically add or remove server instances to keep utilization within a target band — for example, “keep CPU utilization between 50% and 70%; add a server if it goes above 70% for 3 minutes; remove one if it drops below 50% for 10 minutes.”
// Simplified illustration of an auto-scaling decision in Java
public class AutoScalerDecision {

    static final double SCALE_OUT_THRESHOLD = 70.0; // % utilization
    static final double SCALE_IN_THRESHOLD  = 50.0;

    public static String decide(double currentUtilization, int currentInstances) {
        if (currentUtilization > SCALE_OUT_THRESHOLD) {
            int newInstances = currentInstances + 1;
            return "Scale OUT: " + currentInstances + " -> " + newInstances + " instances";
        } else if (currentUtilization < SCALE_IN_THRESHOLD && currentInstances > 1) {
            int newInstances = currentInstances - 1;
            return "Scale IN: " + currentInstances + " -> " + newInstances + " instances";
        }
        return "No action: utilization (" + currentUtilization + "%) within target band";
    }

    public static void main(String[] args) {
        System.out.println(decide(82.0, 4));  // Scale OUT
        System.out.println(decide(35.0, 4));  // Scale IN
        System.out.println(decide(60.0, 4));  // No action
    }
}
Auto-scaling effectively converts a fixed, manually-managed headroom buffer into a dynamic one — the system continuously reshapes its own capacity to match real demand, which is more cost-efficient than permanently over-provisioning, but requires careful tuning: scale too slowly and you still suffer during sudden spikes (this delay is called scaling lag).
8.4 Headroom for Traffic Spikes That Auto-Scaling Cannot Catch
Auto-scaling takes time — new servers need to boot, register with the load balancer, and warm up caches. This means a small amount of static headroom must always be kept as a buffer to survive the first few minutes of a sudden spike, before auto-scaling can react. This is why even highly automated systems still keep a manual safety margin.
8.5 Stateless vs Stateful Services and Ease of Scaling
How easily a service can turn extra headroom into extra usable capacity depends heavily on whether it is stateless or stateful. A stateless service — one that does not keep any request-specific data in its own memory between requests, such as a typical REST API that reads and writes everything to an external database — can usually be scaled out simply by adding identical new instances behind a load balancer, since any instance can handle any incoming request. A stateful service — one that holds meaningful data in memory, such as an in-memory session store, a stateful WebSocket connection, or a database itself — is far harder to scale this way, because new instances do not automatically have access to the existing state, and simply adding more of them does not, by itself, add usable headroom for existing in-flight work. This is a major reason why architects deliberately push as much state as possible out of application servers and into dedicated, purpose-built data stores: it keeps the application layer stateless and therefore easy to scale, concentrating the harder stateful scaling problem into a smaller, more specialized part of the system.
Redundancy Without Headroom Still Fails
Capacity headroom is one of the pillars of high availability (HA). A system can be perfectly redundant on paper — with multiple servers, multiple database replicas, multiple regions — and still fail if headroom was not accounted for correctly.
9.1 The N+1 (and N+2) Redundancy Model
A common HA design principle is N+1 redundancy: if a system needs “N” servers to handle expected peak load, it is provisioned with “N+1” — one extra server’s worth of capacity — so that if any single server fails, the remaining N servers can still absorb full peak load without anyone noticing. Critical systems often use N+2, tolerating two simultaneous failures.
9.2 Failover and Headroom
During a failover event — where traffic is redirected from a failed node, zone, or region to a healthy one — the healthy side must have enough spare headroom to absorb both its own normal load and the redirected load. If the surviving region was already running near 100% utilization, a failover can cause a second, larger outage on top of the first one (a cascading failure).
A very common real-world outage pattern looks like this: Server A gets overloaded and becomes slow. The load balancer, seeing Server A struggling, shifts more traffic to Servers B and C. But B and C did not have enough headroom either, so they now become slow too. As all servers slow down, retries from client applications multiply the effective load even further, and the entire cluster collapses — even though, individually, no single server ever technically “crashed.” Sufficient headroom at every node is what prevents this domino effect.
9.3 Disaster Recovery (DR) Capacity
In multi-region disaster recovery setups, the backup region must have enough headroom to take over the primary region’s full traffic if the primary fails entirely. Many organizations under-invest here, keeping the DR region at a much smaller size “to save cost,” which means a real disaster recovery event still results in a severe slowdown or outage — defeating the purpose of DR.
9.4 Warm-Up Time and Cold Capacity
A subtle but important detail in high availability planning is that not all “available” capacity is instantly usable. A freshly started application server often needs time to warm up — populating local caches, establishing database connection pools, and letting a Just-In-Time compiler (in the case of the Java Virtual Machine) optimize frequently used code paths. During this warm-up window, the new server may only be able to safely handle a fraction of its eventual steady-state capacity. Treating a cold, just-started server as though it already offers full headroom is a common and costly mistake, since routing full production traffic to it immediately can cause it to fail before it ever gets the chance to warm up.
9.5 Graceful Shutdown and Headroom During Deployments
Rolling deployments — where servers are updated one at a time rather than all at once — temporarily reduce the total available capacity of a cluster, since some servers are always mid-update and not serving traffic. Planning deployment-time headroom means ensuring the remaining active servers can absorb full traffic even while a portion of the fleet is intentionally offline for the update, which is another reason permanent, fixed-at-the-edge utilization (running every server at 100% all the time) is dangerous — it leaves no safe way to perform routine, everyday maintenance.
Attacks Are Often Attacks on Headroom
Security and capacity headroom are more closely linked than most beginners expect. A huge category of security incidents is, at its core, an attack on headroom itself.
10.1 Denial of Service (DoS) and Distributed Denial of Service (DDoS)
A DoS attack is, in plain terms, a deliberate attempt to consume every last bit of a system’s headroom on purpose, using traffic that looks legitimate enough to get through the front door, until real users can no longer be served. A Distributed Denial of Service (DDoS) attack does the same thing but from thousands or millions of different sources at once, making it far harder to block with a simple rule like “ignore this one IP address.”
Imagine a small shop with room for 30 customers. A DoS attack is like one determined troublemaker sending 30 friends inside just to stand around and never buy anything, so no real, paying customer can get in the door. A DDoS attack is the same trick, except the troublemaker sends people from a thousand different directions at once, so the shopkeeper cannot simply block “the person at the door.”
Because DDoS attacks are specifically designed to exhaust headroom, defenses against them are also, fundamentally, headroom strategies: content delivery networks (CDNs) that absorb and filter huge volumes of traffic before it ever reaches origin servers, rate limiting per client, geographic traffic filtering, and cloud-based scrubbing services that provide enormous elastic headroom specifically reserved for absorbing attack traffic.
10.2 Resource Exhaustion Vulnerabilities
Some security vulnerabilities are not about stealing data at all, but about quietly consuming headroom through legitimate-looking requests that are unusually expensive to process — for example, a search feature that allows extremely broad wildcard queries, or an image upload endpoint that allows unusually large files, both of which can let a small number of malicious requests consume a disproportionate amount of CPU, memory, or storage headroom compared to normal traffic.
10.3 Authentication Storms
A sudden wave of failed login attempts, password reset requests, or bot-driven account creation attempts can silently eat through database and compute headroom long before anyone realizes it is a security event rather than a normal traffic spike, which is why authentication endpoints are often given their own dedicated rate limits and their own separately monitored headroom, isolated from the rest of the application.
10.4 Headroom as Part of a Defense-in-Depth Strategy
Keeping deliberate headroom is itself considered a defensive measure in security-conscious architectures, because a system already running close to its limit has almost no ability to absorb the sudden extra load of an attack, meaning ordinary capacity planning discipline directly reduces how damaging a security incident can become. In this sense, the same monitoring, alerting, and load-testing habits that protect a system from an ordinary traffic spike also happen to be part of its first line of defense against a malicious one.
You Cannot Manage What You Do Not Measure
Headroom is meaningless unless it is actively measured and watched. This is where observability tooling comes in.
11.1 Key Metrics to Track
- Resource utilization — CPU%, memory%, disk I/O%, network throughput, per server and aggregated.
- Saturation — queue lengths, thread pool queue depth, database connection pool usage, message backlog size.
- Latency percentiles — p50, p95, p99 response times, since averages hide the worst-case experience that matters most under load.
- Error rates — 5xx errors, timeouts, and connection refusals, which often spike right as headroom runs out.
- Throughput — requests per second actually being served, compared against known maximum safe capacity.
11.2 Dashboards and Alerting
Production teams build dashboards (commonly using tools like Grafana, Datadog, or New Relic) that show real-time utilization against capacity, and configure alerts that fire well before headroom is exhausted — for example, “alert when any resource’s headroom drops below 25% for more than 5 minutes” — giving engineers time to act before users are affected, rather than being alerted only after an outage has already started.
11.3 Capacity Reports
Many organizations produce a recurring (often weekly or monthly) capacity report summarizing current headroom across all critical resources, historical trend lines, and projected time until headroom runs out at current growth rates (“at this growth rate, the database will run out of headroom in approximately 7 weeks”). This turns capacity planning from a reactive fire drill into a predictable, plannable engineering task.
Google’s SRE practice defines four “golden signals” for monitoring any system: Latency, Traffic, Errors, and Saturation. Saturation is essentially another name for the inverse of headroom — “how full is the service” — directly tying capacity headroom to one of the most respected monitoring frameworks in the industry.
Where You Run Changes How You Buy Headroom
How and where a system is deployed has a huge impact on how headroom is managed.
12.1 On-Premise Data Centers
In traditional on-premise setups, capacity headroom must be planned far in advance, because buying and installing new physical servers can take weeks or months. Teams often over-provision heavily here, since scaling up quickly is not possible — this is one major reason cloud computing became so popular.
12.2 Cloud Infrastructure (AWS, Azure, GCP)
Cloud platforms fundamentally change the economics of headroom. Instead of buying physical hardware for peak capacity that mostly sits idle, teams can use elastic, on-demand infrastructure that scales headroom up and down automatically, paying only for what is actually used.
- Auto Scaling Groups (AWS) / Virtual Machine Scale Sets (Azure) / Managed Instance Groups (GCP) — automatically add or remove compute capacity based on real-time metrics.
- Serverless (AWS Lambda, Azure Functions) — capacity headroom is largely managed by the cloud provider itself, though concurrency limits and cold-start delays still create their own version of headroom concerns.
- Managed databases with auto-scaling storage/compute — reduce (but do not eliminate) the manual burden of database headroom planning.
12.3 Kubernetes and Container Orchestration
In Kubernetes, capacity headroom exists at multiple nested levels: the headroom of each pod (its CPU/memory request vs limit), the headroom of each node (how many more pods it can host), and the headroom of the overall cluster (whether the cluster autoscaler needs to add more nodes). Kubernetes’ Horizontal Pod Autoscaler (HPA) and Cluster Autoscaler are direct, automated implementations of headroom management.
# Example: Kubernetes HPA config targeting 70% CPU utilization,
# leaving roughly 30% headroom per pod before scaling out
apiVersion: autoscaling/v2
kind: HorizontalPodAutoscaler
metadata:
  name: order-service-hpa
spec:
  scaleTargetRef:
    apiVersion: apps/v1
    kind: Deployment
    name: order-service
  minReplicas: 3
  maxReplicas: 20
  metrics:
    - type: Resource
      resource:
        name: cpu
        target:
          type: Utilization
          averageUtilization: 70
12.4 Cost Optimization vs Headroom
Cloud elasticity does not remove the cost-vs-risk trade-off; it just makes it more tunable. Teams still need to decide target utilization bands, minimum instance counts (to guarantee a floor of headroom even during quiet periods), and maximum instance counts (to control runaway cost during an unexpected spike or a misconfiguration).
12.5 Reserved, On-Demand, and Spot Capacity
Cloud providers typically offer several purchasing models that interact directly with headroom strategy. Reserved capacity is paid for in advance at a discount and guarantees a fixed baseline of always-available headroom, well suited to a system’s predictable steady-state load. On-demand capacity costs more per hour but requires no upfront commitment, making it a good fit for the elastic, unpredictable portion of headroom needed to absorb spikes. Spot or preemptible capacity is offered at a steep discount but can be reclaimed by the provider with little notice, making it appropriate only for non-critical, interruption-tolerant workloads rather than for headroom that protects core user-facing traffic. Many mature cost strategies blend all three: a reserved baseline sized to average load, an on-demand layer to absorb typical daily and weekly peaks, and spot capacity used only for background batch work that can be safely paused if reclaimed.
12.6 Multi-Region Headroom Strategy
Organizations operating in multiple geographic regions must decide how headroom is distributed across regions. An active-active setup runs meaningful traffic through every region simultaneously, meaning each region only needs enough headroom to absorb the load that would be redirected to it if a sibling region failed — not the entire global peak. An active-passive setup keeps one region mostly idle as a standby, which is simpler to reason about but means that idle region’s entire capacity is, by definition, headroom that is paid for continuously but used only during a failover, an intentional and often necessary cost for the reliability it buys.
Where Headroom Usually Runs Out First
The data layer is where most real production headroom crises actually happen. Understanding its specific ceilings — and how caching and sharding multiply usable headroom — is often what separates a system that survives its worst day from one that does not.
13.1 Database Headroom
Databases are frequently the tightest bottleneck in a system because, unlike stateless application servers, they cannot be scaled out horizontally as easily. Key headroom considerations include:
- Connection pool headroom — most databases have a hard cap on simultaneous connections; exhausting this causes new requests to fail even if CPU is idle.
- Read replica headroom — read replicas add read-throughput headroom, but every replica still depends on the single primary for writes, which remains a bottleneck.
- Storage headroom — running out of disk space can be catastrophic and sudden; it must be monitored with generous lead time since resizing storage takes longer than resizing compute.
- IOPS headroom — disk read/write operations per second can bottleneck a database well before CPU or memory does, especially under heavy write load.
13.2 Caching as a Headroom Multiplier
Caching (using tools like Redis or Memcached) is one of the most powerful ways to create headroom cheaply. By serving repeated read requests from a fast in-memory cache instead of the database, a huge percentage of load never reaches the database at all — effectively multiplying the database’s usable headroom without adding a single database server.
A librarian who keeps the 20 most-requested books on a small front desk (cache), instead of walking to the back storage room (database) every single time, can serve far more visitors per hour with the exact same storage room behind her.
13.3 Load Balancers and Headroom Distribution
Load balancers do not just distribute traffic evenly — a well-configured one actively considers each backend server’s remaining headroom, routing more traffic to servers with more spare capacity and less to servers already running hot, using algorithms like least-connections or weighted round-robin instead of plain round-robin.
13.4 Cache Stampede: When Caching Backfires on Headroom
Caching multiplies headroom beautifully most of the time, but it can also create a dangerous single point of failure if not designed carefully. A cache stampede happens when a popular cached item expires, and a large number of simultaneous requests all miss the cache at the same instant, all falling through to the database at once — instantly consuming a large chunk of the database’s headroom that the cache was supposed to be protecting in the first place. Common defenses include staggering cache expiry times slightly per key so they do not all expire simultaneously, and using a lock or “single-flight” pattern so that only one request rebuilds a given cache entry while others briefly wait for the fresh value instead of all hitting the database independently.
13.5 Sharding as a Long-Term Headroom Strategy
When a single database’s headroom cannot be meaningfully increased any further through vertical scaling or read replicas alone — often because write throughput itself is the binding constraint — teams turn to sharding: splitting data across multiple independent database instances, each responsible for a subset of the data (for example, splitting customers by region, or by a hash of their customer ID). Sharding effectively multiplies write headroom by spreading load across many smaller databases instead of one large one, at the cost of significant added application complexity, since queries that need to span multiple shards become considerably harder to write and to keep performant.
Headroom Becomes a Distributed Problem
In a microservices architecture, capacity headroom becomes a distributed problem — dozens or hundreds of independent services, each with their own headroom, calling each other over the network.
14.1 Rate Limiting to Protect Headroom
APIs commonly enforce rate limits (for example, “100 requests per minute per client”) specifically to prevent any single caller from consuming so much capacity that no headroom remains for other callers.
// Simple token-bucket style rate limiter in Java to protect service headroom
import java.util.concurrent.atomic.AtomicInteger;
import java.util.concurrent.Executors;
import java.util.concurrent.ScheduledExecutorService;
import java.util.concurrent.TimeUnit;

public class TokenBucketRateLimiter {
    private final int maxTokens;
    private final AtomicInteger availableTokens;

    public TokenBucketRateLimiter(int maxTokens, int refillPerSecond) {
        this.maxTokens = maxTokens;
        this.availableTokens = new AtomicInteger(maxTokens);

        ScheduledExecutorService scheduler = Executors.newScheduledThreadPool(1);
        scheduler.scheduleAtFixedRate(() -> {
            availableTokens.updateAndGet(current ->
                Math.min(maxTokens, current + refillPerSecond));
        }, 1, 1, TimeUnit.SECONDS);
    }

    public boolean allowRequest() {
        return availableTokens.getAndUpdate(t -> t > 0 ? t - 1 : t) > 0;
    }

    public static void main(String[] args) throws InterruptedException {
        TokenBucketRateLimiter limiter = new TokenBucketRateLimiter(50, 10);
        for (int i = 1; i <= 55; i++) {
            System.out.println("Request " + i + ": " +
                (limiter.allowRequest() ? "ALLOWED" : "REJECTED - protecting headroom"));
        }
    }
}
14.2 Circuit Breakers and Bulkheads
A circuit breaker stops calling a downstream service once it detects that service is failing or slow, preventing the caller from wasting its own headroom on requests that are unlikely to succeed. A related pattern, the bulkhead, isolates capacity per dependency (for example, a separate, capped thread pool for calls to each downstream service) so that one slow dependency cannot consume the entire application’s headroom and starve unrelated features.
14.3 Service Mesh Visibility
In large microservice fleets, service meshes (like Istio or Linkerd) provide built-in metrics on request rates, error rates, and latencies between every service pair, making it far easier to see which specific service-to-service link is running low on headroom — something that is very hard to see manually once there are more than a handful of services.
14.4 Headroom Across a Multi-Hop Call Chain
A single user action in a microservices system often triggers a chain of internal calls — for example, placing an order might call an inventory service, a pricing service, a payment service, and a notification service, one after another or in parallel. Each of these services has its own independent headroom, and the overall reliability of the user-facing action depends on the weakest link in that entire chain, not just the first service the user’s request touches directly.
A relay race team is only as fast as its slowest runner, no matter how fast the other three runners are. A slow, low-headroom payment service can make an otherwise fast, well-provisioned order-placement flow feel slow and unreliable to the end user.
This is why many mature engineering organizations define a headroom budget per service in a critical call chain — an agreed minimum spare capacity each team must maintain for services that sit on the path of business-critical user journeys like checkout or login, reviewed and enforced through the same monitoring and alerting practices described earlier in this guide, rather than left to each individual team’s informal judgment.
14.5 Timeouts and Retry Budgets
When a downstream service is slow because its own headroom is exhausted, a poorly configured caller can make things dramatically worse by retrying failed requests aggressively and immediately, effectively multiplying the load on an already-struggling service. Well-designed systems use a retry budget — a cap on how many retries are allowed within a given time window across the whole client fleet — combined with exponential backoff (waiting progressively longer between retry attempts) and jitter (adding small random delays) to avoid many clients retrying in perfect, load-amplifying unison.
The Toolbox for Protecting Headroom
Certain patterns show up repeatedly across large systems because they exist specifically to create, protect, or intelligently use headroom. And certain anti-patterns show up just as often, quietly eroding it.
15.1 Helpful Patterns
| Pattern | How It Protects Headroom |
|---|---|
| Auto-scaling | Dynamically expands capacity to match real demand instead of relying on a fixed static buffer. |
| Load shedding | Deliberately rejects the lowest-priority requests first once headroom is nearly exhausted, protecting core functionality. |
| Graceful degradation | Turns off expensive, non-essential features (like recommendations) under load, freeing up headroom for essential ones (like checkout). |
| Backpressure | Signals upstream producers to slow down when a downstream consumer’s headroom is running low, instead of silently queuing forever. |
| Caching | Reduces load reaching expensive backend resources, effectively multiplying their usable headroom. |
| Queue-based buffering | Absorbs short bursts by temporarily queuing work rather than requiring instant processing capacity for every spike. |
15.2 Anti-patterns to Avoid
Sizing Only for Average Load
- Guarantees failure the moment traffic deviates from “typical,” which happens constantly in real systems
Ignoring the Binding Constraint
- Celebrating “60% CPU headroom” while database connections are at 98% utilization gives false confidence
No Load Testing Before Major Events
- Assuming a system “should be fine” for a big sale without verifying it under realistic simulated load
One-Time Calculation
- Treating headroom as something checked at launch and never revisited as traffic and code both evolve
Uncontrolled Retries
- Client-side retry logic without backoff can amplify load exactly when a system is already low on headroom, worsening a small problem into an outage
Over-Provisioning Everywhere
- “Just in case” buffers everywhere waste budget without actually addressing the specific resource likely to become the real bottleneck
The Short, Portable Checklist
Everything covered so far in this guide comes together into a short, practical checklist that any team — whether running a single small application or a sprawling fleet of microservices — can use to keep capacity headroom healthy over time, rather than treating it as an afterthought that only gets attention right after an outage.
16.1 Best Practices
- Always calculate headroom against forecasted peak load, not historical average load.
- Track headroom independently for every resource layer (CPU, memory, DB connections, network, queues) — never assume one metric represents the whole system.
- Re-run load tests regularly, especially after major code or infrastructure changes, since safe capacity limits shift over time.
- Set alert thresholds well before headroom is exhausted (for example, alert at 75% utilization, not 99%), to leave time to react.
- Combine static safety buffers with dynamic auto-scaling — auto-scaling handles gradual growth, static buffer handles the first few minutes of sudden spikes.
- Include downstream and third-party dependency limits in capacity planning, not just your own infrastructure.
- Run planned load tests ahead of known high-traffic events (sales, launches, exam results) rather than assuming existing headroom will be enough.
- Document and review target headroom levels per system based on business criticality, rather than applying one blanket number everywhere.
16.2 Common Mistakes
- Confusing “server is up” with “server has headroom” — a server can be technically running while completely out of usable capacity.
- Forgetting that redundancy (multiple servers) is not the same as headroom (spare capacity) — you can have five servers and still have zero headroom if all five are maxed out.
- Not accounting for the time auto-scaling takes to react, leaving a dangerous gap during the first moments of a spike.
- Measuring only averages instead of percentiles, hiding dangerous short bursts within a “healthy-looking” daily average.
- Assuming headroom calculated once during launch remains valid forever, without revisiting it as user growth continues.
How Different Industries Live With Headroom
Different industries have different failure modes, and their headroom strategies are shaped accordingly. A quick tour of five very different production contexts, followed by a full worked case study.
E-commerce Flash Sales
Large e-commerce platforms running major sale events typically run dedicated pre-event load tests simulating many times their normal peak traffic, and temporarily scale infrastructure well beyond everyday needs, specifically to guarantee sufficient headroom during the narrow, extremely high-traffic sale window.
Streaming Platforms
Video streaming services provision regional edge server capacity with significant headroom above typical evening peak viewership, because a popular live event or a new season release can spike demand sharply within minutes, and buffering or failed streams during a big moment directly damages subscriber trust.
Ticket-Booking Systems
Ticket-booking platforms for concerts or exams face one of the hardest headroom problems: near-zero traffic most of the time, followed by an extreme, instantaneous spike the second bookings open. Many such systems use virtual waiting rooms and queueing mechanisms specifically to control the rate of requests entering the core booking system, keeping it within its safe headroom limits rather than letting the full spike hit at once.
Banking & Payment Systems
Payment processors maintain very conservative headroom targets and extensive redundancy (often N+2 or higher) because a payment outage has immediate, direct financial and regulatory consequences, and traffic can spike unpredictably around salary days, festival shopping periods, or bill-payment deadlines.
Government & Public Portals
Public exam-result portals and government service websites in India and elsewhere have repeatedly experienced high-profile outages when millions of citizens attempt to access a system within the same few minutes — a well-documented real-world illustration of what happens when peak-load headroom planning is underestimated relative to a system’s normal, everyday traffic pattern.
17.6 Worked Case Study: A Festival Sale Gone Wrong (and Right)
To bring every idea in this guide together, let us walk through a realistic, simplified case study of an online retailer preparing for a major festival sale.
The Setup
The retailer’s normal daily peak traffic is 2,000 orders per hour. Their current infrastructure was load tested six months ago and found to safely handle 3,000 orders per hour before checkout latency crosses the acceptable threshold. That gives them a comfortable-looking headroom of roughly 33% on a normal day.
The Mistake (First Attempt)
Marketing announces a festival sale expected to draw five times normal traffic — roughly 10,000 orders per hour at peak. The engineering team looks at their “33% headroom” number from six months ago and assumes they are fine, without re-testing. On sale day, checkout traffic hits 9,800 orders per hour within the first ten minutes. The database connection pool, unnoticed in the earlier calculation, was sized for 3,000 orders per hour and becomes fully saturated at roughly 4,500 orders per hour — far below the compute layer’s actual ceiling. Checkout times balloon from 300ms to over 8 seconds, and a large share of customers abandon their carts, resulting in a very public and costly outage.
What Went Wrong
Three classic mistakes from earlier sections of this guide combined here: the team measured headroom against an old, average-load baseline rather than the newly forecasted peak; they looked only at compute headroom and missed that the database connection pool was the true binding constraint; and they did not re-run load tests before a known high-stakes event, relying instead on a stale six-month-old number.
The Fix (Second Attempt, Next Year)
The following year, ahead of the same festival, the team follows the full capacity planning lifecycle from Chapter 6: they measure current baseline load, forecast the expected 5x spike based on marketing’s confirmed campaign plans, and run a fresh load test simulating 10,000 orders per hour end-to-end, including the database and third-party payment gateway. The test reveals the database connection pool as the binding constraint at just 45% of the required peak. They increase the connection pool size, add a read replica for non-critical read queries, introduce a Redis cache in front of the product catalog to remove a large share of read load from the database entirely, and configure auto-scaling on the application tier with a lower CPU threshold to react earlier. On sale day, checkout latency stays under 400ms throughout the peak, and the retailer processes the sale without incident.

The Questions People Ask Most
A quick round of the questions that come up most often about capacity headroom — in interviews, in post-mortems, and in cost-review meetings.
Is capacity headroom the same as redundancy?
No. Redundancy means having multiple copies of a component so that one failing does not take down the whole system. Headroom means having spare, unused capacity within those components. You can have high redundancy (many servers) but zero headroom (all of them running at 100%), and the system will still fail under any additional load or any single failure.
What is a “healthy” amount of headroom?
There is no single universal number. It depends on how critical the system is and how unpredictable its traffic is. Many teams target roughly 30–40% headroom at expected peak load for important production systems, with higher targets for extremely spike-prone or business-critical systems, and lower targets acceptable for internal, low-stakes tools.
Does auto-scaling remove the need to think about headroom?
No. Auto-scaling automates how headroom is added, but a small static buffer is still needed to survive the delay between a sudden spike starting and new capacity finishing its scale-out, since booting and warming up new instances is not instantaneous.
How do I find my system’s maximum safe capacity?
Through controlled load testing: gradually increasing simulated traffic against a test environment (ideally matching production) until a defined performance target is violated (like response time or error rate crossing an agreed threshold), and recording the load level just before that violation occurs.
Can a system have too much headroom?
Yes. Extremely high, permanent headroom usually means significant wasted infrastructure spend on capacity that is almost never used. The goal is a deliberate, justified amount of headroom matched to actual risk and criticality — not the maximum possible amount.
What is the difference between headroom and scalability?
Headroom is the spare capacity available right now, within the current setup. Scalability is the system’s ability to grow its capacity over time (by adding servers, sharding a database, and so on) when current headroom is no longer enough. A system can have good scalability but poor headroom at this exact moment if it has not yet been scaled up to meet recent growth.
How often should headroom be recalculated?
As a general guideline, teams should review headroom continuously through dashboards and alerts, but formally recalculate maximum safe capacity through fresh load testing whenever there is a significant code change, a significant infrastructure change, sustained user growth over a few months, or ahead of any known high-traffic event. A number that was accurate at launch can become dangerously wrong within a single year of steady growth.
Is capacity headroom only relevant for large-scale systems?
No. Even a small internal tool used by 20 employees benefits from basic headroom awareness — for example, making sure a shared reporting database is not so close to its connection limit that a single busy morning causes it to fail. The scale of the numbers changes, but the underlying discipline of measuring spare capacity against real peak demand applies at every scale.
How does capacity headroom relate to cost optimization efforts?
They sit on opposite ends of the same lever. Cost optimization often pushes utilization higher to reduce idle spend, while reliability goals push utilization lower to keep more headroom in reserve. Mature organizations resolve this not by picking one side permanently, but by setting a deliberate target utilization band per system based on its criticality, and using automation like auto-scaling to stay within that band efficiently rather than guessing.
What role do SLAs and SLOs play in setting headroom targets?
Service Level Agreements (SLAs) and Service Level Objectives (SLOs) define the performance and availability promises a system must keep — for example, “99.9% of requests complete within 500ms.” These targets directly inform how much headroom is required, since a stricter SLO leaves far less room for the kind of latency spikes that happen when a system runs close to its capacity limit.
Every Term, on One Page
A single reference table for the terms used throughout this guide — the vocabulary you will hear again and again in real capacity discussions.
| Term | Meaning in One Line |
|---|---|
| Capacity | The maximum load a system can handle while still meeting its performance targets. |
| Utilization | The percentage of capacity currently in use. |
| Headroom | The unused percentage of capacity, kept in reserve for spikes and failures. |
| Bottleneck / Binding Constraint | The single resource with the least headroom, which limits the whole system. |
| Peak Load | The highest level of traffic a system experiences, typically during a short window. |
| Elasticity | A system’s ability to automatically add or remove capacity based on real-time demand. |
| Auto-scaling | Automated infrastructure that adds or removes servers based on live utilization metrics. |
| Load Testing | Deliberately sending increasing simulated traffic to find a system’s true safe capacity. |
| N+1 Redundancy | Provisioning one extra unit of capacity beyond what is strictly needed, to survive one failure. |
| Cascading Failure | A chain reaction where one overloaded component pushes load onto others, collapsing the whole system. |
| Backpressure | Signaling upstream systems to slow down when a downstream system’s headroom is running low. |
| Graceful Degradation | Deliberately disabling non-essential features under load to preserve headroom for core functionality. |
| Saturation | How “full” a resource is — effectively the inverse of headroom, and one of Google’s four golden signals. |
What to Carry Forward
If there is one single idea worth carrying away from this entire guide, it is this: capacity headroom turns a system’s future problems into today’s manageable, plannable engineering work.
A system with healthy, well-monitored headroom does not need to be lucky to survive its busiest day — it has simply already done the measuring, the testing, and the planning long before that day arrives. The chapters above walked through what headroom is, how to calculate and forecast it, where it hides across every architectural layer, how it interacts with reliability, security, and cost, and how real organizations have both lost and won because of it. The following points distill the guide into a short, memorable checklist.
Key Takeaways
- Capacity headroom is the spare, unused capacity between current load and a system’s maximum safe capacity, usually expressed as a percentage.
- It exists because real-world traffic is never flat — it spikes daily, weekly, seasonally, and sometimes without any warning at all, and failures elsewhere in a system can suddenly redirect extra load onto healthy components.
- Headroom must be measured independently across every layer of a system — compute, network, database, caching, and queues — because the tightest one (the binding constraint) determines the real limit, regardless of how comfortable other resources look.
- Response time and error rates do not degrade gently as headroom shrinks — they stay flat for a long time and then rise sharply near the limit, which is why proactive monitoring and alerting matter far more than reactive firefighting.
- Headroom is a continuous cycle — measure, forecast, test, compare, scale, and monitor — not a one-time calculation made at launch and forgotten.
- Patterns like caching, auto-scaling, rate limiting, circuit breakers, load shedding, and graceful degradation are all, at their core, tools for creating, protecting, or intelligently using headroom.
- Headroom involves a genuine trade-off between infrastructure cost and business risk — the right target depends on how critical the system is and how unpredictable its traffic is, not a single universal rule.
- Real-world outages at e-commerce platforms, ticket-booking systems, streaming services, and government portals repeatedly trace back to the same root cause: insufficient headroom for a foreseeable peak.
Capacity headroom is the deliberate slack that turns tomorrow’s traffic surprise into today’s ordinary engineering task — measured across every layer, checked against real peak load, and reviewed as long as the system keeps running.
Design your systems so that their worst day is also, quietly, one of their most unremarkable ones — and the users on the other end will never need to know how much thought went into the calm they experienced.

