What Is Elasticity in Cloud Architecture?
A ground‑up, beginner‑friendly tour of how modern cloud systems automatically grow and shrink to match demand — covering history, internals, trade‑offs, patterns, and real production stories from companies like Netflix and Amazon.
Introduction & History
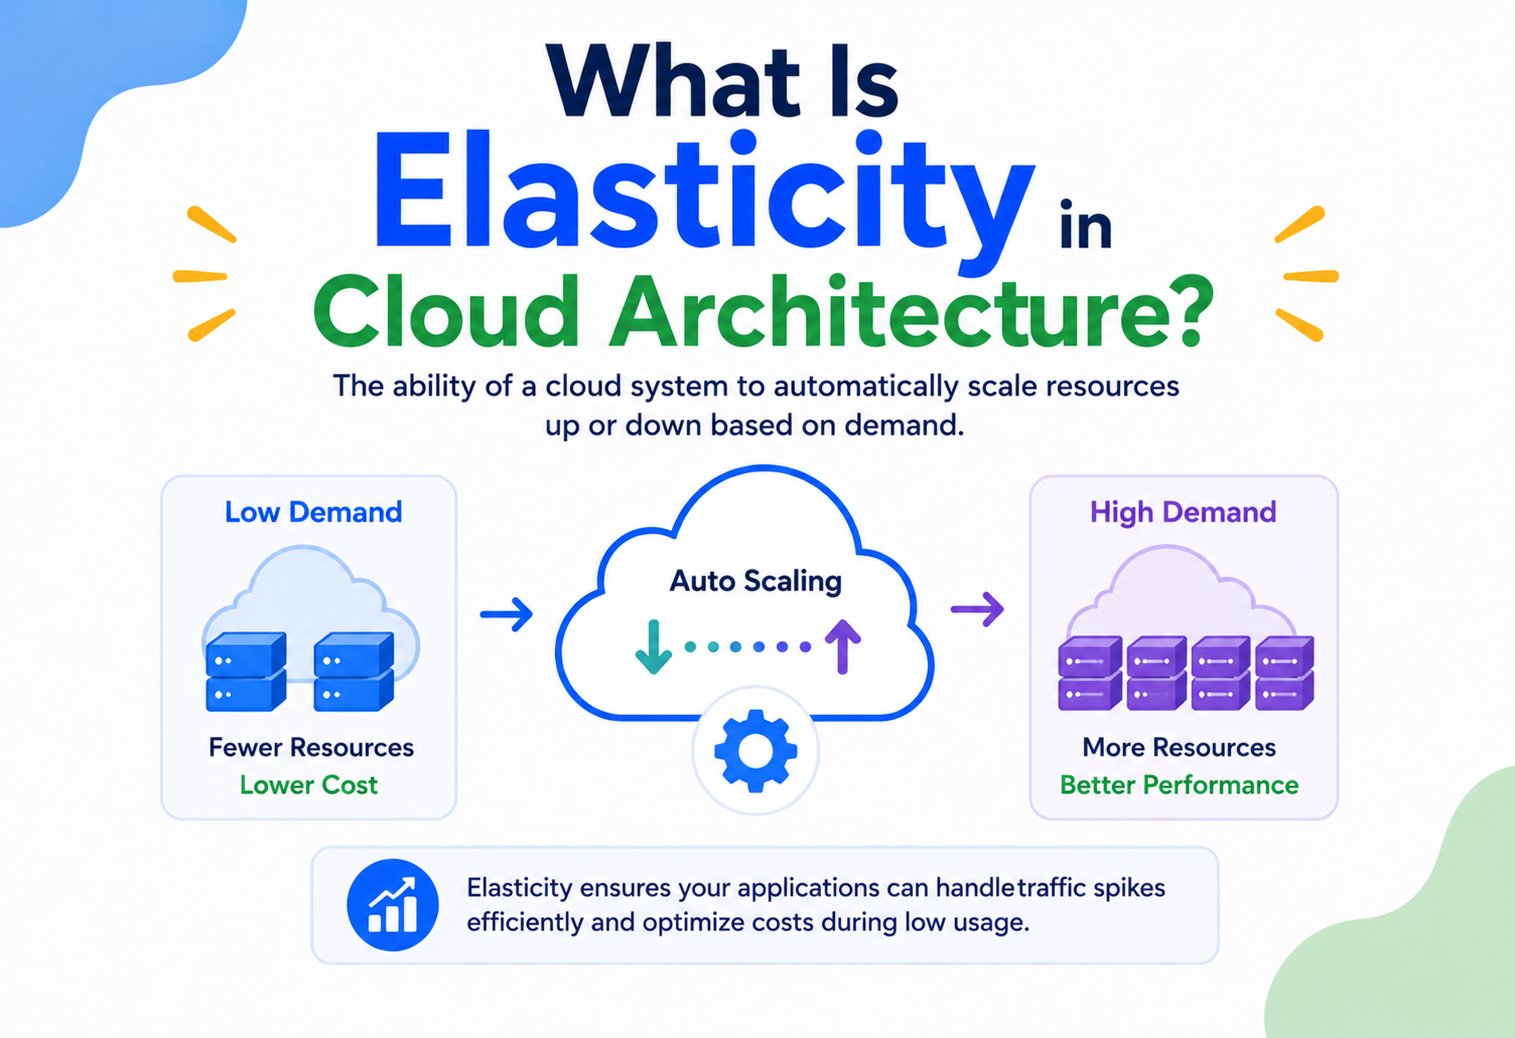
Imagine a rubber band. Pull it, and it stretches to fit whatever you’re wrapping. Let go, and it snaps back to its original size. Elasticity in cloud architecture works the same way — it’s the ability of a system to automatically stretch (add more computing power) when demand goes up, and shrink back (remove computing power) when demand goes down, without a human having to flip a switch.
Before the cloud existed, companies had to buy physical servers and put them in a room called a data center. If a shopping website expected a huge crowd on Black Friday, engineers had to guess how many servers they would need, buy them months in advance, and then watch most of those expensive machines sit mostly idle for the other 364 days of the year. Guess too low, and the website crashes under load. Guess too high, and the company wastes enormous amounts of money on hardware that just sits there humming in a rack, doing nothing useful.
The idea of elasticity grew out of a simple realisation: computing demand is almost never flat. It rises during the day and falls at night. It spikes during sales events and drops during quiet periods. It grows over the years as a business succeeds. What businesses needed was a way to pay for computing the way they pay for electricity — use more, pay more; use less, pay less — instead of buying a fixed amount of capacity up front and hoping it was the right amount.
1.1 A short timeline of how we got here
In the early 2000s, companies like Amazon were running enormous fleets of servers to handle their own retail business. Amazon’s engineers noticed that most of their computing capacity was wasted most of the time, and they built internal tools to slice up that spare capacity and rent it to outsiders. That effort became Amazon Web Services (AWS), launched publicly around 2006. Google and Microsoft followed with their own clouds (Google Cloud Platform and Microsoft Azure), and a whole industry was born around the idea of renting computing power instead of owning it.
At first, “cloud computing” mostly meant renting a virtual server instead of buying a physical one — you still had to decide how many servers you needed and turn them on and off yourself. True elasticity — where the system watches demand and adjusts capacity automatically, in real time, without a human in the loop — matured over the following decade through technologies like auto‑scaling groups, container orchestration (Kubernetes), and serverless computing (AWS Lambda, launched in 2014). Today, elasticity is considered one of the defining, must‑have characteristics of any system that calls itself “cloud‑native.”
- Pre‑2000sPhysical servers bought years in advance; capacity is a one‑time, high‑stakes guess. Over‑provisioning wastes money, under‑provisioning crashes the site.
- Early 2000sAmazon notices most of its retail fleet is idle most of the time and starts building internal tooling to rent out spare capacity.
- 2006AWS launches publicly; renting virtual servers by the hour becomes a real business model, though scaling is still mostly manual.
- 2011NIST publishes its widely cited cloud definition, formally listing “rapid elasticity” as one of the five essential characteristics of cloud computing.
- 2014AWS Lambda launches; serverless computing pushes elasticity to its extreme — scale from zero to thousands of executions in seconds.
- Mid‑2010s onwardKubernetes’ Horizontal Pod Autoscaler, managed elastic databases (Aurora Serverless, DynamoDB) and predictive auto‑scaling turn elasticity from a novelty into an assumed baseline.
It’s worth pausing on why this idea felt so radical when it first appeared. For decades, buying computing power was treated like buying a building: a large, slow, up‑front investment that you lived with for years. Elasticity reframed computing power as something closer to a utility, like water or electricity, that flows in and out based on what you’re actually doing right now. This single shift in thinking is arguably the most important economic change the cloud brought to the software industry — it changed computing from a capital expense (buy once, own forever) into an operating expense (pay for what you use, adjust anytime).
NIST (the U.S. National Institute of Standards and Technology), in its widely referenced definition of cloud computing published around 2011, listed “rapid elasticity” as one of the five essential characteristics that separates cloud computing from ordinary hosted computing. The other four — on‑demand self‑service, broad network access, resource pooling, and measured service — all support elasticity in some way: you need self‑service to request resources instantly, pooled resources to have spare capacity to draw from, and measured service to know exactly how much you’re using and be billed accordingly. Elasticity doesn’t stand alone; it’s the payoff that all the other cloud characteristics are built to support.
Problem & Motivation
Why did engineers need to invent elasticity at all? Let’s walk through the problem it solves using a simple story.
Picture an online ticket‑selling website for concerts. Most days, maybe 1,000 people visit the site per hour. But the moment tickets for a wildly popular artist go on sale, 500,000 people might try to visit within the same ten minutes. If the website’s servers were sized only for the normal 1,000‑visitors‑per‑hour traffic, the site would slow to a crawl or crash entirely right when it matters most — costing the company sales, reputation, and angry customers.
The old‑school fix was over‑provisioning: buy enough servers to survive the worst‑case spike, all year round. But that means for 364 days of the year, 95% of those expensive servers are sitting idle, burning electricity and money for nothing. This is like buying a 50‑seat bus to drive yourself to work every day, just in case you might one day need to carpool 49 friends.
Without elasticity
- Must guess peak demand months in advance
- Pay for idle capacity most of the time
- Still risk crashing if the guess is wrong
- Scaling up takes weeks (ordering, installing hardware)
With elasticity
- Capacity tracks real, live demand automatically
- Pay roughly for what you actually use
- System adds capacity in seconds to minutes
- Human engineers focus on features, not capacity guesswork
Elasticity solves this by turning capacity planning from a one‑time, high‑stakes guess into a continuous, automated, low‑stakes adjustment. The system constantly asks: “How busy am I right now, and do I have the right amount of resources for that?” — and answers that question itself, dozens of times per hour if needed.
2.1 The two failure modes elasticity is designed to prevent
Every capacity planning decision, at its heart, is trying to avoid two opposite failures, and elasticity is the tool that lets you avoid both at once instead of picking one:
- Under‑provisioning: not enough capacity for the actual demand. Symptoms include slow page loads, timeouts, error pages, and — in the worst case — a total outage right when the most people are trying to use the product. This is the more visible, more embarrassing failure, and it’s the one that makes headlines.
- Over‑provisioning: more capacity sitting around than is ever actually used. Symptoms are quieter — no crashes, no angry customers — but the cost shows up every month on the bill, and it compounds over years into a huge amount of wasted spending that could have funded new features, hiring, or lower prices.
A fixed‑capacity system forces you to pick a single point somewhere between these two failure modes and hope it’s close enough, all the time. Elasticity removes the need to pick a single point at all — the system continuously re‑picks the right point as reality changes.
2.2 Why “just add more servers manually” doesn’t scale as a strategy
A reasonable question is: why not just have an engineer watch a dashboard and manually turn servers on and off? In small startups, this genuinely is how things start. But it breaks down for a few concrete reasons: demand spikes can happen at 3 AM when no one is watching; a human reacting to a dashboard is inherently slower than software reacting to the same data; manual scaling doesn’t happen fast enough for spikes that build in minutes, not hours; and as a business grows to dozens or hundreds of services, no team of humans can watch every dashboard for every service around the clock. Automating the watching‑and‑reacting loop is what turns “scaling” into “elasticity.”
Core Concepts
Before going further, let’s build a vocabulary. Each of these terms will come up again and again, so we’ll explain each one simply, with an everyday analogy.
3.1 Elasticity vs. Scalability
These two words are often confused, but they mean different things.
- Scalability is a system’s ability to handle growth — can it keep working well if you give it 10x more traffic or data, whether by adding more machines or bigger machines? Think of scalability as the ceiling: how big can this system grow at all?
- Elasticity is about the system automatically moving up and down that ceiling in response to real‑time demand, and doing it quickly. Think of elasticity as a thermostat: not just “can the room get hot or cold,” but “does something automatically adjust the temperature as conditions change.”
3.2 Horizontal vs. vertical scaling
Vertical scaling (also called “scaling up”) means making a single machine more powerful — giving it more CPU, more memory, a faster disk. It’s like replacing a small delivery van with a giant truck. There’s a limit to how big one truck can get, and swapping trucks usually means stopping the delivery for a while.
Horizontal scaling (also called “scaling out”) means adding more machines that share the work, instead of making one machine bigger. It’s like adding more delivery vans to your fleet instead of buying one giant truck. This approach scales much further and lets you add or remove vans without stopping the whole delivery operation. Most modern elastic cloud systems rely primarily on horizontal scaling because it can be automated cleanly — you just add or remove identical, replaceable units.
3.3 Reactive vs. predictive (proactive) elasticity
- Reactive elasticity watches a live metric (like CPU usage) and scales after it crosses a threshold. Simple, but there’s a short lag between “demand rises” and “capacity catches up.”
- Predictive elasticity uses historical patterns or machine learning to scale ahead of time — for example, adding servers at 8:55 AM because traffic always spikes at 9:00 AM on weekdays.
3.4 Elastic capacity vs. elastic cost
Elasticity isn’t just about handling more users — it’s equally about shrinking capacity (and cost) when demand drops. A system that only scales up but never scales back down isn’t truly elastic; it’s just “growable,” and it will slowly become as wasteful as the old fixed‑capacity data centers it was meant to replace.
3.5 Elasticity of what, exactly?
People often talk about elasticity as if it only applies to servers, but the same idea shows up at several different layers of a system, each with its own knobs:
- Compute elasticity: the number of running instances, containers, or function invocations — the most common and most automated form.
- Storage elasticity: object storage systems (like Amazon S3) and some databases automatically grow their storage footprint as more data is written, with no manual disk resizing required.
- Network elasticity: bandwidth and connection‑handling capacity on load balancers and gateways expanding to absorb more simultaneous traffic.
- Database throughput elasticity: the number of reads/writes per second a data layer can sustain, which some managed database products can now adjust automatically as well.
A fully elastic architecture usually needs elasticity working at more than one of these layers at once — scaling the web tier alone doesn’t help if the database or network in front of it becomes the new bottleneck the moment traffic doubles.
3.6 Key terms glossary
Instance
One running copy of your application — a virtual server, container, or serverless function invocation.
Auto Scaling Group (ASG)
A managed pool of identical instances that a cloud provider automatically grows or shrinks.
Scaling Policy
The rule that says when and how much to scale — e.g., “add 2 instances if average CPU > 70% for 3 minutes.”
Cooldown Period
A short pause after a scaling action, so the system doesn’t overreact and scale again before the last change takes effect.
Load Balancer
A traffic cop that spreads incoming requests evenly across all currently running instances.
Serverless
A model where you never manage servers at all — the cloud provider runs your code only when needed and scales it invisibly.
Architecture & Components
An elastic system isn’t one single tool — it’s a small ecosystem of cooperating pieces. Let’s look at the typical building blocks found in almost every elastic cloud architecture.
Fig 4.1 · a small ecosystem of cooperating pieces — load balancer, compute pool, metrics, engine, provisioning.
4.1 Compute pool (the workers)
This is the set of interchangeable units doing the actual work — virtual machines, containers, or serverless function instances. They must be stateless (not storing important data only on themselves) so that any one of them can be added or removed without losing information.
4.2 Load balancer
Sits in front of the compute pool and distributes incoming requests across all healthy instances. When new instances appear, the load balancer starts sending them traffic; when instances are removed, it stops sending them traffic and waits for in‑flight requests to finish (a process called “draining”).
4.3 Metrics collector / monitoring system
Continuously measures signals like CPU usage, memory usage, request rate, queue length, or response latency across all instances.
4.4 Auto‑scaling engine / controller
The “brain.” It compares live metrics against scaling policies and decides: do we need more capacity, less capacity, or is the current amount fine? Examples include AWS Auto Scaling, Kubernetes’ Horizontal Pod Autoscaler (HPA), and Google Cloud’s Managed Instance Groups.
4.5 Provisioning layer
The mechanism that actually creates or destroys resources — booting a new virtual machine, scheduling a new container onto a cluster node, or spinning up a serverless execution environment.
4.6 Shared state / external data layer
Because compute instances are disposable, anything that must persist (user sessions, uploaded files, database records) lives outside the compute pool — in a database, cache, or object storage system that itself is designed to survive instances coming and going.
4.7 Configuration and service discovery
New instances need to know things like which database to connect to, which feature flags are active, and where their sibling services live on the network. Elastic architectures externalise this configuration into a shared configuration store or service registry, so a freshly created instance can look up everything it needs the moment it boots, rather than having that information hard‑coded into a fixed, unchanging fleet.
Internal Working
Let’s zoom into exactly how an auto‑scaling decision gets made, step by step, using a typical “scale out” (add capacity) scenario.
- 1
Metrics are gathered
Every instance reports metrics (e.g., CPU %) every 10–60 seconds to a central monitoring system.
- 2
Metrics are aggregated
The monitoring system computes an average or percentile across all instances over a sliding time window (e.g., “average CPU over the last 3 minutes”).
- 3
Policy evaluation
The auto‑scaling engine checks the aggregated metric against the configured threshold — e.g., “is average CPU > 70%?”
- 4
Decision & cooldown check
If the threshold is breached and the system isn’t inside a cooldown period from a previous scaling action, a scaling decision is triggered.
- 5
Provisioning
New instances are requested — a virtual machine boots, a container image is pulled and started, or a serverless environment is initialised.
- 6
Health check & registration
The new instance must pass a health check (respond correctly to a test request) before the load balancer starts sending it real traffic.
- 7
Traffic rebalancing
The load balancer begins spreading requests across the larger pool, easing pressure on the existing instances.
- 8
Cooldown begins
The system waits a short period before evaluating again, to avoid rapid, jittery back‑and‑forth scaling.
Scaling in (removing capacity) follows a mirror‑image process, but with one extra careful step: connection draining. Before an instance is terminated, the load balancer stops sending it new requests but lets it finish any requests already in progress, so no user sees an error mid‑request.
5.1 Why cooldown periods exist
Imagine a system scales out because CPU hit 75%. The moment the new instances come online and traffic spreads across a bigger pool, average CPU might immediately drop to 40% — well below the scale‑out threshold, but also below the scale‑in threshold. Without a pause, the system could over‑react and start removing instances again right away, even though the underlying demand hasn’t actually changed, just the very first measurement after scaling. The cooldown period exists precisely to give the system a moment to stabilise and get an honest read of the new normal before making another decision, which is what prevents the rapid up‑down “flapping” behaviour described later in this guide.
5.2 A minimal Java example: a simple threshold‑based scaling decision
Real cloud auto‑scalers are far more sophisticated, but this tiny example shows the core logic in plain code.
public class SimpleAutoScaler {

    private static final double SCALE_OUT_CPU_THRESHOLD = 70.0; // percent
    private static final double SCALE_IN_CPU_THRESHOLD  = 30.0; // percent
    private static final int MIN_INSTANCES = 2;
    private static final int MAX_INSTANCES = 20;

    private int currentInstances = MIN_INSTANCES;

    /**
     * Decide whether to scale out, scale in, or hold steady,
     * based on the average CPU usage across the current fleet.
     */
    public void evaluate(double averageCpuPercent) {
        if (averageCpuPercent > SCALE_OUT_CPU_THRESHOLD && currentInstances < MAX_INSTANCES) {
            int newCount = Math.min(currentInstances + 2, MAX_INSTANCES);
            System.out.printf("Scaling OUT: %d -> %d instances (CPU=%.1f%%)%n",
                    currentInstances, newCount, averageCpuPercent);
            currentInstances = newCount;
        } else if (averageCpuPercent < SCALE_IN_CPU_THRESHOLD && currentInstances > MIN_INSTANCES) {
            int newCount = Math.max(currentInstances - 1, MIN_INSTANCES);
            System.out.printf("Scaling IN: %d -> %d instances (CPU=%.1f%%)%n",
                    currentInstances, newCount, averageCpuPercent);
            currentInstances = newCount;
        } else {
            System.out.printf("Holding steady at %d instances (CPU=%.1f%%)%n",
                    currentInstances, averageCpuPercent);
        }
    }
}
This tiny class captures the essence of every real auto‑scaler: a metric comes in, it’s compared against thresholds, and the instance count moves up or down within safe minimum/maximum bounds.
Data Flow & Lifecycle
Let’s trace a single user’s request through an elastic system, and separately trace the lifecycle of one compute instance from birth to death.
6.1 Request lifecycle
Fig 6.1 · every hop is stateless — any healthy instance could have served this request.
6.2 Instance lifecycle
- 1
Requested
Auto‑scaling engine decides more capacity is needed and requests a new instance.
- 2
Provisioning
Underlying infrastructure allocates CPU/memory and boots the instance or container.
- 3
Bootstrapping
Application code, configuration, and dependencies load; the instance connects to shared services (database, cache, config store).
- 4
Healthy & in‑service
Passes health checks; load balancer starts routing real traffic to it.
- 5
Serving traffic
Handles requests alongside its siblings for as long as it’s needed.
- 6
Marked for removal
Scale‑in decision selects this instance (often the oldest, or one on a machine being reclaimed).
- 7
Draining
Load balancer stops sending new requests; in‑flight requests are allowed to finish.
- 8
Terminated
Instance is shut down and its resources are released back to the shared pool.
Advantages, Disadvantages & Trade-offs
Advantages
- Cost efficiency — pay closer to actual usage instead of worst‑case peak
- Resilience to unexpected traffic spikes (viral posts, flash sales)
- Less manual capacity planning for engineers
- Better resource utilisation across the whole cloud provider’s hardware
- Faster response to growth — no waiting weeks for new hardware
Disadvantages / trade‑offs
- Added architectural complexity (state management, health checks, coordination)
- Scaling has a delay — it’s not instantaneous, so very sudden spikes can still cause brief slowdowns
- Poorly tuned policies cause “flapping” — scaling up and down repeatedly
- Harder to predict exact monthly cost compared to a fixed number of servers
- Not every workload benefits — some steady, predictable systems gain little from elasticity
The core trade‑off is simplicity versus efficiency. A fixed‑capacity system is simple to reason about but wasteful or risky. An elastic system is efficient and resilient but requires more careful design, more moving parts, and more testing (what happens if scaling fails, or scales the wrong way?).
There’s also a subtler trade‑off around predictability. A fixed‑capacity system gives you a bill you can predict to the dollar every month, which finance teams love. An elastic system’s bill moves with usage, which is fairer and often cheaper on average, but requires budgeting for a range rather than a fixed number, and demands cost monitoring so a runaway scaling event (from a bug, a traffic spike, or an attack) doesn’t turn into a surprising invoice at the end of the month. Many teams address this by setting hard maximum caps and billing alerts as a safety net, accepting slightly less theoretical elasticity in exchange for predictable worst‑case cost.
“Elasticity trades a one‑time, high‑stakes guess for a continuous, low‑stakes, automated adjustment — at the cost of added system complexity.”
Performance & Scalability
Elasticity and performance are closely linked but not identical. Performance is about how fast the system responds; elasticity is about making sure there’s enough capacity to keep performance good as load changes.
8.1 Key performance signals used to drive scaling
| Metric | What it means | Good for scaling on |
|---|---|---|
| CPU utilisation | How busy the processor is | Compute‑heavy workloads |
| Memory utilisation | How much RAM is used | Memory‑heavy workloads (caches, in‑memory processing) |
| Request rate (RPS) | Requests handled per second | Web / API traffic‑driven services |
| Queue length | Pending jobs waiting to be processed | Background job / message processing systems |
| P95/P99 latency | How slow the slowest 5%/1% of requests are | User‑experience‑sensitive services |
8.2 Scalability patterns that make elasticity possible
- Statelessness: instances hold no unique, unrecoverable data, so any instance can serve any request.
- Idempotency: repeating the same request twice (e.g., due to a retry after a scale‑in event) produces the same safe result.
- Partitioning / sharding: splitting data or work into independent pieces so more workers can process pieces in parallel.
- Asynchronous processing: using queues so spikes in incoming work are buffered instead of directly overwhelming compute.
8.3 The scaling lag, and why it matters
No elastic system reacts instantly — there’s always a gap between “demand rises” and “capacity catches up,” made up of several smaller delays stacked together: the time to notice the metric crossed a threshold, the time to make the scaling decision, the time to provision a new instance, and the time for that instance to finish starting up and pass its health check. For a virtual machine, this whole chain might take two to five minutes. For a container joining an already‑running cluster, it might take ten to thirty seconds. For a serverless function, it can be near‑instant, or it can include a “cold start” delay while the platform initialises a fresh execution environment.
This lag is exactly why predictive elasticity and generous minimum‑capacity buffers matter for latency‑sensitive systems: if your traffic can double in thirty seconds but your system takes three minutes to add capacity, users will feel that gap as real slowness, no matter how good your auto‑scaling configuration looks on paper.
8.4 Little’s Law: a simple way to reason about capacity
A useful, very old piece of math called Little’s Law helps connect load, latency, and required capacity: the average number of requests being processed in a system at any moment equals the average arrival rate of requests multiplied by the average time each request takes to complete. In plain terms — if requests start taking longer to process (maybe because a downstream service is struggling), the number of requests “in flight” at once climbs even if the arrival rate stays the same, which is often the real trigger for a scale‑out event, not just raw traffic volume. This is one reason experienced engineers watch latency and in‑flight request counts, not just CPU, when tuning elasticity.
8.5 Vertical limits versus horizontal headroom
Vertical scaling always eventually hits a wall — there’s a biggest virtual machine your cloud provider sells, and even that machine has a ceiling on memory bandwidth, network throughput, and disk I/O. Horizontal scaling, by contrast, has headroom that’s limited mainly by how well your architecture partitions work across independent units, and by the practical limits of coordination (databases, shared caches, and networks eventually become the bottleneck instead of any single machine). This is why elastic architectures nearly always lean on horizontal scaling as the primary lever, reserving vertical scaling for occasional, deliberate resizing rather than moment‑to‑moment elasticity.
High Availability & Reliability
High availability (HA) means the system keeps working correctly even when parts of it fail. Elasticity and HA reinforce each other: an elastic system naturally replaces unhealthy instances with new healthy ones, which is a form of self‑healing.
9.1 How elasticity contributes to reliability
- Self‑healing: if an instance fails a health check, the auto‑scaling system can terminate it and launch a replacement automatically.
- Spreading across zones: elastic instances are usually distributed across multiple data centers (“availability zones”) so a single zone outage doesn’t take the whole system down.
- Graceful degradation: if scaling can’t keep up momentarily, well‑designed systems shed non‑critical load (e.g., disable recommendations, keep checkout working) rather than crashing entirely.
Fig 9.1 · elasticity replaces bad instances; multi‑zone redundancy survives a whole‑zone outage.
9.2 The retry storm problem
One subtle reliability risk shows up when scaling can’t keep up and requests start timing out: client applications and services often automatically retry failed requests, which adds even more load onto an already‑struggling system, which causes more timeouts, which causes more retries — a vicious cycle sometimes called a “retry storm.” Well‑designed elastic systems defend against this with techniques like exponential backoff (waiting progressively longer between retries) and circuit breakers (temporarily refusing to send more requests to an overloaded dependency at all), so a temporary capacity shortfall doesn’t spiral into a full outage.
9.3 Testing reliability on purpose
Some organisations go further than just hoping their self‑healing works, and deliberately test it — a practice broadly known as chaos engineering. This means intentionally terminating healthy instances, introducing artificial latency, or simulating an availability zone outage in a controlled way, then confirming that the elastic system detects the problem and recovers within an acceptable time, without a human needing to intervene. Finding these gaps during a planned daytime test is far cheaper than discovering them during a real 3 AM outage.
Security
Elastic systems introduce security considerations that fixed systems don’t have to worry about as much, because instances are constantly being created and destroyed.
- Secure bootstrapping: new instances must automatically get credentials and secrets safely (e.g., from a secrets manager) rather than having them baked permanently into images.
- Consistent hardening: every new instance must launch from a secure, patched base image — otherwise auto‑scaling can quietly multiply an old vulnerability across dozens of new instances.
- Network segmentation: newly created instances should automatically join the correct security groups / firewall rules, never defaulting to overly open access.
- Ephemeral credential scope: because instances are short‑lived, credentials issued to them should also be short‑lived and automatically revoked on termination.
- Scaling abuse / cost attacks: attackers can sometimes intentionally trigger excessive traffic to force costly over‑scaling (“economic denial of sustainability”); rate limiting and maximum scaling caps help defend against this.
10.1 Immutable infrastructure as a security habit
A widely recommended practice for elastic systems is immutable infrastructure: rather than logging into a running instance to patch or fix it, you build a new, updated base image (sometimes called a “golden image”), test it, and let the auto‑scaler gradually replace old instances with new ones built from that image. Old instances are never modified in place — only ever replaced. This closes off a whole category of security drift, where manually‑patched servers slowly diverge from one another until nobody is quite sure what’s actually running in production.
10.2 Cost as a security surface
It’s easy to think of security only in terms of data breaches, but an elastic system’s willingness to automatically add capacity is itself something that needs protecting. If an API endpoint is left unauthenticated and expensive to compute, an attacker (or simply a misbehaving script) can drive it hard enough to trigger large, costly scale‑out events purely to run up a victim’s cloud bill. Rate limiting, authentication on expensive endpoints, and hard maximum‑instance caps all act as guardrails against this kind of abuse.
Monitoring, Logging & Metrics
You cannot scale what you cannot see. Observability is the foundation elasticity is built on — without accurate, real‑time metrics, an auto‑scaler is flying blind.
11.1 The three pillars applied to elasticity
Metrics
Numeric time‑series data (CPU %, request rate, queue depth) — the direct fuel for scaling decisions.
Logs
Detailed event records used to diagnose why a scaling decision happened, or why an instance failed a health check.
Traces
End‑to‑end records of a single request’s journey — useful for spotting which service in a microservices chain is the real bottleneck causing scale‑out.
11.2 Alerts worth setting up
- Scaling events happening too frequently (“flapping”) in a short window
- Fleet size hitting its configured maximum (a sign your ceiling may be too low)
- Health checks failing at an unusually high rate for new instances (a sign of a bad deployment)
- Cost anomalies — spend rising much faster than traffic would explain
11.3 Dashboards that make elasticity visible
Beyond individual alerts, most teams running elastic systems keep a small set of always‑on dashboards, because scaling behaviour is much easier to understand as a picture over time than as a single number in the moment. A typical dashboard overlays instance count, the metric driving scaling (like CPU or request rate), and latency on the same timeline, so an engineer can visually confirm that instance count rose right as load rose, and that latency stayed flat because it did. If instance count rises but latency still spikes, that’s a strong clue the bottleneck isn’t compute at all — it’s likely a downstream dependency like a database or a third‑party API that elasticity in the compute layer can’t fix.
11.4 Logging scaling decisions themselves
It’s easy to log application events and forget to log the scaling system’s own decisions. Mature setups explicitly record every scale‑out and scale‑in event — what metric triggered it, what the value was, how many instances were added or removed, and how long provisioning took. This audit trail becomes invaluable later, both for debugging (“why did we scale to the maximum at 2 AM last Tuesday?”) and for tuning policies over time as traffic patterns evolve.
Deployment & Cloud
Different deployment models offer elasticity at different levels of granularity and different amounts of engineering effort.
| Model | What scales | Effort to manage | Example services |
|---|---|---|---|
| Virtual Machines | Whole VMs added/removed | Higher — you manage the OS | AWS EC2 Auto Scaling, Azure VM Scale Sets |
| Containers / Orchestration | Container replicas across a cluster | Medium | Kubernetes HPA, AWS ECS |
| Serverless Functions | Individual function invocations | Lowest — no servers to manage | AWS Lambda, Azure Functions, Google Cloud Functions |
| Managed Platforms (PaaS) | Application instances behind the scenes | Low | Google App Engine, Heroku |
Serverless computing represents the extreme end of elasticity: the platform can scale from zero running instances to thousands within seconds, and back to zero when idle, billing only for actual execution time. The trade‑off is less control over the runtime environment and, for some platforms, “cold start” delays when scaling up from zero.
12.1 Choosing a model for a given workload
A useful way to choose among these models is to ask how spiky and how latency‑sensitive the workload is. Steady, always‑on, latency‑critical workloads (like a core transaction‑processing service) often fit VMs or container orchestration well, where a comfortable baseline of always‑warm capacity avoids cold starts entirely. Spiky, unpredictable, event‑driven workloads (like resizing an uploaded image the moment a user submits it) are often a great fit for serverless functions, since paying nothing while idle matters more than shaving milliseconds off an occasional cold start. Many real systems end up as a deliberate mix: containers for the steady core, serverless for the bursty edges.
Databases, Caching & Load Balancing
Compute is usually the easiest part of a system to scale elastically, because instances are stateless and disposable. Data is the hard part, because data must persist even as the machines around it come and go.
13.1 Databases
- Read replicas: extra, synced copies of a database that can be added elastically to handle more read traffic, while writes still go to one primary.
- Sharding: splitting data across many database instances by some key (like user ID), so write capacity can also grow horizontally.
- Managed elastic databases: services like Amazon Aurora Serverless or DynamoDB automatically adjust their own capacity based on load, applying the elasticity concept to the data layer itself.
13.2 Caching
A cache (like Redis or Memcached) stores frequently requested data in fast memory so the database doesn’t get hit for every single request. Caching reduces the load elasticity has to handle in the first place — fewer requests reach the expensive database layer, so fewer database resources need to scale.
13.3 Load balancing
The load balancer is what makes elastic compute pools usable at all. As instances are added or removed, the load balancer updates its routing table continuously, using algorithms such as:
- Round robin: requests are sent to instances in rotating order.
- Least connections: requests go to whichever instance currently has the fewest active requests.
- Weighted / latency‑based: requests favour instances that have historically responded fastest.
13.4 Connection pooling and the database bottleneck
A subtle but very common trap: as compute elastically scales from, say, 5 instances to 50, and each instance opens its own pool of database connections, the database can suddenly face ten times as many concurrent connections even though the actual query volume grew more modestly. Databases have hard limits on concurrent connections, and exceeding them can cause errors even when the database’s raw processing capacity would have been fine. This is why elastic architectures typically place a connection pooler (like PgBouncer for PostgreSQL) between the elastic compute layer and the database, so a growing number of application instances can share a stable, bounded number of actual database connections.
13.5 Elastic caching layers
Caching systems themselves can be elastic. Distributed caches like Redis Cluster or Memcached pools can add more nodes as the amount of cached data or the read/write rate grows, using consistent hashing so that adding or removing a cache node only reshuffles a small fraction of the cached keys rather than invalidating the entire cache at once. This matters because a cache that has to “cold start” from empty every time it scales defeats much of the purpose of caching in the first place.
APIs & Microservices
Microservices architecture — breaking one big application into many small, independently deployable services — pairs naturally with elasticity, because each service can scale independently based on its own specific load.
Fig 14.1 · one busy feature no longer forces you to scale everything — only the hot service grows.
In a monolithic (single, large) application, one busy feature forces you to scale the entire application, even the parts that aren’t busy. With microservices, if only the “Search” feature is under heavy load, only the search service needs to scale — the payment service can stay small, saving significant cost.
This independence comes with a cost of its own: instead of tuning one scaling policy, a team now has to tune, monitor, and understand many — one per service — and needs to think about how services depend on each other, since scaling one service up faster than the services it calls can simply shift the bottleneck downstream instead of fixing it. An API gateway sitting in front of all the services is often where rate limiting and circuit breaking are applied, protecting slower‑to‑scale services from being overwhelmed by a faster‑scaling neighbour.
14.1 A small Java example: exposing a scale‑aware health endpoint
Auto‑scalers and load balancers rely on a health check endpoint to know an instance is ready for traffic. Here’s a minimal example using plain Java HTTP server code.
import com.sun.net.httpserver.HttpServer;
import java.net.InetSocketAddress;
import java.io.OutputStream;

public class HealthCheckServer {

    private static volatile boolean isReady = false;

    public static void main(String[] args) throws Exception {
        HttpServer server = HttpServer.create(new InetSocketAddress(8080), 0);

        server.createContext("/health", exchange -> {
            String response = isReady ? "OK" : "STARTING";
            int status = isReady ? 200 : 503; // 503 = not ready for traffic yet
            exchange.sendResponseHeaders(status, response.length());
            try (OutputStream os = exchange.getResponseBody()) {
                os.write(response.getBytes());
            }
        });

        server.start();
        System.out.println("Health server started, warming up...");

        // Simulate application warm-up (loading caches, connecting to DB, etc.)
        Thread.sleep(5000);
        isReady = true;
        System.out.println("Instance is now READY to receive traffic.");
    }
}
Until isReady becomes true, the load balancer will keep getting a 503 response and will not send real user traffic to this instance — this small pattern prevents half‑started instances from receiving requests they can’t yet handle correctly.
Design Patterns & Anti-patterns
15.1 Helpful patterns
Circuit Breaker
Temporarily stops calling a failing downstream service, preventing cascading overload while scaling catches up.
Bulkhead
Isolates resources per feature so one overloaded feature can’t starve capacity from the rest of the system.
Queue‑Based Load Levelling
Buffers sudden bursts in a message queue so backend workers can scale and process steadily instead of being overwhelmed instantly.
Sidecar
Attaches a helper process (e.g., for metrics collection) to each instance without duplicating that logic in the main app.
15.2 Predictive scaling in practice
Beyond reactive, threshold‑based scaling, many mature systems layer on a predictive component. This can be as simple as a scheduled rule (“always keep at least 20 instances running from 8:00 AM to 8:00 PM on weekdays, because that’s our known business‑hours pattern”), or as sophisticated as a machine‑learning model trained on months of historical traffic to forecast the next hour’s load and pre‑scale ahead of it. The goal of prediction isn’t to replace reactive scaling — it’s to remove the scaling lag for the traffic patterns you can already anticipate, while reactive scaling stays in place as a safety net for the traffic you can’t.
15.3 Anti‑patterns to avoid
Common anti‑patterns
- Sticky state: storing session data only in one instance’s memory
- No cooldown: scaling policies react so fast they flap up and down constantly
- Single metric tunnel vision: scaling only on CPU while ignoring memory or queue depth
- Unbounded scaling: no maximum cap, risking runaway cost from a bug or attack
- Slow bootstrapping: new instances take minutes to become useful, defeating the purpose of fast elasticity
Best Practices & Common Mistakes
- Always set both a minimum and maximum instance count — the minimum protects against cold‑start latency for the first user, the maximum protects your budget from runaway scaling.
- Use multiple metrics when one alone doesn’t capture real load (e.g., combine CPU and request queue depth).
- Design for fast startup — the faster an instance becomes healthy, the more responsive your elasticity is.
- Test scale‑in as thoroughly as scale‑out — many teams only test adding capacity and are surprised when removing it drops in‑flight requests.
- Load test regularly — deliberately simulate traffic spikes to confirm your scaling policies actually behave as expected.
- Separate stateless compute from stateful storage from day one, rather than retrofitting it later under pressure.
- Set sensible cooldown periods to prevent oscillation, but not so long that the system can’t respond to genuine sustained demand changes.
16.1 Reviewing policies as the business changes
Scaling policies tuned for a business’s traffic pattern a year ago can quietly become wrong as the product, user base, or usage pattern changes. A quarterly (or after any major traffic‑pattern shift) review of scaling thresholds, minimums, maximums, and cooldowns keeps the configuration honest, rather than letting it fossilise around assumptions that no longer hold.
Real-World / Industry Examples
Netflix
Netflix’s viewing traffic rises sharply every evening as people get home from work and settle in to watch shows, then falls off overnight. Netflix runs on AWS and uses extensive auto‑scaling across its microservices, adding thousands of instances during peak evening hours across time zones and scaling back down overnight, while also intentionally injecting failures (via their famous “Chaos Monkey” tooling) to make sure their elastic, self‑healing systems truly recover on their own.
Amazon.com
During events like Prime Day and Black Friday, Amazon’s retail traffic can be many times its normal level. Amazon’s own internal infrastructure (which grew into AWS) was built specifically to add massive temporary capacity for these predictable multi‑day spikes and release it immediately afterward — the original business case that proved elasticity’s value at scale.
Uber
Ride demand elastically spikes during rush hours, bad weather, and major events. Uber’s backend services scale independently — the trip‑matching service might scale far more aggressively than, say, the receipts/billing service, since the two experience very different demand shapes even at the same moment.
E‑commerce flash sale
A mid‑size online retailer launches a one‑day flash sale email to its list. Traffic jumps 40x within minutes of the email going out. An elastic architecture with auto‑scaling web servers, a queue‑buffered order processing pipeline, and a caching layer in front of the product database can absorb this spike, then scale back down that evening — something that would have required weeks of manual server procurement in the pre‑cloud era.
Tax filing & government services
Government tax‑filing websites in many countries see the overwhelming majority of their yearly traffic packed into just the final few days before a filing deadline, with near‑silence the rest of the year. This kind of extremely lopsided, predictable‑date demand curve is close to a textbook case for elasticity: rather than running deadline‑day capacity for 365 days a year, the system can scale dramatically upward for the handful of critical days and shrink back down immediately afterward, saving enormous amounts of public money in the process.
FAQ
Is elasticity the same as auto-scaling?
Auto‑scaling is the specific mechanism (the tool) that implements elasticity (the broader concept/property). Elasticity is the “what” — the system’s ability to adjust capacity — and auto‑scaling is one common “how.”
Does elasticity always save money?
Usually, but not automatically — poorly configured elasticity (no cooldowns, no maximums, scaling on the wrong metric) can actually cost more than a well‑sized fixed environment. Elasticity needs to be tuned, monitored, and periodically reviewed.
Can a database be elastic?
Yes, though it’s harder than scaling stateless compute, because data must be moved, replicated, or repartitioned safely. Managed serverless database products increasingly offer this out of the box.
What’s the difference between elasticity and resiliency?
Resiliency is about surviving failures; elasticity is about matching capacity to demand. They overlap (self‑healing is both), but a system can be elastic without being especially resilient, and vice versa.
Do small applications need elasticity?
Not always. If traffic is small and steady, a simple fixed‑size deployment may be perfectly fine and far simpler to operate. Elasticity earns its complexity when demand is variable or growth is uncertain.
What happens if the auto-scaler itself fails?
This is why sensible minimum instance counts matter — even if the scaling engine stops working entirely, a system configured with a safe minimum will keep running at that baseline capacity rather than dropping to zero. Well‑run teams also monitor the health of the scaling system itself, not just the application, since it’s a critical piece of infrastructure in its own right.
Can elasticity make a bad architecture good?
No. Elasticity multiplies whatever architecture you already have — it can turn a well‑designed, stateless, horizontally scalable system into an efficient, resilient one, but it will just as readily multiply a poorly designed system’s problems, spinning up many copies of the same bottleneck instead of fixing it. Elasticity is an amplifier, not a repair tool.
Is more elasticity always better?
Not necessarily. Extremely aggressive, fine‑grained scaling policies can introduce their own instability (flapping) and complexity without meaningfully improving cost or performance beyond a certain point. The right amount of elasticity is the amount that matches how variable your actual demand is — a system with genuinely flat, predictable traffic gets little benefit from highly reactive elasticity and may be better served by simpler, coarser scaling rules.
Summary & Key Takeaways
Elasticity is one of the defining superpowers of cloud computing: the ability for a system to automatically expand and contract its resources to closely track real, live demand — protecting both user experience and operating budget without requiring constant human intervention. It rewards architectures that embrace statelessness, external shared data, fast startup, and good observability, and it punishes architectures that don’t — which is exactly why so many of the best practices in modern cloud engineering (twelve‑factor apps, infrastructure as code, immutable deployments, microservices) trace back, directly or indirectly, to making elasticity work well.
Key takeaways
- 01 Elasticity = automatic, real‑time growing and shrinking of capacity, not just growing.
- 02 It’s different from scalability (the ceiling) — elasticity is the automated mechanism that moves you within that ceiling.
- 03 Built from a few core parts: compute pool, load balancer, metrics, auto‑scaling engine, and provisioning layer.
- 04 Requires stateless, disposable compute instances and durable, external data storage.
- 05 Brings major cost and resilience benefits, at the cost of added architectural complexity.
- 06 Works best combined with multi‑zone redundancy, careful monitoring, and well‑tuned scaling policies.
- 07 Applies beyond compute — to databases, caching layers, and individual microservices, each scaling to its own demand shape.
- 08 Real companies like Netflix, Amazon, and Uber rely on elasticity daily to handle predictable and unpredictable demand swings alike.