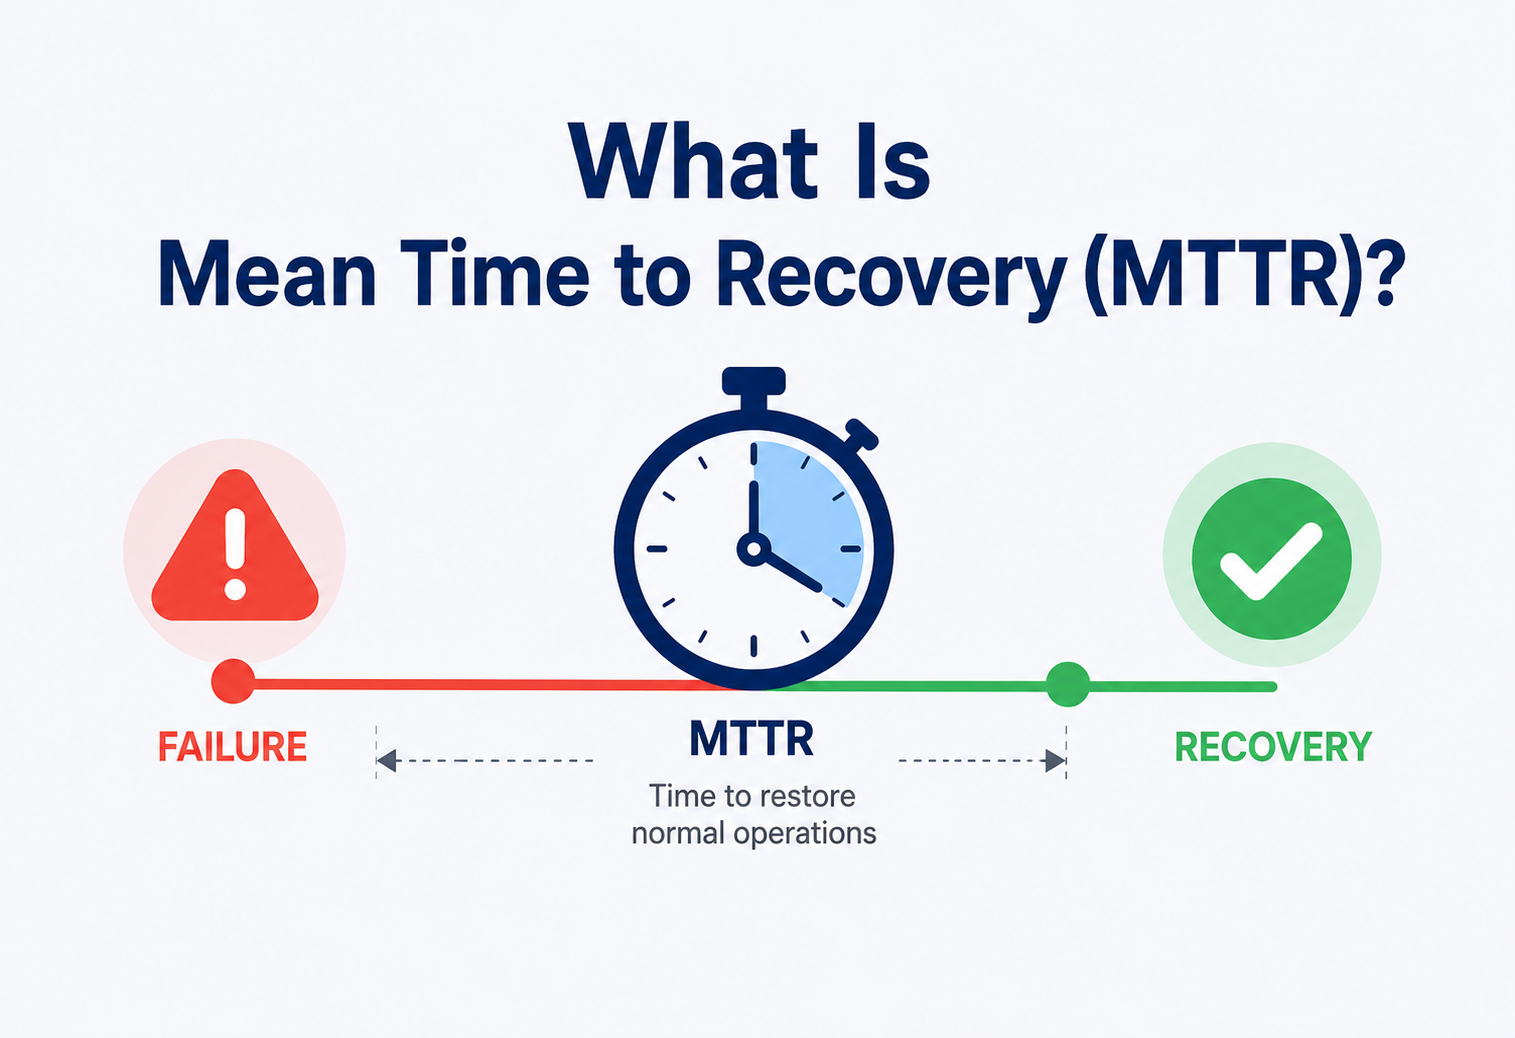
What Is Mean Time to Recovery?
A ground-up explanation of MTTR: what it actually measures, how it’s calculated, why it’s one of the most important — and most misunderstood — reliability metrics in engineering, and how real companies use it to build systems that fail gracefully and recover fast.
What Is Mean Time to Recovery?
Imagine your car breaks down on the highway. There are really two very different questions you could ask about that breakdown. The first is: “How often does this car break down?” The second is: “When it breaks down, how long until you’re back on the road?” Both questions matter, but they measure completely different things. Mean Time to Recovery (MTTR) is the engineering answer to the second question — and this guide is entirely about why that question turns out to be just as important, and sometimes more important, than the first.
1.1 What Does MTTR Actually Stand For?
MTTR is an acronym with an interesting quirk: it commonly stands for two different things, and even experienced engineers regularly mix them up.
- Mean Time To Recovery — the average time from when a system fails (or an incident begins) until it is fully restored to normal service for users. This is the most common modern meaning in software/SRE contexts.
- Mean Time To Repair — an older, hardware-engineering meaning: the average time a technician spends actively repairing a broken physical component, not counting the time waiting for a replacement part to arrive or for someone to notice the failure.
This guide focuses on the software/SRE meaning — recovery, meaning “the users are unblocked and things work again” — because that’s the meaning used by nearly every modern engineering organization, dashboard, and SLA document you will encounter.
Think about a power outage in your neighborhood. One useful number is “how often does the power go out here” (that’s a frequency measure, called MTBF — Mean Time Between Failures, covered in Section 3). A completely different, and arguably more practical, number is “once the power goes out, how long until it comes back on?” If your neighborhood loses power once a year but it’s restored in 5 minutes because of an automated smart grid, that’s a very different experience than losing power once a year and waiting 8 hours for a truck to be dispatched. MTTR is that second number — the recovery speed — and it’s often the number that determines how much an outage actually hurts.
1.2 A Short History
1950s–60s — Reliability Engineering in Manufacturing
MTTR (as “Mean Time To Repair”) originated in industrial and military reliability engineering, used to evaluate maintainability of physical equipment — radar systems, aircraft, factory machinery. Alongside MTBF, it became a standard part of reliability math taught in engineering schools.
1980s–90s — Telecom and Data Center Operations
As computing systems became mission-critical, telecom companies and early data centers adapted MTTR to describe how quickly technicians could restore a failed server, switch, or line — still largely a hardware-repair concept.
2000s–2010s — Web-Scale Operations & DevOps
As companies like Google, Amazon, and later a wave of SaaS companies started running enormous, constantly-changing software systems, the meaning of MTTR shifted from “time to physically repair a part” to “time to restore user-facing service” — because in software, the fix is rarely a physical repair; it’s a rollback, a failover, a config change, or a restart.
2014–present — The DORA Era
Google’s DevOps Research and Assessment (DORA) program identified MTTR (framed as “time to restore service”) as one of its four key metrics for measuring software delivery and operational performance — alongside deployment frequency, lead time for changes, and change failure rate. This cemented MTTR as a headline reliability metric across the entire software industry, referenced constantly in the influential book Accelerate (Forsgren, Humble, Kim, 2018).
The Problem & Motivation
At sufficient scale and complexity, some failure is statistically inevitable. So the real question isn’t “how do we prevent every failure?” — it’s “given that failure will happen, how fast can we make it over?”

2.1 Why Not Just Count How Often Things Break?
For decades, a lot of organizations obsessed almost exclusively over preventing failure — trying to get systems that “never break.” This instinct makes intuitive sense, but it runs into a hard truth of modern distributed systems: at sufficient scale and complexity, some failure is statistically inevitable. You will have hardware fail, a third-party API go down, a bad deploy slip past review, a data center lose power, or a dependency you don’t even know you have quietly break. Trying to reach “zero failures” in a complex system is not just expensive — past a certain point, it’s mathematically closer to impossible than improbable.
Instead of asking only “how do we prevent all failure,” mature engineering organizations also ask “given that failure is inevitable, how do we make sure it’s over as fast as possible?” MTTR is the metric that keeps that second question honest and measurable.
2.2 The Real Cost of Slow Recovery
Two systems can have the exact same number of failures per year and produce wildly different amounts of real-world damage, purely based on recovery speed:
| System | Failures per year | MTTR | Total downtime per year |
|---|---|---|---|
| System A | 12 | 5 minutes | 1 hour |
| System B | 12 | 4 hours | 48 hours |
Both systems fail with the same frequency. System B experiences 48 times more total downtime purely because it takes longer to recover each time. From a customer’s perspective, System A looks nearly perfect; System B looks unreliable — even though the underlying rate of things going wrong is identical.
2.3 Why This Matters for the Business, Not Just Engineers
Downtime has a direct dollar cost: lost transactions, breached SLAs (often with financial penalties), damaged customer trust, and support-team overload. But it also has a psychological cost for the engineering team itself — long, dragged-out incidents burn people out far more than short, well-handled ones, even if the underlying failure was identical in severity.
Imagine two students who both occasionally spill a drink on their homework. Student A has a small towel right next to their desk, notices spills immediately, and is back to writing in under a minute. Student B has to walk to the kitchen for a towel, and by the time they get back, the ink has smudged and half the page is ruined — a five-minute round trip that turns a tiny accident into a much bigger mess. Both students spill things equally often. The one with a fast, well-rehearsed recovery plan barely notices the incidents happened at all.
Core Concepts & Vocabulary
Total recovery time isn’t one thing — it’s a chain of several distinct phases. Each phase can be measured, targeted, and improved independently, which is the single most useful mental model in this guide.
3.1 MTTR — Mean Time to Recovery
What: The average elapsed time from the start of an incident (or the moment of failure) to the point where service is fully restored for users. Why: It’s the single number that best captures “how bad does an outage actually feel,” because it multiplies directly against how many people are affected for how long. Where: SRE dashboards, SLA reports, DORA metrics, incident management tools like PagerDuty and Opsgenie.
MTTR = (Sum of all recovery durations) ÷ (Number of incidents)
3.2 MTBF — Mean Time Between Failures
What: The average time a system runs normally between one failure ending and the next one starting — a frequency measure, not a speed-of-recovery measure. Why it’s often discussed alongside MTTR: together they answer both halves of the reliability question: “how often” (MTBF) and “how fast do we bounce back” (MTTR).
MTBF = (Total operational time) ÷ (Number of failures)
3.3 MTTD — Mean Time to Detect
What: The average time between when a problem actually starts and when someone (or something) notices it. Why it matters: MTTD is usually the biggest hidden chunk of total MTTR — a failure that goes unnoticed for 20 minutes before anyone even starts responding often costs more total downtime than the actual fix itself.
3.4 MTTA — Mean Time to Acknowledge
What: The average time between an alert firing and a human confirming “I’m on it.” Why it matters: This measures the health of your paging and on-call process, separate from how good your engineers are at actually fixing things once they start.

3.5 MTTF — Mean Time to Failure
What: Used for components that are replaced rather than repaired (e.g., a hard drive, a light bulb) — the average time until the first failure, after which the component is discarded, not fixed. Less common in day-to-day software incident management, but still used in hardware/infrastructure capacity planning.
3.6 How MTTR Decomposes
Here’s the key mental model of this entire guide: total recovery time is not one thing — it’s a chain of several distinct phases, and each phase can be measured, targeted, and improved independently.
This decomposition is enormously practical: if your overall MTTR is too high, you can’t fix it until you know which segment of the chain is actually slow. Maybe detection is instant but diagnosis takes forever because logs are scattered across ten systems. Maybe diagnosis is fast but the actual rollback mechanism is a manual, error-prone, 25-minute process. Each of those problems has a completely different solution.
MTTD — Detect
Time from failure start to first alert or human noticing. Usually the biggest hidden chunk of total MTTR.
MTTA — Acknowledge
Time from alert firing to a human confirming “I’m on it.” A pure paging-and-on-call health metric.
Diagnose
Time to identify the root cause. Dominated by observability quality and tribal knowledge.
Mitigate
Time to actually apply the fix — rollback, failover, config change, restart. Where automation wins big.
Verify
Time to confirm real user-facing recovery via health checks, not just “the fix was deployed.”
Architecture & Components
Measuring MTTR accurately, at scale, across an organization, requires real infrastructure — not just a spreadsheet someone updates by hand. Let’s look at the pieces.
| Component | Role |
|---|---|
| Monitoring / Alerting system | Detects the failure and timestamps its start — the origin point of the MTTR clock (e.g., Prometheus, Datadog, CloudWatch) |
| Incident management platform | Timestamps acknowledgment, tracks status transitions (e.g., PagerDuty, Opsgenie, incident.io) |
| Status/health check probes | Confirm the moment service is genuinely restored — not just “the fix was deployed” but “users can actually use it again” |
| Incident timeline / postmortem record | The authoritative, timestamped record used to calculate the final MTTR figure per incident |
| Metrics aggregation & dashboard | Rolls up individual incident MTTR values into trends over time, by team, by service, by severity |
| Runbooks / automated remediation | Pre-written or automated recovery steps that directly shrink the “diagnose + mitigate” portion of the MTTR chain |
4.1 Modeling MTTR Calculation in Code
Below is a simplified Java model showing how an incident management system might track the timestamps needed to compute MTTR, MTTD, and MTTA — and how it rolls many incidents up into an aggregate MTTR figure.
import java.time.Duration;
import java.time.Instant;
import java.util.ArrayList;
import java.util.List;

// A single incident with the timestamps needed to compute recovery metrics.
public class Incident {
    private final String id;
    private Instant failureStartedAt;   // when the problem actually began
    private Instant detectedAt;         // when monitoring/alerting noticed it
    private Instant acknowledgedAt;     // when a human confirmed response
    private Instant resolvedAt;         // when service was fully restored

    public Incident(String id, Instant failureStartedAt) {
        this.id = id;
        this.failureStartedAt = failureStartedAt;
    }

    public Duration timeToDetect() {
        return Duration.between(failureStartedAt, detectedAt);
    }

    public Duration timeToAcknowledge() {
        return Duration.between(detectedAt, acknowledgedAt);
    }

    public Duration timeToRecover() {
        // The full clock: failure start to full restoration.
        return Duration.between(failureStartedAt, resolvedAt);
    }

    public void setDetectedAt(Instant t) { this.detectedAt = t; }
    public void setAcknowledgedAt(Instant t) { this.acknowledgedAt = t; }
    public void setResolvedAt(Instant t) { this.resolvedAt = t; }
    public Duration getTimeToRecoverOrNull() {
        return resolvedAt == null ? null : timeToRecover();
    }
}

// Aggregates many incidents into a rolling MTTR figure.
public class ReliabilityMetrics {

    public Duration calculateMTTR(List<Incident> incidents) {
        List<Duration> recoveryTimes = new ArrayList<>();
        for (Incident incident : incidents) {
            Duration d = incident.getTimeToRecoverOrNull();
            if (d != null) {
                recoveryTimes.add(d);
            }
        }
        if (recoveryTimes.isEmpty()) {
            return Duration.ZERO;
        }
        long totalSeconds = recoveryTimes.stream()
                .mapToLong(Duration::getSeconds)
                .sum();
        long meanSeconds = totalSeconds / recoveryTimes.size();
        return Duration.ofSeconds(meanSeconds);
    }

    // Median is often more useful than mean, since MTTR distributions
    // are usually skewed by a small number of very long incidents.
    public Duration calculateMedianRecoveryTime(List<Incident> incidents) {
        List<Long> seconds = new ArrayList<>();
        for (Incident incident : incidents) {
            Duration d = incident.getTimeToRecoverOrNull();
            if (d != null) seconds.add(d.getSeconds());
        }
        seconds.sort(Long::compareTo);
        if (seconds.isEmpty()) return Duration.ZERO;
        int mid = seconds.size() / 2;
        long medianSeconds = (seconds.size() % 2 == 0)
                ? (seconds.get(mid - 1) + seconds.get(mid)) / 2
                : seconds.get(mid);
        return Duration.ofSeconds(medianSeconds);
    }
}
A production-quality metrics system almost always calculates the median alongside the mean, because a single 10-hour outage can badly distort an average calculated from otherwise-fast incidents. This nuance is explored fully in Section 13 (anti-patterns).
How MTTR Is Actually Calculated
The formula looks simple — sum the durations and divide. In practice, almost every disagreement about MTTR comes down to defining exactly when the clock starts, when it stops, and how to aggregate the results honestly.
5.1 Step 1 — Define the Start of the Clock Precisely
This sounds trivial but is one of the most common sources of disagreement in practice: does the MTTR clock start when the failure actually began (which might be unknown until after investigation), or when it was first detected? Most rigorous SRE teams use actual failure start time, reconstructed during the postmortem from logs — because using “detection time” as the start quietly hides the MTTD portion of the problem inside a falsely small MTTR number.
5.2 Step 2 — Define the End of the Clock Precisely
Equally important: recovery should mean “user-facing service is genuinely healthy again,” not “we deployed a fix” or “the on-call engineer believes it’s resolved.” Many teams use automated health checks or synthetic monitoring to mark the true recovery timestamp, since deployed fixes can fail to propagate, caches can serve stale errors, and a fix that “should have worked” sometimes doesn’t.
5.3 Step 3 — Aggregate Correctly Across Many Incidents
Once individual incident durations exist, they get rolled up — typically per week, per month, per service, or per severity tier — into a trend line. This is where the mean-versus-median choice (Section 4’s code example) becomes critical for honest reporting.

5.4 Step 4 — Segment the Metric for It to Be Actionable
A single company-wide MTTR number is a headline, not a diagnostic tool. Mature teams segment it multiple ways:
- By severity: SEV1 MTTR trends matter far more than SEV4 MTTR trends for business risk.
- By service or team: Identifies which parts of the system are structurally harder to recover.
- By root-cause category: “Deploy-caused” incidents might recover in 10 minutes via automated rollback, while “third-party dependency” incidents might average 90 minutes because the team has no control over the fix.
- By time of day / on-call shift: Sometimes reveals gaps in overnight coverage or documentation.
Data Flow & Lifecycle of an Incident
MTTR isn’t one problem to solve — it’s a pipeline of several distinct problems, each with different owners and different fixes. The lifecycle below is the single most useful practical insight in this guide.
Each stage in this lifecycle corresponds to a segment of the MTTR chain from Section 3, and — critically — each stage can be independently invested in and improved. This is the single most useful practical insight in this guide: MTTR isn’t one problem to solve, it’s a pipeline of several distinct problems, each with different owners and different fixes.
| Stage | What typically slows it down | What typically speeds it up |
|---|---|---|
| Detection | Sparse monitoring, noisy alerts causing fatigue, no synthetic checks | Comprehensive SLO-based alerting, synthetic transaction monitoring |
| Acknowledgement | Unclear on-call rotation, alert routing failures, missing escalation policy | Well-tested paging policies, clear escalation chains, practiced on-call runbooks |
| Diagnosis | Logs scattered across systems, no distributed tracing, tribal knowledge | Centralized observability, distributed tracing, well-labeled dashboards |
| Mitigation | Manual, multi-step, error-prone rollback process | One-click or automated rollback, feature flags, canary deployments that auto-revert |
| Verification | No automated health checks; relying on “it looks fine now” | Automated synthetic checks confirming real user-facing recovery |
Advantages, Disadvantages & Trade-offs
MTTR is a powerful, decomposable, business-relevant metric — but only when it’s segmented, paired with severity and repeat-incident data, and protected from being gamed by unclear “resolved” definitions.
7.1 Advantages of Tracking MTTR
- Directly reflects customer pain: Total downtime (frequency × MTTR) tracks much more closely with customer-perceived reliability than failure count alone.
- Actionable and decomposable: Because it breaks into MTTD/MTTA/diagnosis/mitigation stages, teams can target investment precisely where it’s slow.
- Encourages resilience investment over pure prevention: Balances the (often over-invested) instinct to “never let anything fail” with the equally important “recover fast when it inevitably does.”
- Comparable across teams and time: A consistent, well-defined MTTR metric lets leadership compare reliability trends across many services fairly.
7.2 Disadvantages & Limitations
- Sensitive to outliers: A single catastrophic multi-hour incident can badly distort a mean-based MTTR figure for an entire quarter (addressed in Section 13).
- Can be gamed: Teams under pressure to show a good MTTR number might mark an incident “resolved” the moment a fix is deployed, before actually confirming users are unaffected — producing a dishonestly low number.
- Doesn’t capture severity or blast radius: A 10-minute MTTR for an incident that took down the entire platform for millions of users is not equivalent to a 10-minute MTTR for a minor internal tool outage — raw MTTR numbers need severity context to be meaningful.
- Encourages fast-but-shallow fixes if used as the only metric: A team incentivized purely to minimize MTTR might prefer quick, superficial mitigations (like a restart) over addressing the root cause, if root-causing takes longer — this is why MTTR should always be paired with a repeat-incident-rate metric.
Advantages
- Tracks customer-perceived reliability better than raw failure counts
- Decomposable into detect / acknowledge / diagnose / mitigate / verify
- Balances the instinct to “never fail” with “recover fast”
- Comparable across teams, services, and time periods
- A leading indicator of resilience-engineering maturity
Disadvantages / Costs
- Sensitive to outliers — one huge incident distorts a quarter
- Easy to game by marking “resolved” too early
- Ignores severity and blast radius unless segmented
- Encourages shallow fixes if used as the sole KPI
- Only meaningful when definitions are consistent org-wide
MTTR is a powerful, decomposable, business-relevant metric — but only when it’s segmented, paired with severity and repeat-incident data, and protected from being gamed by unclear “resolved” definitions.
Performance & Scalability
As an organization scales from a handful of services to hundreds of microservices and hundreds of engineers, tracking and improving MTTR becomes a genuine data-engineering challenge in its own right.
| Scaling challenge | Approach that works |
|---|---|
| Incidents span many services with different owners | Centralized incident management platform with a single shared timeline, rather than each team tracking its own spreadsheet |
| Inconsistent definitions of “detected” and “resolved” across teams | Org-wide standardized definitions and automated health-check-based resolution timestamps, not manual self-reporting |
| Thousands of incidents per year make manual analysis impossible | Automated dashboards segmenting MTTR by service, severity, and root-cause category, refreshed continuously |
| Mean MTTR hides which services are actually the problem | Percentile-based reporting (p50, p90, p99 recovery time) instead of a single company-wide average |
| Improving MTTR for one team doesn’t help another with different failure modes | Localized, per-team runbook and automation investment guided by that team’s own MTTR breakdown, not a one-size-fits-all initiative |
8.1 Percentiles Matter More Than the Mean, at Scale
Just like latency metrics (p50/p90/p99 response time), MTTR is often more honestly reported using percentiles once you have enough incidents to make that statistically meaningful:
p50 MTTR = 12 min | p90 MTTR = 48 min | p99 MTTR = 4.2 hours
This tells a much richer story than a single “average MTTR = 34 minutes” figure: most incidents recover quickly, but a small tail of incidents takes dramatically longer — and that tail is usually where the most valuable engineering investment opportunity hides.
High Availability & Reliability
You can improve overall availability by making failures rarer or by recovering faster. For a long time, the industry only focused on the first lever. MTTR is the second, and it’s often the cheaper one to pull.
MTTR is one of the two pillars of the classic reliability equation used throughout HA engineering:
Availability ≈ MTBF ÷ (MTBF + MTTR)
This formula makes something explicit that’s easy to miss: you can improve overall system availability by improving either side of the equation — making failures rarer (increasing MTBF) or making recovery faster (decreasing MTTR). For a long time, the software industry over-focused on the MTBF side (chasing “five nines” through redundancy and defensive engineering). Modern SRE practice treats both levers as equally legitimate, and often MTTR is the cheaper lever to pull.

9.1 Why Lowering MTTR Is Often the Faster Path to Better Availability
Reducing failure frequency (raising MTBF) often requires deep, slow architectural investment — more redundancy, more rigorous testing, safer deployment gates. Reducing MTTR, by contrast, often has cheaper, faster wins available: a one-click rollback button, an automated canary-abort, a health-check-based auto-recovery. Many high-performing engineering organizations get outsized reliability gains by investing heavily in MTTR first, precisely because the tooling investment (automation, runbooks, observability) pays off across every future incident, not just the current one.
9.2 Chaos Engineering and MTTR
Practices like Netflix’s Chaos Engineering deliberately inject failure into production, specifically to measure and improve MTTR under realistic conditions, rather than waiting for a real, unplanned incident to reveal that recovery procedures are slow, undocumented, or broken.
Security & MTTR
Unlike an operational outage, a security breach’s damage keeps accumulating silently for every extra minute the MTTR clock is running. That makes detection and acknowledgement uniquely high-stakes.
MTTR applies directly to security incidents too, often under a related term: MTTR for security is sometimes distinguished from operational MTTR as the time from a security breach or vulnerability being introduced to it being fully remediated (patched, credentials rotated, access revoked).
10.1 Why Security MTTR Is Uniquely High-Stakes
Unlike an operational outage, where the “damage” mostly stops accumulating once service is restored, a security breach’s damage can continue accumulating silently for the entire MTTR window, even if the system otherwise looks healthy — an attacker with an unrevoked credential can keep exfiltrating data for every extra minute that credential remains valid. This makes the detection and acknowledgment segments of the MTTR chain (Section 3) especially critical in security contexts.
| Security MTTR segment | Typical bottleneck |
|---|---|
| Detection | Lack of anomaly detection on data access patterns; attacker behavior can look “normal” for a long time |
| Acknowledgement | Security alerts routed to a separate, sometimes understaffed team with slower on-call practices |
| Mitigation | Credential rotation, access revocation, and patching often require careful coordination across multiple systems, slowing the fix |
A fast MTTR for security incidents specifically rewards a blameless, low-friction self-reporting culture — the fastest possible acknowledgment segment depends entirely on people feeling safe to report a suspected issue the moment they notice it.
Monitoring, Logging & Metrics
MTTR is a metric produced by a monitoring and logging pipeline. Understanding that pipeline directly is essential to trusting the number that comes out of it.
11.1 Metrics That Should Always Sit Alongside MTTR
| Companion metric | Why it’s needed alongside MTTR |
|---|---|
| MTBF / failure frequency | Prevents a false sense of reliability — fast recovery from very frequent failures is still a bad experience |
| Repeat-incident rate | Prevents MTTR from rewarding shallow, symptom-only fixes instead of real root-cause remediation |
| Severity / blast radius | Gives context — a fast MTTR on a minor incident and a fast MTTR on a major outage are not equally impressive |
| Error budget consumption | Ties MTTR directly into SLO-based decision-making about how much risk a team can afford to take on for the rest of the period |
11.2 A Dangerous Trap: Dashboards That Only Show the Mean
As discussed in Section 8, a dashboard that reports a single mean MTTR figure without percentiles or segmentation can hide serious problems. A team with a “healthy-looking” mean MTTR of 20 minutes might actually have 90% of incidents resolved in 5 minutes and a devastating 10% that take over 3 hours — information a single averaged number completely erases.
Never report a single mean MTTR number in isolation. Always show median, p90, p99, MTBF, repeat-incident rate, and severity mix alongside it — otherwise the headline number is not just uninformative, it’s actively misleading.
Deployment, Cloud & Architecture Choices
How a system is deployed and architected has an enormous, direct effect on MTTR — often more than the skill of any individual on-call engineer.
12.1 Deployment Practices That Shrink MTTR
- Canary deployments: Rolling a change out to a small percentage of traffic first means a bad deploy is caught and auto-reverted before it affects most users — shrinking both detection and mitigation time dramatically.
- Feature flags: Let teams “turn off” a problematic feature instantly, without a full code rollback or redeploy — often the single fastest mitigation available.
- One-click / automated rollback: Removes the slow, error-prone, manual multi-step rollback process that dominates the mitigation segment of MTTR in less mature organizations.
- Immutable infrastructure & infrastructure-as-code: Makes “redeploy a known-good previous version” a fast, reliable, repeatable operation rather than a manual, bespoke recovery effort.
12.2 Cloud & Architecture Patterns That Shrink MTTR
- Multi-region / multi-AZ failover: Automated failover to a healthy region can reduce recovery time from “however long it takes humans to fix the broken region” to “however long automated DNS/traffic failover takes” — often seconds to minutes instead of hours.
- Database replication with automated failover: A replicated database with an automatic promotion of a replica to primary avoids the much slower manual process of restoring from backup.
- Load balancing with health-check-based routing: Automatically routes traffic away from unhealthy instances the moment they fail health checks, effectively making some failures invisible to users — an MTTR of zero from the customer’s point of view, even while engineers work on a true fix behind the scenes.
- Microservices trade-off: Microservices can make individual service MTTR faster (small, independently deployable services are quicker to roll back) but can also make diagnosis slower, because a failure can cascade across many services and distributed tracing becomes essential to find the actual origin quickly.
Canary Deploys
Small-percentage traffic rollouts catch bad releases before most users are affected. Auto-abort is the killer feature.
Feature Flags
Turn a bad feature off in seconds without a redeploy — often the single fastest mitigation available.
One-Click Rollback
Removes the multi-step, error-prone manual process that dominates mitigation time in less mature orgs.
Multi-Region Failover
Automated DNS/traffic failover moves recovery from “hours” to “seconds” for whole-region outages.
DB Replica Promotion
Automatic promotion of a standby replica avoids the far slower backup-restore path.
Health-Check Routing
Traffic diverts from unhealthy instances instantly — some failures become invisible to end users entirely.
Netflix’s architecture is explicitly designed around the assumption that any individual service or even entire AWS region can fail at any time. Their systems are built so that failures are absorbed by automated failover and graceful degradation (e.g., falling back to a simpler recommendation algorithm rather than showing an error page) — pushing large portions of their effective MTTR toward zero from the end user’s perspective, even when internal systems are actively recovering.
Design Patterns & Anti-Patterns
Some patterns compound over years to shrink MTTR across every future incident. Others quietly inflate it while pretending to shrink it — and the latter is usually more dangerous than the former is helpful.

13.1 Patterns (What Works)
| Pattern | How it lowers MTTR |
|---|---|
| Runbooks | Pre-written, tested recovery steps remove the “figure it out from scratch under pressure” time cost during diagnosis and mitigation |
| Circuit breakers | Automatically stop calling a failing dependency, containing blast radius and often self-healing without any human intervention at all |
| Automated rollback on canary failure | Detects a bad deploy from early metrics and reverts before most users are ever affected |
| Graceful degradation | Serves a reduced but functional experience instead of a hard failure, effectively shrinking user-perceived MTTR to near zero |
| Game days / chaos engineering drills | Practices the full incident-response chain regularly, so the real MTTR during an actual incident isn’t the team’s first attempt |
13.2 Anti-Patterns (What to Avoid)
| Anti-pattern | Why it fails |
|---|---|
| Using mean only, never median or percentiles | A handful of extreme outlier incidents silently dominate the reported number, hiding the true typical experience |
| Marking “resolved” at deploy time, not verified-healthy time | Produces an artificially low MTTR that doesn’t reflect when users actually stopped being affected |
| Optimizing MTTR in isolation from repeat-incident rate | Rewards fast, shallow fixes (like a restart) over real root-cause remediation, causing the same incident to keep recurring |
| One company-wide MTTR number with no segmentation | Averages together a fast-recovering team and a slow-recovering team, making it impossible to know where to actually invest |
| Manual, undocumented recovery steps living only in one engineer’s head | MTTR becomes a bus-factor problem — recovery is fast only when that specific person is available |
Do This
- Write and version-control runbooks; test them in game days
- Instrument circuit breakers around every external dependency
- Wire canary metrics into automatic rollback triggers
- Design for graceful degradation from day one
- Practice full-chain incident response regularly
Avoid This
- Reporting only the mean — the tail will lie to you
- Marking “resolved” on deploy instead of verified health
- Chasing low MTTR without watching repeat-incident rate
- A single company-wide number with no segmentation
- Recovery steps that live only in one engineer’s head
Best Practices & Common Mistakes
The discipline that turns MTTR from a vanity number into a genuine reliability lever.
14.1 Best Practices
- Define “detected” and “resolved” precisely and consistently, org-wide, ideally anchored to automated signals (alerts firing, health checks passing) rather than subjective human judgment.
- Always report MTTR alongside severity, MTBF, and repeat-incident rate — never as a lone headline number.
- Use percentiles (p50/p90/p99), not just the mean, once incident volume is high enough to make that meaningful.
- Invest in the slowest segment of the chain first (detection, acknowledgment, diagnosis, mitigation, or verification) rather than treating “reduce MTTR” as one vague, undifferentiated goal.
- Automate recovery wherever safely possible — automated rollback and failover remove human reaction time from the equation entirely, often the single biggest MTTR win available.
- Practice recovery regularly through game days or chaos engineering, so the real incident isn’t the first time a runbook has ever been executed.
14.2 Common Mistakes
- Treating MTTR as a performance metric for individual engineers rather than a system/process health metric — this recreates the exact blame-culture problems covered in the companion guide on blameless postmortems, and causes people to hide or rush incident handling to protect their personal numbers.
- Chasing a lower MTTR number without asking whether the underlying fix was real, leading to a fast but hollow metric that doesn’t reduce actual customer pain over time.
- Ignoring MTTD and MTTA and only measuring from acknowledgment onward — this can hide the fact that a system takes 40 minutes just to notice something is wrong in the first place.
- Setting MTTR targets without investing in the tooling needed to hit them — a target without automated rollback, good observability, or practiced runbooks is just a wish.
A healthy MTTR practice is boring, consistent, and honest. It defines its terms precisely, reports percentiles instead of averages, invests in the slowest chain segment first, and never treats the number itself as more important than the customer experience it’s supposed to represent.
Real-World Industry Examples
Concrete examples of how the industry’s most reliability-focused organizations have made MTTR a first-class engineering discipline.
15.1 Google — DORA Metrics
Google’s DevOps Research and Assessment (DORA) program identified “time to restore service” as one of the four key metrics that separate high-performing engineering organizations from low-performing ones — finding, across years of research surveying thousands of organizations, that elite performers restore service in under an hour, while low performers can take a week or more.
15.2 Netflix — Architecture Designed Around Fast, Often Invisible Recovery
Netflix’s approach to resilience (circuit breakers, graceful degradation, automated regional failover, and chaos engineering) is built specifically to drive user-perceived MTTR toward zero, treating recovery speed as a first-class architectural concern rather than an afterthought handled purely by on-call humans.
15.3 Amazon — Operational Excellence and Automated Recovery
Amazon’s internal operational practices emphasize automated detection and mitigation (auto-scaling, health-check-based instance replacement, automated failover) specifically to shrink MTTR without depending on human response time for the majority of routine failures, reserving human intervention for genuinely novel problems.
15.4 PagerDuty / incident.io — The Incident Management Tooling Layer
Companies like PagerDuty and incident.io built entire products around precisely and consistently measuring the MTTD/MTTA/MTTR chain across an organization, reflecting how central this decomposed measurement approach has become to modern SRE practice — MTTR is now a first-class, dashboarded metric in nearly every serious engineering organization’s tooling stack.
15.5 Telecom & Hardware Reliability Engineering — the Origin Discipline
Telecom companies and aerospace/defense contractors have used MTTR (as Mean Time To Repair) for decades to evaluate equipment maintainability, directly informing later software adaptations of the same underlying mathematical model of availability described in Section 9.
Google — DORA
Established MTTR (“time to restore service”) as one of the four key metrics separating elite and low-performing engineering orgs.
Netflix
Circuit breakers, graceful degradation, and automated regional failover drive user-perceived MTTR toward zero.
Amazon
Auto-scaling, health-check-based replacement, and automated failover shrink MTTR without human response time.
PagerDuty / incident.io
Entire products built to consistently measure the MTTD / MTTA / MTTR chain across large engineering orgs.
Telecom & Aerospace
Decades of “Mean Time to Repair” discipline in hardware reliability directly informed the modern software adaptation.
Frequently Asked Questions
Short, direct answers to the questions that come up most when teams first start treating MTTR seriously.
Q: Is a lower MTTR always better?
A: Generally yes, but only when paired with honest measurement. A team can produce an artificially low MTTR by marking incidents “resolved” too early, or by applying shallow fixes that let the same root cause recur. A genuinely good MTTR trend should be read alongside repeat-incident rate and severity data, not in isolation.
Q: What’s a “good” MTTR number?
A: It depends heavily on severity, industry, and system complexity, so there’s no single universal target. As a rough industry reference point, Google’s DORA research found elite-performing teams restore service in under an hour for most incidents, while low performers can take a week — but the more useful practice is tracking your own trend over time and segmenting by severity, rather than chasing an arbitrary external number.
Q: What’s the difference between MTTR and MTBF?
A: MTTR measures recovery speed — how long an incident lasts once it starts. MTBF measures failure frequency — how often incidents happen in the first place. They’re complementary: overall availability depends on both (Section 9’s formula), and a system can be strong on one and weak on the other.
Q: Should MTTR be measured in wall-clock time or business hours?
A: For most customer-facing systems, wall-clock time is the honest measurement, since customers experience downtime regardless of what time zone or business hours it falls in. Some internal-tooling teams use business-hours-adjusted MTTR for tools that genuinely have no after-hours usage, but this should be an explicit, documented exception, not a default way to make numbers look better.
Q: Can automation fully eliminate the need to track MTTR?
A: No — even in highly automated environments, MTTR remains valuable as a diagnostic signal. Automated failover and rollback shrink MTTR dramatically for well-understood failure modes, but genuinely novel incidents will still require human diagnosis, and tracking MTTR tells you where automation coverage is strong and where it still has gaps.
Q: How does MTTR relate to blameless postmortems?
A: They reinforce each other directly. Fast, honest MTTR data depends on people reporting and acknowledging incidents the moment they notice them, which in turn depends on a blameless culture where reporting quickly is never punished. A blame-heavy culture quietly inflates MTTD and MTTA, because people hesitate before raising their hand.
Summary & Key Takeaways
You cannot make failure impossible. But you can make recovery so fast, so automated, and so well-practiced that your users barely notice it happened at all — that is the entire promise of taking MTTR seriously.
- MTTR (Mean Time to Recovery) measures the average time from when a failure begins until service is fully restored — it answers “how fast do we bounce back,” as distinct from MTBF, which answers “how often do we fail.”
- MTTR decomposes into a chain of measurable stages: detection (MTTD) → acknowledgment (MTTA) → diagnosis → mitigation → verification — each stage can be independently measured and improved.
- Total downtime is roughly frequency × MTTR, which is why two systems with identical failure rates can feel completely different to users if their recovery speeds differ.
- Overall availability depends on both MTBF and MTTR (
Availability ≈ MTBF ÷ (MTBF + MTTR)), and lowering MTTR is often the faster, cheaper lever to pull compared to chasing ever-rarer failures. - Architecture and deployment choices — canary releases, feature flags, automated rollback, multi-region failover, circuit breakers, and graceful degradation — have an outsized effect on MTTR, often more than individual on-call skill.
- MTTR should always be reported with percentiles, not just the mean, and always alongside severity and repeat-incident-rate data, to avoid being distorted by outliers or gamed by shallow fixes.
- Google’s DORA research established MTTR (“time to restore service”) as one of the four key metrics separating elite and low-performing engineering organizations.
- MTTR and blameless postmortem culture reinforce each other: honest, fast reporting — which directly shrinks MTTD and MTTA — depends on people trusting that raising their hand quickly will never be punished.
You cannot make failure impossible. But you can make recovery so fast, so automated, and so well-practiced that your users barely notice it happened at all — that is the entire promise of taking MTTR seriously.
17.1 A Simple Mental Checklist
- Define the clock precisely. When does it start (real failure moment, not detection)? When does it stop (verified user-facing health, not deploy time)?
- Segment the metric. Break MTTR down by severity, service, root-cause category, and shift — a single company-wide number is a headline, not a lever.
- Report percentiles, not just the mean. Once volume allows it, publish p50 / p90 / p99 alongside the average.
- Pair MTTR with companion metrics. MTBF, repeat-incident rate, severity mix, and error-budget consumption keep MTTR honest.
- Invest in the slowest segment first. Detection, acknowledge, diagnose, mitigate, verify — don’t treat “lower MTTR” as one undifferentiated goal.
- Automate the boring recovery. Rollback, failover, and health-check-based rerouting remove human reaction time from most of the chain.
- Practice regularly. Game days and chaos engineering ensure the real incident isn’t the runbook’s first execution.
17.2 Where to Go From Here
Once you’re comfortable with the concepts in this guide, the natural next steps are: studying the SRE workbook and the DORA Accelerate research directly; setting up basic incident-timeline tracking in whichever tool your team already uses (PagerDuty, Opsgenie, incident.io, or even a shared spreadsheet as a starting point); and beginning to run regular game-day drills against your own systems so the numbers you collect reflect a genuinely-practiced recovery process rather than a first-time-under-fire one. Reading blameless postmortems published by companies like Cloudflare, GitHub, and Slack is also one of the fastest ways to internalize how mature organizations reason about the specific MTTR segments that hurt most in real outages.