What Is An Alert, In Monitoring Terms?
A complete, beginner-friendly walkthrough of alerts — what they are, how they are built, how they travel through a monitoring pipeline, and how real engineering teams use them to catch outages before customers do.
01 · INTRODUCTION & HISTORY
From Smoke Detectors To Site Reliability
Imagine you are the only person watching over a huge building at night — hundreds of rooms, hundreds of machines humming away in the dark. You cannot physically walk into every room every second to check if something is wrong. So instead, you install smoke detectors. When smoke shows up, the detector does not wait for you to notice — it screams. That scream is an alert.
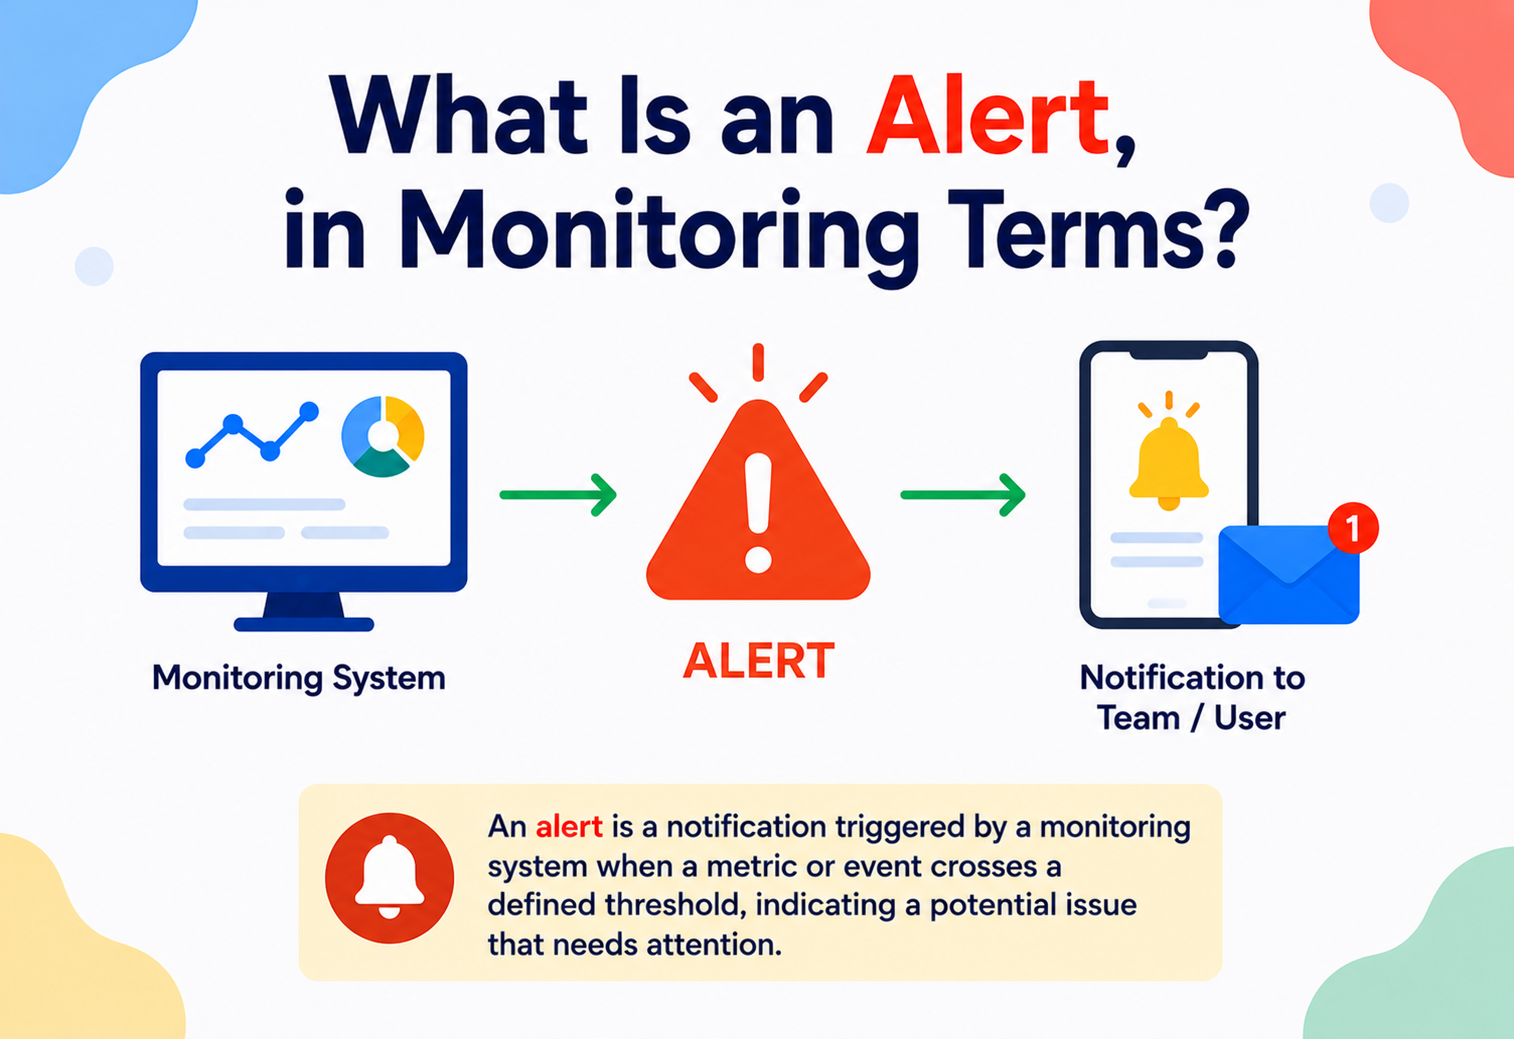
In software and infrastructure monitoring, an alert is exactly that smoke detector’s scream, translated into computer terms: it is an automated notification, triggered when something being measured (a “metric,” a log pattern, or an event) crosses a line that a human decided matters — for example, “CPU usage above 90% for 5 minutes” or “checkout errors above 1% of requests.”
Monitoring itself is much older than computers. Factories have used gauges and warning lights for over a century, and NASA’s mission control rooms in the 1960s were essentially rooms full of humans watching dials, ready to react to problems on the Apollo missions. As computing grew, the “human watching a dial” model did not scale. In the 1980s and 90s, tools like Big Brother and later Nagios (released in 1999, originally named NetSaint) formalised the idea of a program that checks systems on a schedule and pages a human when something is wrong. That is the direct ancestor of every alerting system in use today.
Since then, alerting has evolved from simple “is the server up or down” checks into rich systems that watch metrics, logs, traces, and business KPIs — and that can even use machine learning to decide what “normal” looks like before deciding something is abnormal.
An alert is a message a computer sends to a person (or another system) saying: “Hey, something you care about just crossed a line you set. Come look.”
Mission control era
Rooms full of humans watching dials in real time — the original “monitoring” system. Doesn’t scale beyond one launch.
Big Brother & Nagios (1999)
First widely-used programs that poll systems on a schedule and page a human when something goes wrong.
Prometheus & Datadog era
Time-series-first alerting, pull-based scraping, rich label models, and cloud-hosted alerting-as-a-service.
SLO- and ML-driven alerting
Alerts tied to error budgets and user-facing SLOs; anomaly detection replaces hand-tuned thresholds for many signals.
02 · PROBLEM & MOTIVATION
Why Modern Systems Cannot Be Watched By Hand
Why do we need alerts at all? Because modern systems are too big, too fast, and too continuous for humans to watch directly.
Picture an online store during a big sale. There might be thousands of servers, millions of requests per minute, and dozens of teams each owning a small piece of the puzzle (payments, search, shipping, recommendations). If something breaks — say, the payment service starts failing 1 in 10 requests — every second that passes without anyone noticing is lost revenue and frustrated customers.
Without alerts, teams are left with two bad options:
- Constant manual checking — someone stares at dashboards all day, which is boring, error-prone, and does not scale past a handful of systems.
- Waiting for complaints — you find out about the outage when angry customers or your boss tells you, which is far too slow and damages trust.
Alerts solve this by flipping the model: instead of humans pulling information (checking dashboards), the system pushes information to humans exactly when it matters. This is the difference between a doctor who only checks your heart rate if you happen to visit, versus a heart monitor that beeps the moment something looks wrong.
Why alerts matter
- Catch problems in seconds or minutes, not hours.
- Free humans from constant manual watching.
- Create a documented trail of what went wrong and when.
- Enable automated responses (auto-scaling, failover, safe restart).
What happens without them
- Outages are discovered by customers, not engineers.
- Slow, chaotic incident response — “who noticed this first?”
- No early warning before small issues become big ones.
- Burnout from constant manual dashboard-watching.
Alerting turns “watching” into a background activity a computer does forever, cheaply, and without getting bored — so humans can spend their attention on diagnosing and fixing instead of noticing.
03 · CORE CONCEPTS
The Vocabulary Every Responder Should Know
Before going further, let us build a shared vocabulary. Every one of these terms will come up again later, so we will explain each simply, with an everyday analogy.
Metric
What: A metric is a number measured over time — like CPU usage, number of errors per minute, or how many people are on your website right now.
Why: Numbers are what computers can compare against thresholds. You cannot alert on a feeling, but you can alert on a number.
Analogy: A metric is like your body temperature — a single number, tracked over time, that tells you something about health.
Threshold
What: The line a metric must cross before we care. Example: “temperature above 38°C.”
Why: Without a threshold, every tiny wiggle in a number would cause noise. The threshold defines what “too much” means.
Analogy: The red line on a car’s temperature gauge — below it, no worries; above it, pull over.
Alert Rule (or Alerting Rule)
What: The actual logic that says “watch this metric, compare it to this threshold, for this long, and if it is still true, fire.”
Why: This is the recipe the monitoring system follows to decide when to speak up.
Analogy: A recipe card: “if the oven stays above 250°C for more than 2 minutes, sound the smoke alarm.”
Alert (or Alarm)
What: The actual event that is created the moment a rule’s condition becomes true. Some tools use “alert” and “alarm” interchangeably; others treat “alarm” as the persistent state and “alert” as the notification event.
Why: This is the “thing” that gets tracked, routed, and eventually resolved.
Analogy: The smoke detector going off — that specific moment of “beep beep beep” is the alert.
Notification
What: The message that is actually delivered to a human or system — an email, a Slack message, a page on someone’s phone, a text message.
Why: An alert existing inside a monitoring system does nothing if nobody hears about it — the notification is what actually reaches a person.
Analogy: The smoke detector going off is the alert; the fact that it wakes you up at 2am is the notification.
Incident
What: A tracked “this is a real problem we are actively working on” record, often created from one or more related alerts.
Why: Multiple alerts can point to the same root problem; incidents group them so responders do not get 50 separate pages for one outage.
Analogy: If ten smoke detectors go off in one building because of one kitchen fire, the “incident” is the fire — not each individual beep.
On-call
What: The person (or rotation of people) responsible for responding when an alert fires, usually outside of normal work hours too.
Why: Systems run 24/7; someone has to be reachable 24/7 too, on a fair rotating schedule.
Analogy: The on-duty doctor at a hospital — there is always someone whose pager might go off.
Severity
What: A label describing how bad the problem is — commonly Critical, Warning, or Info.
Why: Not every alert deserves to wake someone up at 3am. Severity tells the system (and the human) how urgently to react.
Analogy: A hospital’s triage system — sniffles wait in the lobby, but a heart attack goes straight to the front of the line.
Flapping
An alert that repeatedly fires and resolves in quick succession, like a light switch being flicked rapidly.
Silencing / Muting
Deliberately turning off notifications for an alert temporarily, often during known maintenance.
Escalation
Automatically notifying a different or additional person if the first one does not respond in time.
Runbook
A written, step-by-step guide attached to an alert explaining how to investigate and fix the underlying issue.
04 · ARCHITECTURE & COMPONENTS
The Cooperating Pieces That Make Alerting Work
A real-world alerting system is made up of several cooperating pieces. Let us walk through them using a typical modern stack (similar in spirit to Prometheus + Alertmanager, Datadog, or Amazon CloudWatch).
Key components explained
Collector / Agent
A small program running near your application that gathers numbers (CPU, memory, request counts) and ships them off — for example a Prometheus exporter or a Datadog agent.
Time-Series Database (TSDB)
A database built specifically to store “number + timestamp” pairs efficiently, so you can ask “what was CPU usage every 15 seconds for the last week?” quickly.
Evaluation Engine
The brain that periodically runs each alert rule against the latest data and decides true / false.
Alert Manager
Takes raw “this rule is true” signals and applies grouping, deduplication, silencing, and routing logic before anyone is bothered.
Notification Channel
The delivery mechanism — chat app, email, SMS, phone call, or a dedicated on-call paging tool such as PagerDuty.
Runbook / Docs Link
Attached context so the responder does not start from zero every single time an alert fires.
Think of the pipeline as three layers stacked bottom-up: data (metrics, logs, traces), decisions (rules and evaluations), and delivery (routing, escalation, channels). Every incident report you will ever read touches at least one of those layers.
05 · INTERNAL WORKING
How An Alert Actually Fires
Let us zoom into the “Alert Evaluation Engine” box, because this is where the real decision-making happens.
Most systems do not just check the current value of a metric once and immediately alert — that would cause way too much noise from tiny, temporary blips. Instead, they use a pattern like this:
- Sample the metric at a regular interval (e.g., every 15 seconds).
- Evaluate the rule’s condition against recent data (e.g., “average CPU over last 5 minutes > 90%”).
- Hold / debounce — require the condition to stay true for a minimum duration (“
for: 5m“) before really firing, to avoid reacting to a single spike. - Transition state from “OK” to “Pending” to “Firing.”
- Notify once state becomes “Firing,” respecting routing and silencing rules.
- Resolve automatically once the condition becomes false again for a sustained period, and typically send a “resolved” notification.
Here is a simplified Java example showing the core evaluation loop you might find inside a homemade alerting engine. It is deliberately simple — real systems add persistence, distributed evaluation, and much more error handling — but the logic mirrors what tools like Prometheus’s Alertmanager do internally.
public class AlertRule {
    private final String name;
    private final double threshold;
    private final Duration forDuration; // how long the condition must hold
    private Instant conditionTrueSince = null;
    private boolean firing = false;

    public AlertRule(String name, double threshold, Duration forDuration) {
        this.name = name;
        this.threshold = threshold;
        this.forDuration = forDuration;
    }

    // Called every evaluation cycle (e.g. every 15 seconds) with the latest value
    public Optional<AlertEvent> evaluate(double currentValue, Instant now) {
        boolean conditionMet = currentValue > threshold;

        if (conditionMet) {
            if (conditionTrueSince == null) {
                conditionTrueSince = now; // condition just became true
            }
            boolean heldLongEnough =
                Duration.between(conditionTrueSince, now).compareTo(forDuration) >= 0;

            if (heldLongEnough && !firing) {
                firing = true;
                return Optional.of(new AlertEvent(name, Severity.CRITICAL,
                        "FIRING", currentValue, now));
            }
        } else {
            // Condition no longer true — reset and resolve if we were firing
            boolean wasFiring = firing;
            conditionTrueSince = null;
            firing = false;
            if (wasFiring) {
                return Optional.of(new AlertEvent(name, Severity.CRITICAL,
                        "RESOLVED", currentValue, now));
            }
        }
        return Optional.empty(); // nothing changed, stay quiet
    }
}
Notice the for duration logic: this is precisely what stops a one-second CPU spike from paging someone at 3am. It is a small piece of code, but it is the single most important anti-noise mechanism in most alerting systems.
Setting forDuration to zero. This makes every alert rule react to the very first bad sample, which usually results in constant false alarms from normal, brief fluctuations.
06 · DATA FLOW & LIFECYCLE
The Journey Of A Single Alert
An alert is not a single moment — it is a journey with distinct stages, from “everything is fine” to “we fixed it and wrote it down.” Here is the full lifecycle:
Normal (OK)
The metric is within acceptable bounds. No alert exists. This is the state a healthy system spends 99%+ of its time in.
Condition Breached
The metric crosses the threshold. The system starts a timer but does not notify yet — this is the “Pending” state.
Firing
The condition held long enough. The alert becomes active and a notification is generated.
Routed & Delivered
The Alert Manager decides who should see it, deduplicates it against similar alerts, and sends it through the right channel (Slack, page, email).
Acknowledged
A human confirms “I have seen this and I am looking into it,” which usually stops further escalation pages.
Investigated & Mitigated
The responder digs in — checks dashboards, logs, recent deploys — and takes action (rollback, restart, scale-up).
Resolved
The metric returns to normal and stays there; the system automatically marks the alert resolved and often notifies “all clear.”
Post-incident Review
For serious alerts, the team writes a postmortem: what happened, why, and what will prevent it next time.
07 · ADVANTAGES, DISADVANTAGES & TRADE-OFFS
The Hidden Cost Of Every Alert
Alerting sounds like a pure win, but every alert you create has a hidden cost: someone’s attention. That trade-off shapes almost every design decision in this space.
Advantages
- Faster detection than any human watching manually.
- Consistent — never gets tired or distracted.
- Creates a timestamped record for later analysis and postmortems.
- Can trigger automation (auto-restart, auto-scale) with zero human delay.
Disadvantages
- Too many alerts causes alert fatigue — people start ignoring them.
- Poorly tuned thresholds create false positives (crying wolf) or false negatives (missed real issues).
- Alerts interrupt humans, which has a real cost to focus and wellbeing, especially at night.
- Building and maintaining good alerting rules takes ongoing engineering effort.
The central trade-off is usually described as sensitivity vs. noise. A very sensitive alert (low threshold, short “for” duration) catches problems early but fires often, including on non-issues. A less sensitive alert misses small problems but is quieter overall. Good alerting design constantly balances these two.
“An alert should be actionable, urgent, and real. If it is not all three, it should not page a human.”
08 · PERFORMANCE & SCALABILITY
When Alerting Itself Becomes A Serious System
When you have 10 servers, evaluating alert rules is trivial. When you have 10,000 servers each emitting hundreds of metrics every 15 seconds, the alerting system itself becomes a piece of serious infrastructure that has to scale.
Where the scaling pressure comes from
- Cardinality — the number of unique combinations of metric + labels (e.g., metric
request_countsplit by service, region, and status code can multiply into millions of distinct time series). - Evaluation frequency — checking rules every 15 seconds across millions of series requires serious compute.
- Fan-out of notifications — a single root-cause failure (like a shared database going down) can trigger thousands of dependent alerts simultaneously, called an alert storm.
Common scaling techniques
Sharding rule evaluation
Split alert rules across multiple worker processes so no single machine evaluates everything.
Downsampling
Store older data at lower resolution (e.g., 1-minute averages instead of 15-second samples) to save storage and compute.
Grouping & deduplication
Collapse hundreds of related alerts into one notification, so an outage produces one page, not a thousand.
Rate limiting notifications
Cap how many alerts can be sent to a channel per minute to prevent flooding during a storm.
09 · HIGH AVAILABILITY & RELIABILITY
The Watcher Must Never Be The Blind Spot
There is a special irony in monitoring: if the monitoring system itself goes down, you lose visibility exactly when you might need it most — during an outage. Because of this, alerting infrastructure is usually built to be more reliable than the systems it is watching.
Techniques used
- Redundant evaluation — running two or more independent alert evaluators so one failing does not blind the whole system.
- Multiple notification channels — if Slack is down, fall back to SMS or a phone call.
- Dead man’s switch alerts — an alert that fires if it stops receiving a regular “I’m alive” heartbeat from the monitoring system itself, catching the case where monitoring silently dies.
- Geographic distribution — running monitoring infrastructure in a different region / data centre than the systems it watches, so one region’s outage does not take down the eyes watching it.
Imagine a train driver who has to press a button every 30 seconds or the train automatically stops — because silence itself might mean something is wrong. A “dead man’s switch” alert flips the usual logic: instead of alerting when something bad happens, it alerts when the expected “I’m okay” signal stops arriving.
10 · SECURITY
Silencing Alerts Is As Dangerous As Causing The Outage
Alerting systems touch sensitive territory: they often have access to internal metrics, logs (which can contain personal data), and the ability to reach engineers directly. That makes them a target worth securing carefully.
Access control
Only authorised users / services should be able to create, modify, or silence alert rules — an attacker silencing your alerts is as dangerous as causing the outage itself.
Data sensitivity
Alert payloads (which may include log snippets) should avoid leaking secrets or personal data into third-party notification channels.
Notification channel security
Webhook URLs and API keys used to send notifications must be treated as secrets, not hardcoded in configs.
Audit trail
Every silence, acknowledgment, and rule change should be logged with who did it and when.
An attacker who can silence alerting rules can effectively make an intrusion or outage invisible to the team responsible for catching it — treat alert-configuration access like a production credential.
11 · META-MONITORING
Monitoring The Monitors
A mature organisation does not just alert on its application — it also tracks the health of the alerting system itself. This is sometimes called meta-monitoring.
- Alert volume over time — is the number of alerts trending up (a sign of growing instability or noisy rules)?
- Mean Time to Acknowledge (MTTA) — how long, on average, before someone responds to a page?
- Mean Time to Resolve (MTTR) — how long from firing to resolved?
- Noise ratio — the percentage of alerts that were acknowledged but turned out not to require action (false positives).
- Notification delivery success rate — did the Slack / SMS / email actually arrive?
| Metric | What it tells you | Good target |
|---|---|---|
| MTTA | How responsive the on-call process is | Under a few minutes for critical alerts |
| MTTR | How fast issues actually get fixed | As low as practical, tracked over time |
| Noise ratio | How trustworthy alerts are | Low — high noise erodes trust fast |
| Pages per on-call shift | Sustainability of the on-call rotation | Low enough to avoid burnout |
12 · DEPLOYMENT & CLOUD
Self-Hosted, Managed, Or Both
You rarely build an alerting system entirely from scratch today. Most teams choose between self-hosted open-source tools and managed cloud services, or combine both.
Self-hosted (open source)
Prometheus + Alertmanager, Grafana, Nagios, Zabbix. Full control and no per-metric billing, but you own the operational burden of running it reliably.
Managed / SaaS
Datadog, New Relic, Amazon CloudWatch, Google Cloud Monitoring. Fast to start, someone else keeps it running, but usage-based pricing can get expensive at scale.
Dedicated on-call / paging tools
PagerDuty, Opsgenie, Splunk On-Call — specialised in routing, escalation policies, and on-call scheduling on top of raw alert data.
In cloud-native environments, alert rules are often defined “as code” (YAML files checked into Git) so they are version-controlled, reviewed, and deployed the same way application code is — this avoids the classic problem of nobody remembering why a certain threshold was set.
# Example: a Prometheus-style alert rule, defined as code
groups:
  - name: checkout-service-alerts
    rules:
      - alert: HighCheckoutErrorRate
        expr: rate(checkout_errors_total[5m]) / rate(checkout_requests_total[5m]) > 0.01
        for: 5m
        labels:
          severity: critical
        annotations:
          summary: "Checkout error rate above 1% for 5 minutes"
          runbook: "https://wiki.internal/runbooks/checkout-errors"
13 · STORAGE, CACHING & LOAD
The Data Layer Under The Alerts
Alerting depends heavily on how the underlying metrics are stored and retrieved, since every evaluation cycle needs fast reads over recent data.
- Time-series databases (TSDBs) such as Prometheus’s own storage, InfluxDB, or TimescaleDB are optimised for “append mostly, query by time range” workloads — very different from a typical relational database.
- In-memory caching of the most recent data points speeds up rule evaluation, since alert rules almost always look at “the last few minutes,” not historical data.
- Load balancing across evaluators spreads rule-checking work evenly, especially important when thousands of rules must be checked every 15–30 seconds.
- Write-ahead logs protect against data loss if an evaluator crashes mid-cycle, so alerts that were “about to fire” are not silently lost.
Every evaluation cycle asks the same shape of question: “give me the last few minutes of this labelled series, ordered by time.” A TSDB stores samples on disk in exactly that order, so the query is a cheap sequential read — orders of magnitude faster than the same workload against a general-purpose relational store.
14 · APIS & MICROSERVICES
Routing Alerts Across Dozens Of Teams
In a microservices architecture, alerting has to work across dozens or hundreds of independently deployed services, each potentially owned by a different team. This adds extra layers:
- Per-service ownership — alerts need to route to the specific team that owns the failing service, not a single central team drowning in unrelated noise.
- Distributed tracing correlation — since one user request can touch ten microservices, alerting systems increasingly integrate with tracing tools (like OpenTelemetry) to help pinpoint which service actually caused a failure.
- Alerting APIs — most modern systems expose a REST API to create, silence, or query alerts programmatically, so alerting can be automated as part of deployment pipelines (e.g., “auto-silence alerts for 10 minutes during a deploy”).
// Example: creating a temporary silence via a REST API using Java's HttpClient
HttpClient client = HttpClient.newHttpClient();

String silenceJson = """
    {
      "matcher": "service=checkout",
      "durationMinutes": 10,
      "reason": "Planned deployment in progress"
    }
    """;

HttpRequest request = HttpRequest.newBuilder()
    .uri(URI.create("https://alerts.internal.example.com/api/v1/silences"))
    .header("Content-Type", "application/json")
    .header("Authorization", "Bearer " + apiToken)
    .POST(HttpRequest.BodyPublishers.ofString(silenceJson))
    .build();

HttpResponse<String> response =
    client.send(request, HttpResponse.BodyHandlers.ofString());

System.out.println("Silence created: " + response.statusCode());
15 · DESIGN PATTERNS & ANTI-PATTERNS
The Patterns That Age Well — And The Ones That Bite
Good patterns
Symptom-based alerting
Alert on what users actually experience (error rate, latency) rather than every internal cause — fewer, more meaningful alerts.
SLO-based alerting
Alert when you are burning through your error budget too fast, tying alerts directly to a business-agreed reliability target.
Multi-window burn rate
Combine a short and a long time window so you catch both sudden spikes and slow, steady degradation.
Runbook attachment
Every alert links to clear “what to do” documentation, cutting response time dramatically.
Anti-patterns to avoid
Threshold guessing
Picking a round number (“alert if >80% CPU”) with no data behind it, leading to constant false alarms or missed real problems.
Cause-based over-alerting
Alerting on every internal metric (disk queue depth, GC pauses, etc.) even when users are not affected — a recipe for alert fatigue.
No “for” duration
Firing immediately on the first bad sample, reacting to normal noise instead of real trends.
Alert with no owner
An alert nobody is actually responsible for reading or acting on — it just becomes background noise.
16 · BEST PRACTICES & COMMON MISTAKES
A Short, Portable Checklist
Best practices
- Every alert should be actionable — if there is nothing to do, it should not page anyone.
- Attach a runbook link to every critical alert.
- Regularly review alert history and delete or tune noisy rules.
- Use severity levels consistently across teams.
- Test alert rules against historical data before relying on them.
Common mistakes
- Copy-pasting thresholds between unrelated services without validating them.
- Treating every alert as equally urgent (everything is “critical”).
- Never revisiting old alert rules as systems evolve.
- No escalation path if the primary on-call does not respond.
- Ignoring the human cost of frequent night-time pages.
Before shipping any new alert, ask: Is it actionable? Is it urgent? Is it real? If the honest answer to any of those is “no,” it belongs on a dashboard or in a ticket queue — not on someone’s phone at 3am.
17 · REAL-WORLD & INDUSTRY EXAMPLES
How The Biggest Operators Alert
Google (SRE practice)
Popularised symptom-based, SLO-driven alerting through its Site Reliability Engineering book — alert on user-facing pain, not every internal wobble.
Netflix
Uses automated anomaly detection across thousands of microservices, combined with automated remediation (like instance replacement) before a human is even paged.
Amazon
Heavy use of CloudWatch alarms tied directly to auto-scaling, so many “alerts” trigger automatic fixes rather than waking someone up.
Uber
Built custom internal alerting on top of open-source metrics pipelines to handle massive scale and regional routing complexity across its global operations.
A common thread across all of these: as companies grow, they shift from “alert on everything” toward “alert on what actually harms users or the business,” backed by strong automation for anything that can be safely self-healed.
18 · FAQ
The Questions That Come Up Again And Again
Is an alert the same thing as an error log?
No. An error log is a record that something happened. An alert is a decision, made by a rule, that the situation matters enough to notify someone. Not every error should generate an alert, and some alerts (like slow response times) are not triggered by errors at all.
What is the difference between monitoring and alerting?
Monitoring is the broader practice of collecting and observing data about your systems (dashboards, metrics, logs). Alerting is one specific output of monitoring: the automated act of notifying someone when that data crosses a meaningful line.
Why do alerts sometimes “flap”?
Flapping happens when a metric hovers right around the threshold, repeatedly crossing back and forth. It is usually fixed by adding hysteresis (different thresholds for firing vs. resolving) or a longer “for” duration.
Should every alert page someone immediately?
No. Only alerts that are urgent, actionable, and represent real user or business impact should interrupt a human immediately. Lower-severity issues are often better routed to a ticket or dashboard for review during working hours.
What is “alert fatigue”?
It is the natural human response to receiving too many alerts, especially false or unhelpful ones — people start ignoring or dismissing alerts without properly checking them, which is dangerous when a real incident finally does occur.
On-call burnout and alert fatigue are recognised workplace wellbeing concerns. If constant paging is affecting someone’s sleep, health, or mental wellbeing, that is worth raising directly with a manager or HR — it is a legitimate operational and human issue, not just a technical inconvenience.
19 · SUMMARY & KEY TAKEAWAYS
What To Remember Long After You Close This Tab
An alert, in monitoring terms, is an automated signal that tells a human (or another system) that something being measured has crossed a meaningful line — and that it deserves attention. It is built from a chain of components: metrics flow into a time-series database, rules evaluate that data on a schedule, and when a condition holds true for long enough, a notification travels through routing and escalation logic until it reaches the right person.
Good alerting is not about catching everything — it is about catching what matters, quickly, without drowning the people responsible for fixing things in noise. That balance between sensitivity and signal-to-noise ratio is the central design challenge of every alerting system, from a two-server hobby project to Netflix’s global infrastructure.
Key takeaways
- An alert = a metric or event + a threshold + a duration, evaluated automatically.
- Alerts move through a lifecycle: OK → Pending → Firing → Acknowledged → Resolved.
- Every alert should be actionable, urgent, and real — otherwise it is just noise.
- Alerting systems must themselves be highly available — you cannot afford blind spots during an outage.
- Modern best practice favours symptom-based and SLO-based alerting over alerting on every internal metric.
- Alerting infrastructure has real security and human-wellbeing implications, not just technical ones.