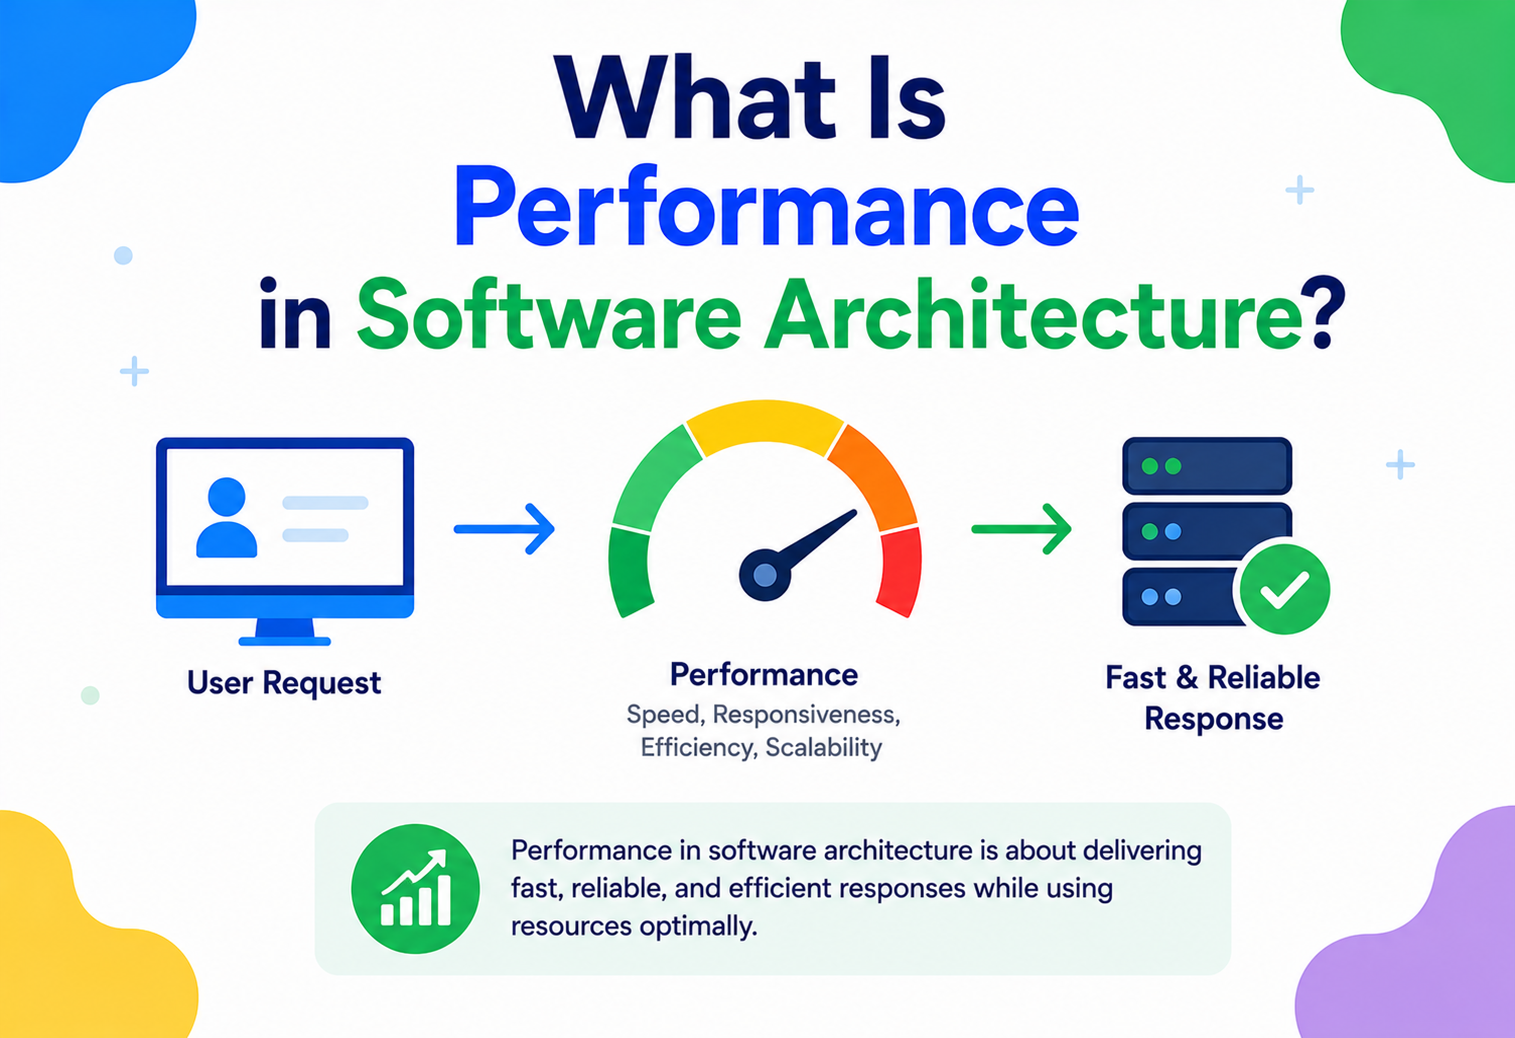
Performance in Software Architecture
A beginner-friendly, end-to-end tutorial on why performance is a first-class architectural concern — not something you bolt on at the end — covering theory, internals, trade-offs, and real production practice with Java and Spring Boot examples.
Why Performance Is an Architectural Concern
Performance is not a feature you sprinkle on at the end — it is the discipline of designing a system’s kitchen (its structure, workflow, staffing) so that correct answers arrive fast, reliably, and at a cost the business can afford.
Picture two restaurants serving the exact same menu. One kitchen gets your food to you in five minutes; the other takes forty. Both technically “work” — but only one keeps customers coming back. Software behaves the same way. Two systems can produce identical, correct results, yet one feels instant while the other feels broken. That difference is performance, and in software architecture, performance is the discipline of designing a system so that correct answers arrive fast, reliably, and at a cost the business can actually afford.
Performance as an architectural concern is almost as old as computing itself. In the 1960s and 70s, mainframe engineers obsessed over CPU cycles and memory bytes because hardware was scarce and expensive — every single instruction mattered. As hardware got cheaper in the 80s and 90s, attention shifted toward software structure: how you organized a program mattered as much as how tightly you wrote each line. The rise of the web in the late 1990s introduced a brutal new teacher — the impatient user on the other end of a slow connection — and performance became inseparable from user experience.
Today, in the era of cloud computing, mobile devices, and globally distributed users, performance is a full architectural pillar sitting alongside security, availability, and maintainability. A system that is slow at scale is, for practical purposes, a system that does not work. The same team that would never dream of shipping without security review or availability planning still, distressingly often, ships without any explicit performance budget — and pays for it in production a few months later.
Performance in software architecture is how well a system uses time and resources (CPU, memory, network, disk) to do useful work under real-world load, without falling over.
Two restaurants, one menu, two experiences. The one that seats you, takes your order, and delivers hot food in five minutes has designed its kitchen — its layout, station assignments, and prep flow — for performance. The other has “correct food” too, but the invisible plan behind it cannot keep up with a full dining room. Software architects are, in this analogy, the people who design the kitchen — long before the first plate goes out.
It is worth spelling out one more thing here: performance is not the same as raw speed on a developer laptop. A function that returns in 4 milliseconds when called once, alone, on your machine can behave very differently under a hundred concurrent users on a shared server hitting a shared database. This is why performance in an architectural sense always means “under real load, in the real environment” — not “in a benchmark on my MacBook.” That distinction alone eliminates a huge fraction of the misdiagnoses that show up in production incidents.
Why It Deserves Its Own Chapter
Performance problems are rarely fixable later without expensive redesign — because some of them are baked into the architecture itself, not the code sitting on top of it.
Why does performance deserve its own architectural chapter instead of being treated as “an optimization we do later”? Because most performance problems are not fixable later without expensive redesign. If you build a house on a foundation meant for one story, you cannot simply “optimize” your way up to six floors — you have to tear things down and start over. Software is similar: a system built with a single database and a synchronous, request-per-thread model can be tuned and tweaked, but past a certain point it hits a structural ceiling that no amount of code-level micro-optimization can lift.
The Core Motivations
- User expectations: Study after study confirms that users abandon a page or app if it takes more than a few seconds to respond. Slowness directly costs revenue, sign-ups, and retention — and users rarely tell you why they left; they just do not come back.
- Cost efficiency: Inefficient systems need more servers to do the same amount of work, which means higher cloud bills for the same business value delivered. In cloud-native architectures, poor performance is directly visible on the invoice.
- Scale readiness: A system that works fine for 100 users may completely collapse at 100,000 users if it was not architected with growth in mind — and the moment of that collapse is usually the worst possible time to be redesigning it.
- Competitive advantage: In many markets, the faster product wins even when it has fewer features. Search, checkout, and streaming are all categories where perceived speed decisively shapes market share.
Teams often treat performance as a “we’ll fix it when it becomes a problem” item. But some performance decisions — like choosing a synchronous, tightly-coupled monolith over an asynchronous, decoupled design — are baked into the architecture and are enormously expensive to unwind later. By the time it “becomes a problem,” the fix is often measured in engineer-quarters, not engineer-hours.
There is also a subtler, human-side motivation. Systems that perform well tend to be systems that were designed with clear reasoning about where work happens, where state lives, and how failure propagates. In practice, teams that invest in performance thinking early end up with architectures that are also easier to reason about, easier to onboard new engineers into, and easier to change safely — because the same discipline that prevents performance disasters (clear boundaries, honest capacity assumptions, explicit trade-offs) prevents a lot of other categories of disaster too.
The Units of Measurement
Before going further, let’s build a shared vocabulary. Think of these as the “units of measurement” that every serious performance conversation is built on.
Latency
Latency is how long a single operation takes from start to finish — the time between ordering food and it arriving at your table. It is usually measured in milliseconds (ms), and in production settings it is reported as a distribution rather than a single number, because two systems with the same average latency can feel wildly different in practice.
Throughput
Throughput is how much work a system can do in a given window of time — how many meals a kitchen can serve per hour. It is usually measured in requests per second (RPS) or transactions per second (TPS), and it tends to be capped by whichever resource (CPU, database connections, network bandwidth) runs out first.
A single-lane road might have low latency (no waiting) when empty, but low throughput (few cars per minute). A ten-lane highway has higher throughput but might have slightly higher per-car latency due to merging and traffic lights. Architecture is often about choosing the right balance for your situation, not maximizing one at the expense of the other.
Percentiles (P50, P95, P99)
Averages lie. If 99 users get a response in 50ms and 1 user waits 10 seconds, the arithmetic average looks fine — but that one user had a terrible experience. Percentiles tell you the real distribution: P50 (median) is the typical experience, P95 means 95% of requests were faster than this value, and P99 captures the “unlucky” tail — often exactly where the worst bugs and worst customer complaints hide.
At scale, P99 is not a rare edge case. If your system serves 10 million requests a day, P99 means 100,000 requests a day fell into that slowest 1%. Those are not hypothetical users — they are real people, and they are the ones most likely to complain publicly.
Scalability
Scalability is a system’s ability to handle growing load by adding resources. Vertical scaling means making one machine bigger (more CPU, more RAM). Horizontal scaling means adding more machines that share the load. Vertical is simpler; horizontal has a much higher ceiling and inherently improves fault tolerance.
Resource Utilization
This is how efficiently a system uses CPU, memory, disk I/O, and network bandwidth. High utilization is not automatically good — a CPU pinned at 100% might mean efficiency, or it might mean you are one small traffic spike away from an outage because there is no headroom left to absorb the surge.
Bottleneck
A bottleneck is the single slowest component that limits the speed of the entire system — the narrowest point in a funnel. Improving anything else will not help until you widen the bottleneck itself, which is why the very first step in any real performance investigation is identifying the bottleneck, not guessing at it.
Imagine a factory line where each station takes: 2s, 3s, 15s, 4s, 2s per item. Total throughput is limited by that 15s station — the bottleneck. Optimizing any other station from 4s down to 1s does nothing for total throughput. Only widening the 15s station moves the needle. In software, the “15s station” is often a database query, an external API call, or a shared lock — and everything else you optimize before finding it is largely wasted effort.
The Anatomy of a Performance-Sensitive System
Performance is not a single knob — it emerges from how several architectural layers interact. Here is the typical anatomy of a system designed with performance in mind.
Key Components
CDN / Edge Cache
Serves static and cached content close to the user, dramatically cutting network round-trip time — a request served from an edge cache never touches your origin infrastructure at all.
Load Balancer
Distributes incoming traffic across multiple servers so no single machine is overwhelmed, and quietly removes unhealthy instances from rotation via health checks.
Application Layer
Runs business logic; its threading model, algorithms, and I/O behavior directly determine both latency and throughput per instance.
Caching Layer
Stores frequently accessed data in fast memory (e.g., Redis, Memcached) to avoid expensive recomputation or repeat database hits for the same query.
Database
Often the ultimate bottleneck; indexing strategy, query design, and replication topology are critical performance decisions that live in this layer.
Message Queue
Decouples slow or bursty work from the request path, smoothing out load spikes and letting the user get a fast synchronous response while heavy work happens later.
The important thing to notice is that no single component in this diagram is doing performance work alone. The CDN handles “never let this request touch the origin,” the load balancer handles “spread traffic evenly across healthy instances,” the cache handles “never hit the database twice for the same answer,” and the queue handles “never make the user wait for work that can happen later.” Each layer solves a specific class of problem, and skipping any one of them tends to create a bottleneck that no amount of tuning in the other layers can rescue you from.
What Actually Happens on a Fast (or Slow) Request
Let’s zoom into what actually happens, cycle by cycle, when a request is “slow” or “fast.” At the lowest level, performance is governed by how efficiently a program uses the CPU, memory hierarchy, and I/O devices.
The Memory Hierarchy
CPUs have several layers of storage, each dramatically slower — but larger — than the last: CPU registers (fastest, tiny), L1/L2/L3 cache (very fast, small), RAM (medium speed, larger), and disk or network storage (slowest, largest). A well-performing program keeps “hot” data as close to the CPU as possible. This is exactly why in-memory caches like Redis can be 100–1000× faster than hitting a database on disk — they are physically closer to the CPU in the storage hierarchy.
Concurrency Models
How a system handles multiple requests at the same time has enormous performance implications. The three models below dominate real production systems, and each has a very different sweet spot:
| Model | How it works | Trade-off |
|---|---|---|
| Thread-per-request | Each incoming request gets a dedicated OS thread | Simple and intuitive, but threads are expensive; does not scale to very high concurrency |
| Event loop / async | A small pool of threads handles many requests via non-blocking I/O | Highly scalable for I/O-bound work, but harder to reason about and debug |
| Actor model | Independent “actors” communicate only via messages, never shared state | Excellent isolation and concurrency; added conceptual complexity |
A Simple Java Example: Blocking vs Non-Blocking
// Blocking (thread-per-request) style — simple but doesn't scale well
public String fetchUserProfile(String userId) {
    // This thread sits idle waiting on the database call
    return database.query("SELECT * FROM users WHERE id = ?", userId);
}

// Non-blocking style using CompletableFuture — frees the thread while waiting
public CompletableFuture<String> fetchUserProfileAsync(String userId) {
    return CompletableFuture.supplyAsync(() ->
        database.query("SELECT * FROM users WHERE id = ?", userId)
    );
}
In the blocking version, if the database takes 200ms to respond, that thread is frozen for 200ms doing nothing useful. Under high load, you run out of threads and requests start queuing behind them. The async version frees the thread to do other work while the query is in flight, letting a small pool of threads serve thousands of concurrent requests — the exact same code path, but a fundamentally different concurrency posture.
Modern Java (Project Loom’s virtual threads, introduced as a permanent feature in Java 21) attempts to give you the simplicity of thread-per-request with much of the scalability of async. Frameworks like Spring Boot, Micronaut, and Quarkus increasingly offer both models, and the “right” one depends on whether your workload is I/O-bound (async wins) or CPU-bound (either model is fine).
Where Time Actually Goes
When a request is slow, the time is usually not spent in the “interesting” parts of your code. Common time-sinks, roughly in order of frequency in real systems, are: waiting on a database query (especially an unindexed one), waiting on a downstream HTTP call to another service, waiting on a lock or connection pool, blocking on disk I/O for logging, and only then — much further down the list — actual CPU-bound computation. This is why profiling before optimizing is not just good hygiene; it is the difference between fixing the real problem and spending a week making an already-fast function 5% faster while the real bottleneck sits untouched.
Tracing a Single Request End-to-End
Let’s trace a single request end-to-end to see where time is spent — and where architects intervene to shave it down.
Every arrow in that diagram represents a chance to add — or remove — latency. Architects reduce total request time by shortening the path (fewer hops), parallelizing steps that are independent of each other, and pushing work as close to the edge (the user) as possible so it never has to travel back to a central data center at all.
Two subtleties are worth calling out. First, network hops are almost always more expensive than in-process function calls — even a 1ms intra-datacenter hop is thousands of times slower than a local method call, and a cross-continent hop can be 100+ milliseconds all by itself. This is why microservice architectures require deliberate design to avoid death by a thousand tiny network calls. Second, the cache-hit path in the diagram above bypasses the database entirely; a well-tuned cache with a 95% hit rate means the database only sees 5% of the traffic it otherwise would, which is often the single largest lever available for stretching an existing database further before having to scale it.
Performance Rarely Comes for Free
Performance rarely comes for free — it is usually traded against something else. Understanding those trade-offs consciously is the heart of good architectural judgment.
✓ Benefits of Performance-First Design
- Better user retention, engagement, and conversion
- Lower infrastructure cost per unit of business work delivered
- Higher ceiling for future growth without emergency rewrites
- Fewer cascading failures when the system is under real-world load
✗ Costs & Risks
- Added complexity (caching layers, async code paths, sharding)
- Harder debugging (race conditions, eventual consistency, tricky reproduction)
- Premature optimization wastes engineering time on non-bottlenecks
- Some optimizations reduce code readability and long-term maintainability
The Classic Trade-off Triangle
Architects constantly balance consistency, availability, and performance. For example, strongly consistent systems (where every read sees the very latest write) are often slower because they must coordinate across nodes before returning. Eventually consistent systems are faster and more available but may briefly return slightly stale data. Neither is “wrong” — the right choice depends entirely on whether your data is a bank balance (needs strict consistency), an inventory count (needs mostly-fresh consistency), or a social media like-count (can tolerate a short delay without anyone noticing or caring).
This tension is why premature performance optimization can hurt as much as ignoring performance entirely. A small startup that adds elaborate caching, sharding, and async pipelines on day one is often paying a permanent complexity tax for a scale it may never reach — while a startup that ships a straightforward monolith today and layers in performance work as real traffic data justifies it typically ends up with a simpler, more understandable system for years. The trick is to avoid decisions that would make future performance work actively impossible (like storing session state only in local memory, or picking a database schema with no reasonable future shard key), while not front-loading complexity you have not yet earned.
The Concrete Levers Architects Pull
Once you understand the fundamentals, here are the concrete levers architects actually reach for — each solving a different class of bottleneck.
Caching
Store the result of expensive work so you do not have to repeat it. Caches can live in the browser (least effort for you, biggest latency win for the user), at the CDN edge (fast for the whole planet), in an application-level cache like Redis (shared across your instances), or even inside the database itself (query cache, result cache). A single well-placed cache is very often the highest-leverage performance change any team can make.
Horizontal Scaling & Load Balancing
Instead of one giant server, run many smaller identical servers behind a load balancer. This also improves fault tolerance — one server dying does not take down the whole system, because the load balancer notices via health checks and simply stops routing to it. Horizontal scaling is essentially unbounded (you can keep adding more machines), whereas vertical scaling has a hard ceiling at whatever the biggest available machine happens to be.
Database Indexing
-- Without an index, this scans every row in the table (slow at scale)
SELECT * FROM orders WHERE customer_id = 42;

-- Adding an index turns a full table scan into a fast lookup
CREATE INDEX idx_orders_customer_id ON orders(customer_id);
Indexes are one of the few “free” wins in performance work — the cost is a small amount of extra storage and slightly slower writes, in exchange for reads that go from linear-time table scans to near-constant-time lookups. On any table larger than a few thousand rows, this difference is not a small percentage improvement; it is often several orders of magnitude.
Asynchronous Processing & Queues
Move slow, non-urgent work (sending welcome emails, generating PDF invoices, processing uploaded images) off the critical request path and into a background queue. The user gets a fast response immediately (“order received!”), while the actual heavy lifting happens seconds or minutes later on a worker process. This one pattern alone can transform a checkout endpoint’s P95 latency from “painful” to “imperceptible.”
Partitioning & Sharding
Split a huge dataset across multiple databases or nodes based on a key (e.g., user ID range, geographic region, tenant ID), so no single database has to hold or serve everything. Sharding is powerful but adds real complexity — cross-shard queries become significantly harder — so it is generally a lever pulled after simpler options like read replicas and caching have been exhausted.
CAP Theorem in Brief
In a distributed system, when a network partition happens between nodes, you must choose between Consistency (all nodes see the same data) and Availability (the system keeps responding). You cannot have perfect versions of both during a partition — a foundational constraint that shapes how every distributed, high-performance system is designed. Systems built for extreme scale (like Amazon’s DynamoDB or Cassandra) typically favor availability with eventual consistency; systems handling money or inventory (like traditional RDBMS setups) typically favor consistency and accept that they may briefly refuse to serve requests during a network split rather than serve wrong ones.
A Fast System That Crashes Isn’t Performant
A blazing-fast system that crashes under load is not performant — it is fragile. Reliability and performance are deeply linked, and the best systems design for both together.
- Redundancy: Running multiple instances of every critical component so that one failure does not cause an outage. The load balancer routes around it, the surviving instances absorb the traffic, and users often do not even notice.
- Circuit breakers: Automatically stop calling a failing downstream service so it can recover, instead of piling on more requests that add to the pain. Popularized by Netflix’s Hystrix library and now a standard pattern in Spring Cloud, Resilience4j, and Istio.
- Graceful degradation: Serve a simplified or cached response rather than a full failure when a dependency is slow or unavailable. A checkout page that hides the “you might also like” recommendations because the recommendation service is down is vastly better than a checkout page that fails entirely.
- Backpressure: Slow down or reject incoming requests deliberately when the system is overloaded, rather than letting queues grow unbounded and eventually crash everything. Rejecting 10% of requests fast is often much better for overall user experience than serving 100% of requests painfully slowly (or, worse, timing out on all of them).
A “retry storm” happens when a slow service causes clients to time out and retry, multiplying load on the already-struggling service — turning a minor slowdown into a full-blown outage. Good architecture includes retry limits, exponential backoff with jitter, and circuit breakers to prevent this exact cascade, which shows up in a large fraction of real production post-mortems.
It is worth internalizing what those “nines” actually cost. Every additional 9 of availability roughly translates to an order-of-magnitude increase in engineering investment — more redundancy, more sophisticated failover, more rigorous testing, more careful deployment practices. Most consumer applications target 99.9%; systems where downtime directly costs revenue or safety (payments, ad-serving, air-traffic-adjacent) target 99.99% or higher, and pay for it with dedicated site-reliability teams whose full-time job is protecting that number.
Where Performance and Security Actually Meet
Performance and security intersect much more often than most teams expect — from rate limiting to encryption overhead to how cache keys are scoped.
- Rate limiting protects performance for legitimate users by blocking abusive traffic — and doubles as a security control against denial-of-service attacks, credential-stuffing attempts, and scraping. The same throttle that keeps one badly-written client from monopolizing your API also keeps a botnet from monopolizing it.
- Encryption overhead: TLS handshakes and per-request encryption/decryption add latency; architects mitigate this with TLS session resumption, HTTP/2 or HTTP/3 connection reuse, and hardware acceleration — not by skipping encryption. “It’s just internal traffic” is one of the most common excuses for later, painful security incidents.
- Caching sensitive data must be done carefully — caching for speed should never leak private data to the wrong user. Cache keys that include a user identifier, and CDN configurations that respect
Cache-Control: private, are essential; getting this wrong can turn a “performance win” into a headline-grade data leak. - Denial of Service (DoS): Systems designed without capacity limits or backpressure are themselves a security vulnerability, since a burst of traffic (malicious or not) can take them down. A genuinely scalable architecture, ironically, is also a genuinely large attack surface if not paired with cost alerting and rate limits — cloud auto-scaling can happily bankrupt you absorbing an attack you would rather have blocked at the edge.
Never sacrifice security fundamentals purely for speed (e.g., skipping input validation “to save time” on the hot path). The right approach is to make secure operations fast, not to make fast operations insecure. Argon2 password hashing, TLS 1.3, and JWT verification can all be made fast enough; skipping any of them is not an optimization, it is a bug waiting to be exploited.
You Cannot Improve What You Cannot Measure
You cannot improve what you cannot measure. Performance-aware architectures build observability in from day one, not after the first incident.
The Three Pillars of Observability
- Metrics: Numeric time-series data (CPU usage, request count, latency percentiles) — good for dashboards, alerts, and long-term trend analysis. Prometheus + Grafana is the canonical open-source combination.
- Logs: Detailed records of individual events — good for debugging specific incidents after the fact. Structured (JSON) logs shipped to a centralized system like ELK or Loki are hugely more useful than raw text files scattered across servers.
- Traces: Follow a single request as it travels across multiple services — essential for pinpointing exactly where time is lost in a microservices system. OpenTelemetry has become the de facto standard for instrumenting traces portably across Jaeger, Zipkin, and commercial backends.
// Simple example: timing a critical operation in Java
long start = System.nanoTime();
processOrder(order);
long durationMs = (System.nanoTime() - start) / 1_000_000;
metricsClient.recordLatency("order.process.duration", durationMs);
A useful mental framework many production teams adopt is the RED method (Rate, Errors, Duration) for services, paired with the USE method (Utilization, Saturation, Errors) for underlying resources. Rate and Duration give you the “what does the user experience?” view; Utilization and Saturation give you the “how close is this component to falling over?” view. Setting proactive alerts on saturation trends — queue depth growing, connection pool nearing exhaustion, memory heading toward the ceiling — tends to give the earliest warning that a performance wall is approaching, often minutes or hours before end-user latency visibly degrades. That lead time is exactly what separates a calm scheduled fix from a 3 AM incident page.
Where and How a System Runs Shapes Its Ceiling
Where and how a system runs shapes its performance ceiling. Cloud platforms provide extraordinary levers — and equally extraordinary ways to misuse them.
- Auto-scaling: Cloud platforms can automatically add or remove server instances based on real-time load, keeping performance stable during traffic spikes without over-paying during quiet periods. AWS Auto Scaling Groups, Google Cloud managed instance groups, and Kubernetes’ Horizontal Pod Autoscaler are the mainstream implementations.
- Multi-region deployment: Placing servers closer to users around the world cuts network latency significantly. A user in Singapore hitting a server in Singapore sees roughly 20–30ms round-trip; the same user hitting a server in Virginia sees 200ms+ — a difference big enough that no amount of application-level tuning can compensate.
- Containers & orchestration: Tools like Kubernetes, ECS, and Nomad make it fast and reliable to scale services up or down and recover from failures automatically. Container images also give you reproducible deployments, which indirectly protects performance by eliminating “it was faster on staging” mysteries caused by drift between environments.
- Cold starts: Serverless functions (AWS Lambda, Google Cloud Functions, Azure Functions) can introduce latency spikes when spinning up a new instance from nothing — an important trade-off between operational simplicity and predictable low-latency response. For predictable performance under load, provisioned concurrency, warm-up strategies, or container-based alternatives (like AWS Fargate) are worth considering.
Netflix deploys across multiple AWS regions and runs Open Connect, its own purpose-built CDN, to cache video content physically close to internet service providers worldwide. This is primarily a performance decision (reduces streaming start latency, keeps playback smooth even on modest home connections) that carries a large secondary scalability benefit — it offloads enormous bandwidth demand away from centralized origin servers, letting the core platform scale to serve hundreds of millions of subscribers simultaneously.
The Three Layers Where Most Real Tuning Happens
Databases, caches, and load balancers are the three layers where performance work actually pays off — and where most real production incidents originate.
Read Replicas
Databases can maintain copies (replicas) that handle read traffic, while a primary node handles writes — spreading load and improving read performance without changing your data model. In most business applications, reads outnumber writes by a very wide margin (often 10:1 or more), so scaling reads independently gets you a lot of mileage for relatively low complexity cost.
Cache Invalidation
“There are only two hard things in Computer Science: cache invalidation and naming things.” — Phil Karlton. Knowing exactly when cached data has become stale and needs refreshing is genuinely tricky; get it wrong and users see outdated information (or, worse in some domains, incorrect prices or inventory counts). Time-to-live (TTL), explicit invalidation on write, and write-through caching each solve part of the problem but come with their own trade-offs.
@Service
public class ProductService {

    private final RedisTemplate<String, Product> redis;
    private final ProductRepository repository;

    public ProductService(RedisTemplate<String, Product> redis, ProductRepository repository) {
        this.redis = redis;
        this.repository = repository;
    }

    public Product getProduct(String productId) {
        String cacheKey = "product:" + productId;
        Product cached = redis.opsForValue().get(cacheKey);
        if (cached != null) {
            return cached; // cache hit: sub-millisecond win
        }
        Product product = repository.findById(productId)
                .orElseThrow(() -> new ProductNotFoundException(productId));
        redis.opsForValue().set(cacheKey, product, Duration.ofMinutes(10));
        return product;
    }
}
Load Balancing Algorithms
| Algorithm | How it Works |
|---|---|
| Round Robin | Requests distributed evenly in rotation across all healthy instances; simple and assumes each request is roughly equal cost |
| Least Connections | Sends traffic to whichever server currently has the fewest active requests; better when request costs are uneven |
| Weighted | More powerful servers get proportionally more traffic, based on operator-assigned weights |
| Consistent Hashing | Requests with the same key (e.g., user ID) go to the same instance consistently; excellent for cache locality |
Choosing among these is less exciting than it sounds — for most web applications, plain round robin or least-connections behind a managed load balancer (AWS ALB, GCP Load Balancing, NGINX, HAProxy) is completely fine and needs almost no tuning. Consistent hashing becomes valuable when you have a per-user or per-tenant in-memory cache and want to maximize hit rate by routing the same user consistently to the same instance.
Independent Scaling, at a Latency Cost
Breaking a monolith into microservices can improve performance by letting teams scale only the parts that need it — but it also introduces network calls where there used to be simple function calls, which can add latency if not designed carefully.
API Design for Performance
- Pagination: Never return an unbounded list. Always limit and paginate results, either with page/offset semantics or cursor-based pagination for very large datasets. An unbounded “get all orders” endpoint is a production incident waiting to happen the day a big customer signs up.
- Batching: Let clients request multiple resources in one call instead of many round trips. GraphQL and REST endpoints that accept arrays of IDs both address this — and both dramatically reduce the total number of network hops for a given user action.
- Compression: Gzip or Brotli responses to cut payload size and transfer time. Modern browsers and HTTP clients handle this transparently; enabling it on your server is usually one config flag for a very large network-time win.
Independent scalability comes at a real per-request performance cost: a single user action like “place order” may now involve calling the Order Service, then the Inventory Service, then publishing an event for the Payment Service — each network hop adds latency that did not exist in a single in-process function call inside a monolith. The rule of thumb: use synchronous inter-service calls only where the caller genuinely needs the result to respond, and push everything else (audit logs, notifications, analytics events, side-effect updates) onto an asynchronous message bus so that the request path stays short.
Names for the Recurring Shapes
Certain patterns and anti-patterns appear so often in performance discussions that naming them is genuinely valuable — it lets a team communicate a diagnosis in seconds instead of reconstructing it from scratch under incident pressure.
Helpful Patterns
- CQRS (Command Query Responsibility Segregation): Separate the code and data paths for writing data and reading data, optimizing each independently. Reads can use denormalized, cache-friendly views; writes can use normalized, consistent models.
- Bulkhead: Isolate resources (like thread pools) per dependency so that one slow downstream service cannot exhaust the resources needed by all the others — the name comes from watertight compartments in ships, where a breach in one section does not flood the whole vessel.
- Lazy loading: Only load data or initialize objects when they are actually needed, rather than eagerly hydrating everything on startup or request entry. Especially useful for optional fields, related entities, and expensive computed values.
- Cache-aside: Check the cache first, fall back to the source of truth on miss, and populate the cache on the way back. The pattern used in the Spring Boot example a couple of chapters ago — simple, robust, and dominant in real production caching.
Anti-patterns to Avoid
The N+1 query problem — fetching a list, then making a separate database query for each item in a loop — quietly turns one fast query into hundreds of slow ones as data grows. It is one of the most common performance regressions in ORM-based codebases (Hibernate, Entity Framework, ActiveRecord), and it often only becomes visible in production, at exactly the wrong moment.
// Anti-pattern: N+1 queries — 1 query for the list, N more for each item
for (Order order : orders) {
    Customer c = database.query(
        "SELECT * FROM customers WHERE id = ?", order.customerId);
    // ... use c ...
}

// Better: fetch all related data in one batched query
List<Long> customerIds = orders.stream()
    .map(Order::getCustomerId)
    .distinct()
    .toList();
List<Customer> customers = database.query(
    "SELECT * FROM customers WHERE id IN (?)", customerIds);
Other patterns worth watching for: chatty microservices that call each other for every trivial piece of data instead of batching, premature sharding that adds distributed-systems complexity to solve a load that a single well-indexed database could handle for years, and sticky sessions as a permanent architectural choice instead of a temporary migration crutch (they undermine the statelessness that makes horizontal scaling actually work).
Habits That Separate Calm Teams from Panicked Ones
The gap between teams that ship reliably at scale and teams that firefight in production is rarely a single technique. It is a small set of habits, practiced consistently over time.
Measure before optimizing
Profile first; guessing where the bottleneck lives wastes engineering effort on the wrong fix. Real profilers (async-profiler, JFR, py-spy, Chrome DevTools) find the truth in minutes that a week of speculation will not.
Set performance budgets early
Define target latency and throughput as a hard requirement, not an afterthought. “P95 under 300ms at 500 RPS” is an engineering artifact you can test against and hold the line on; “it should feel fast” is not.
Design for horizontal scale from day one
Avoid architectural choices that hard-cap you to a single machine — local session state, per-instance filesystems, in-process schedulers. These are cheap to build in early and painfully expensive to retrofit under production pressure.
Load test regularly
Simulate realistic traffic in staging before it hits production, not after. Tools like Gatling, k6, JMeter, and Locust are all mature options; the specific tool matters far less than the habit of running the tests before every major release.
Avoid premature optimization
Do not micro-optimize code paths that are not actually bottlenecks — focus effort where measurement proves it will matter. Donald Knuth’s original quote (“premature optimization is the root of all evil”) is aimed exactly at this failure mode.
One final habit worth mentioning: review latency dashboards and capacity trends on a regular, boring cadence — weekly or monthly, not just after an incident. Teams that do this catch performance regressions and approaching scalability walls while the fix is a small code change or a scheduled infrastructure adjustment, rather than an emergency war room in the middle of a traffic spike. The most well-run production systems are almost never built by heroes; they are built by teams that quietly do the unglamorous work of watching the numbers and acting on them early.
How the Giants Actually Do It
A quick tour of how four well-known operators treat performance as a first-class architectural concern — each with a slightly different emphasis suited to their business.
Netflix
Uses extensive caching, CDN edge delivery via its own Open Connect network, and chaos engineering (Chaos Monkey and successors) to keep video streaming fast and resilient even when individual backend services fail in production. Adaptive bitrate streaming is itself a performance technique — the player adjusts quality in real time to keep playback smooth on the connection you actually have.
Amazon
Famously found that every 100ms of added latency measurably reduced sales, driving deep, sustained investment in low-latency architecture across their retail platform — from a service-oriented architecture that lets independent teams optimize their own critical paths, to aggressive use of edge caching, to internal performance budgets treated with the same seriousness as security review gates.
Pioneered techniques like BigTable and MapReduce specifically to process massive datasets with high throughput across thousands of commodity machines. Modern successors (Spanner, Colossus, Borg — the predecessor of Kubernetes) show how far “performance at planet scale” can be pushed when the entire stack is designed around it from the silicon up.
Uber
Relies on geo-partitioned data (built on Google’s S2 geometry library) and real-time systems to match riders and drivers within seconds across a global footprint. Partitioning the world geographically means scaling happens per-city rather than as one giant global bottleneck — a design choice that keeps dispatch latency low even during massive localized spikes like New Year’s Eve or a stadium letting out.
Across all four, one pattern repeats: performance is treated as a full engineering discipline with its own metrics, its own review gates, and often its own specialists — not as an afterthought or a “polish pass” before launch. That cultural commitment is a bigger part of the story than any specific technology choice, and it is the part that is genuinely transferable to teams of any size.
Common Questions, and What to Remember
A short round of questions people ask most often about performance in software architecture — followed by a portable summary you can carry into any design review.
Is performance the same as speed?
Speed (latency) is one dimension of performance. Performance also includes throughput, scalability, and resource efficiency — a system can be “fast” for one user but still perform poorly under heavy concurrent load. When someone says “the app is slow,” the very first useful question is: for one user or for many? The answer routes you toward two very different toolboxes.
Should every system be optimized for maximum performance?
No. Over-engineering for performance you do not need adds real complexity and cost. Architects should match performance investment to real, measured requirements — a batch report that runs overnight has completely different constraints from a checkout API that runs on the critical user path.
How early should performance be considered in a project?
From the very first architectural decisions — especially the data model, the concurrency model, and whether the system needs to scale horizontally — because these are the hardest things to change later. Everything else (algorithm tuning, caching layers, index additions) can be layered on top gradually as real traffic data justifies it.
What’s the difference between vertical and horizontal scaling?
Vertical scaling upgrades a single machine’s resources (bigger CPU, more RAM); horizontal scaling adds more machines that share the load. Horizontal scaling generally offers a much higher long-term ceiling and inherently better fault tolerance, but requires stateless design and load balancing to work well.
Does caching solve every performance problem?
Caching is one of the highest-leverage performance techniques, but it does not fix a fundamentally slow write path, an unindexed query that is unavoidably issued, or a chatty microservice topology that makes ten network hops per user action. Cache what makes sense to cache; fix the underlying inefficiency for everything else.
How do I know if my bottleneck is CPU, I/O, or something else?
Use a real profiler under load. On the JVM, async-profiler or Java Flight Recorder will tell you exactly where CPU time is spent and where threads are blocked waiting. On the OS, tools like iostat, vmstat, and top reveal whether the constraint is disk, memory, or CPU. Guessing wastes weeks; measuring answers the question in minutes.
Key Takeaways
- Performance is not a feature you add at the end — it is a property that emerges from foundational architectural decisions about how data flows, how components communicate, how work is distributed, and how failures are contained.
- Performance = latency + throughput + scalability + resource efficiency, measured under real load, not on a developer laptop.
- Percentiles (P95, P99) reveal the truth that averages hide — and at scale, even the “rare” tail affects a large absolute number of real users every day.
- Caching, asynchronous processing, and horizontal scaling are the core levers architects use across almost every high-performance system.
- Performance always trades off against consistency, complexity, and cost — there is no free lunch, only trade-offs made deliberately (or made accidentally, and paid for later).
- Reliability and observability are inseparable from performance in production systems — a fast system that crashes under load is not performant.
- Measure first, optimize second, and design for scale before you desperately need it — the cheapest performance work is the work that never becomes an emergency.
Performance in software architecture is the discipline of designing systems so that correct answers arrive fast, reliably, and affordably under real load — and it is a full engineering pillar, not an afterthought bolted on before launch.
If you take one habit away from this guide, let it be this: before proposing a fix for a slow or struggling system, spend five minutes classifying the symptom. Is it slow for one request under light load, or does it only degrade as concurrent load rises? Is the bottleneck CPU, I/O, network, or coordination? That short pause routes you toward the right toolbox — algorithms, indexes, and caching on one side; load balancing, statelessness, and partitioning on the other — and saves the far more expensive mistake of solving the wrong problem exceptionally well.

