What Is a Load Testing Tool Used For?
A beginner-friendly, deep-dive tutorial into how load testing tools work, why every serious engineering team relies on them, and how to use them the right way in production systems.
Introduction & History — What Is Load Testing, Really?
Imagine a restaurant that normally serves 20 customers an hour. One day, a food blogger posts a glowing review, and suddenly 500 people show up at once. The kitchen can’t cook fast enough, waiters can’t take orders, and the whole place grinds to a halt. That’s exactly what happens to a website or app when too many people use it at the same time without the system being ready for it.
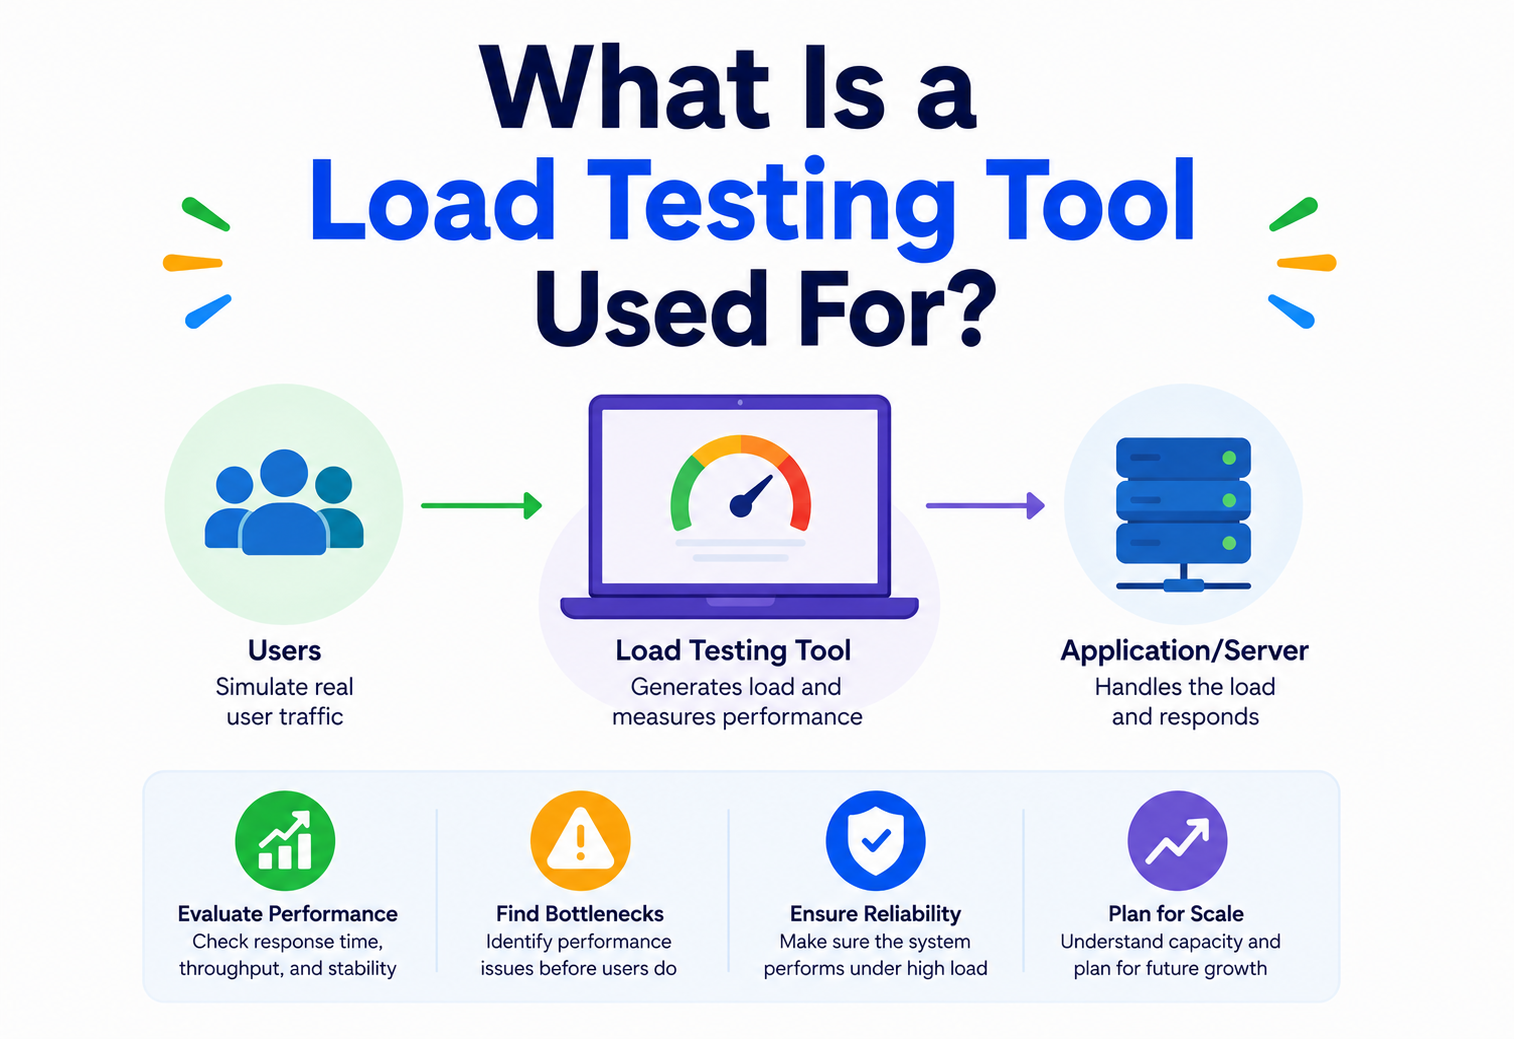
A load testing tool is software that simulates many users hitting an application at once — before real users do it for you. It’s used to answer one simple but critical question: “Will my system survive when a lot of people use it at the same time?” Instead of finding out the hard way (during a big product launch, a Black Friday sale, or a viral moment), engineers use load testing tools to create that pressure on purpose, in a controlled environment, and watch how the system behaves.
Think of it like a car crash test. Car manufacturers don’t wait for real accidents to learn if a car is safe — they deliberately crash test cars in a lab, measure the damage, and fix weaknesses before the car ever reaches a customer. Load testing tools do the same thing for software: they crash-test your application against traffic, on purpose, so you can fix the weak points before real users find them.
A load testing tool is a piece of software that pretends to be many real users at once, hammers your application with a controlled amount of traffic, and reports back exactly how the system behaved — how fast it responded, how many requests it dropped, and where it started to strain.
1.1 A short history
Load testing didn’t start with fancy tools. In the early days of computing (1970s–1980s), engineers tested mainframe systems manually, running scripted jobs and watching resource usage on physical dials and printouts. As client-server applications grew in the 1990s, tools like Mercury LoadRunner (later part of Micro Focus) emerged as some of the first dedicated commercial load testing products, letting teams simulate hundreds of virtual users against a system.
The rise of the web in the late 1990s and 2000s changed everything. Websites had unpredictable, global audiences, and open-source tools like Apache JMeter (first released in 1998) made load testing accessible to everyone, not just large enterprises with big budgets. In the 2010s, as cloud computing and microservices became the norm, newer tools like Gatling, Locust, and k6 arrived, built specifically for cloud-scale, developer-friendly, code-based load testing that fits into modern DevOps pipelines.
1970s–1980s: Manual & scripted testing
Engineers manually scripted repetitive jobs on mainframes to observe resource limits, watching physical dials and printouts for signs of strain.
1990s: Commercial load testing tools
Tools like LoadRunner brought structured virtual-user simulation to enterprise software testing, formalising what had been an ad-hoc practice.
1998: Apache JMeter released
Open-source load testing became mainstream, democratising access for all teams — from solo indie developers to Fortune 500 platforms.
2010s: Cloud-native tools emerge
Gatling, Locust, and k6 bring code-first, CI/CD-friendly load testing built for the cloud era, replacing GUI-heavy workflows with scripts kept in version control.
2020s: Load testing as code + AI-assisted analysis
Load tests now run automatically in pipelines, with smarter tools analysing results, spotting anomalies, and even predicting bottlenecks before they hit production.
The Problem & Motivation — Why Do We Even Need Load Testing?
Software can work perfectly for one user and completely collapse for a thousand. That’s because performance problems are often invisible until there’s real pressure on the system. Load testing tools exist to expose these problems early, in a safe environment, rather than in front of real customers.
2.1 The core problems load testing solves
- Unknown breaking points: Teams often don’t know how many users their system can handle until it fails. Load testing finds this number on purpose.
- Slow responses under pressure: A page that loads in 200 ms with 10 users might take 8 seconds with 10,000 users. Load testing reveals this before it embarrasses you in production.
- Resource bottlenecks: CPU, memory, database connections, or network bandwidth can run out under heavy load, causing crashes or timeouts — and it’s never the resource you expected.
- Costly downtime: A crash during a major sales event can cost a company millions of dollars in lost revenue and damaged trust — and downtime during a viral moment often costs even more in brand reputation.
- Poor capacity planning: Without load testing, it’s just a guess how many servers you need — you either overpay for unused capacity or underpay and risk outages.
Many famous outages — ticket sale websites crashing during high-demand releases, government portals failing on tax deadline day, retail sites going down on Black Friday — trace back to a lack of proper load testing before the traffic spike hit.
In short: load testing tools exist because hope is not a strategy. Engineering teams need real evidence — not assumptions — that their system can handle the traffic it’s built for. And that evidence has to come from a controlled experiment, not from watching production melt down on the day of a launch.
Core Concepts — Key Terms You Need to Understand
Before going deeper, let’s build a simple vocabulary. Each of these terms will come up again and again in load testing.
Virtual User (VU)
A simulated person the tool creates to act like a real user — clicking, browsing, submitting forms — but done by a script, not a human.
Throughput
How many requests the system can handle per second (often called RPS — requests per second, or TPS — transactions per second).
Latency / Response Time
How long it takes for the system to respond to a single request, usually measured in milliseconds.
Ramp-up
Gradually increasing the number of virtual users over time, instead of throwing them all at once — like slowly turning up a faucet.
Think Time
The pause a real user takes between actions (like reading a page before clicking) — simulated so tests behave realistically.
Breakpoint
The exact load level where the system starts failing, slowing down badly, or throwing errors.
Percentile (p95, p99)
A way to measure response times fairly — p95 means 95% of users got a response at least this fast; it ignores rare outliers.
SLA / SLO
Service Level Agreement / Objective — a promise like “99% of requests respond within 500 ms” that load testing helps verify.
3.1 Types of performance testing
“Load testing” is often used as an umbrella term, but there are several distinct types of tests, each answering a different question:
| Test type | What it answers | Analogy |
|---|---|---|
| Load testing | Can the system handle expected normal / peak traffic? | Testing a bridge with the number of cars it’s designed for |
| Stress testing | What happens beyond the expected limit, and how does it fail? | Overloading the bridge until it creaks or breaks |
| Spike testing | Can the system survive a sudden, extreme burst of traffic? | A flash mob suddenly crossing the bridge all at once |
| Soak / endurance testing | Does performance degrade over long periods (memory leaks, etc.)? | Driving the same car nonstop for 48 hours straight |
| Scalability testing | Does adding more servers actually increase capacity linearly? | Adding more toll booths to see if traffic really speeds up |
Think of a water pipe. Load testing checks if the normal flow of water fits fine. Stress testing turns the tap further and further until the pipe bursts, so you know exactly where its limit is. Spike testing is like suddenly opening the tap all the way instantly, to see if the pipe can handle a shock. Soak testing is leaving the tap running for days to see if it leaks over time.
Architecture & Components — How a Load Testing Tool Is Built
Under the hood, nearly every load testing tool — whether it’s JMeter, Gatling, k6, or Locust — shares a similar architecture made up of a few key components working together.
4.1 The main components
Test script / scenario definition
Written in a scripting language (JavaScript in k6, Scala in Gatling, XML in JMeter, or Python in Locust). It defines what actions a virtual user performs — like “log in, browse products, add to cart, check out.”
Load generator (engine)
The core piece that spins up virtual users, sends requests according to the script, and manages timing, concurrency, and ramp-up patterns.
System Under Test (SUT)
The actual application, API, or service being tested — this is your website, backend, or microservice. Every other component in the tool exists to characterise this one.
Results collector
Gathers response times, error rates, throughput numbers, and system resource usage during the test run.
Dashboard / reporting layer
Visualises everything as graphs and tables so humans can quickly spot problems — like a p95 latency spike or a rising error rate.
4.2 Distributed load generation
A single machine can only simulate so many virtual users before it becomes the bottleneck itself (ironically, the testing tool crashes before your app does!). That’s why serious load tests use distributed load generation — spreading the load-generating work across multiple machines, often in the cloud, all coordinated to hit the target system together. A central controller node typically manages the script, distributes it to a fleet of worker nodes, and aggregates their results into a single unified report.
Internal Working — What Happens When You Run a Load Test
Let’s walk through what actually happens, step by step, when you click “Run” on a load test.
Read the script & configuration
The tool parses the test script and configuration (number of users, ramp-up time, duration, target URLs, and any environment variables).
Spawn virtual-user workers
Load generator threads or coroutines are created to represent each virtual user — either one OS thread per user, or a much lighter-weight coroutine, depending on the tool.
Execute scripted actions
Each virtual user runs its scripted actions (HTTP requests, form submissions, WebSocket messages, gRPC calls, etc.).
Send requests with realistic pacing
Requests are sent to the system under test, often with realistic “think time” pauses between actions rather than back-to-back.
Capture responses
Responses are captured — status codes, response bodies, timing data, headers, and any checks the script has defined.
Record per-request metrics
Metrics are recorded per request: latency, success or failure, byte size sent and received, and custom tags.
Aggregate into percentiles
Data is aggregated in real time or after the run into percentiles, averages, error rates, and throughput trend lines.
Generate the final report
A report is generated showing how the system performed under the simulated load — with graphs, tables, and often a pass/fail verdict against configured thresholds.
5.1 Common internal challenges
Thread-based tools (like older JMeter) can run out of memory generating too many virtual users on one machine. Network conditions on the load generator machine itself can skew results. Clock synchronisation issues across distributed generators can distort percentile calculations. And poorly written scripts can accidentally test the test tool’s overhead rather than the app’s real performance.
5.2 Threads vs. coroutines — two engine designs
Older tools like JMeter traditionally use one OS thread per virtual user, which is simple but memory-hungry — thousands of threads can exhaust a machine’s RAM. Newer tools like k6 (built in Go) and Locust (built in Python with gevent) use lightweight coroutines or event loops, letting a single machine simulate far more virtual users with much less memory overhead. This is one reason why modern tools can generate more realistic load with fewer, cheaper machines.
Threads are like hiring a full-time employee for every single customer — expensive and heavy. Coroutines are like one skilled waiter who can juggle many tables at once, checking in on each briefly and moving to the next — far more efficient for the same amount of “attention.”
Data Flow & Lifecycle — The Life of a Load Test
A load test isn’t just “click run and watch.” It follows a clear lifecycle, similar to how a software feature moves from idea to production.
6.1 Plan
Define goals: What traffic level are we simulating? What are we trying to prove — capacity, stability, or a specific SLA? Identify critical user journeys (login, checkout, search) that must remain fast even under peak load.
6.2 Script
Write the test scenario in the tool’s scripting language, defining virtual user behaviour, data inputs, and think time. Good scripts version-control alongside application code so they evolve together.
6.3 Execute
Run the test — often starting small and ramping up gradually to avoid immediately overwhelming the system without useful data. A test that instantly slams the app with peak load usually just tells you “it broke,” not when or why.
6.4 Monitor
Watch real-time dashboards for both the load tool’s metrics (response times, error rate) and the system’s own metrics (CPU, memory, database connections). The most valuable insights come from correlating both sides live.
6.5 Analyse
Look at percentiles, throughput trends, and error patterns to find where and why the system struggled. Was it a specific endpoint? A single downstream service? A shared resource like the database?
6.6 Fix & repeat
Engineers tune configurations, optimise code, add caching, or scale infrastructure — then run the test again to confirm improvement. This loop often repeats several times before a big launch, and each iteration should measurably move the numbers in the right direction.
Advantages, Disadvantages & Trade-offs
Advantages
- Finds performance problems before real users do, in a safe controlled environment.
- Gives concrete data for capacity planning and budgeting — not guesses.
- Builds confidence before major launches or sales events.
- Helps validate SLAs and SLOs with real evidence, not aspirational numbers.
- Can be automated and repeated in CI/CD pipelines, catching regressions early.
Disadvantages / Trade-offs
- Requires infrastructure and cost to generate realistic load, especially at scale.
- Poorly designed tests can give false confidence (unrealistic scenarios that don’t match how real users behave).
- Test environments rarely match production perfectly, causing inaccurate results in either direction.
- Running heavy tests against production can be risky and disruptive if not carefully staged.
- Requires ongoing maintenance as the application evolves — a stale test is often worse than no test.
Testing against a staging environment that’s much smaller than production (fewer servers, smaller database) can produce misleading results — the staging environment might break at a much lower load than production ever would, or vice versa. The closer staging mirrors production, the more trustworthy the numbers.
Performance & Scalability — What the Numbers Actually Tell You
One of the biggest reasons load testing tools exist is to answer scalability questions: does adding more servers, more database replicas, or more CPU actually help? Or does the system hit a hidden ceiling regardless?
8.1 Key metrics to watch
Why percentiles instead of averages? Averages hide outliers. If 95 out of 100 users get a response in 100 ms, but 5 users wait 10 seconds, the average might look fine (~600 ms), but those 5 unlucky users had a terrible experience. Percentiles like p95 and p99 reveal that hidden pain and are the numbers you should be reporting to leadership, not the mean.
8.2 Horizontal vs. vertical scaling discovery
Load testing tools help teams discover whether their system scales horizontally (adding more machines) or needs vertical scaling (bigger machines) — and, critically, whether scaling actually helps at all. Sometimes a bottleneck is a single database or a shared lock, meaning no amount of extra servers will fix the real problem — only load testing reveals this clearly.
8.3 A k6 script example
// Example k6 script (JavaScript) simulating ramping load
import http from 'k6/http';
import { sleep, check } from 'k6';

export const options = {
  stages: [
    { duration: '2m', target: 100 },   // ramp up to 100 users
    { duration: '5m', target: 100 },   // stay at 100 users
    { duration: '2m', target: 500 },   // spike to 500 users
    { duration: '5m', target: 500 },   // hold at 500
    { duration: '2m', target: 0 },     // ramp down
  ],
};

export default function () {
  const res = http.get('https://example.com/api/products');
  check(res, { 'status is 200': (r) => r.status === 200 });
  sleep(1); // simulate think time
}
This shape — ramp up, hold, spike, hold, ramp down — is a classic pattern because it lets you see (a) how the system behaves at steady state, (b) how it reacts to a sudden increase, and (c) whether it recovers cleanly when the load drops.
High Availability & Reliability Testing
Load testing tools are also used to validate that failover and redundancy mechanisms actually work under real pressure — not just in theory.
- Failover testing: Simulating load while intentionally killing a server to see if traffic reroutes smoothly — and how long the failover actually takes from a user’s perspective.
- Circuit breaker validation: Confirming that when a downstream service slows down, the system “trips” gracefully instead of cascading into a full outage.
- Auto-scaling validation: Checking that cloud auto-scaling rules actually trigger fast enough before users are impacted — a rule that scales up in 10 minutes is not much use for a 2-minute traffic burst.
- Graceful degradation: Verifying that under extreme load, non-critical features (like recommendations) get disabled first to preserve core functionality (like checkout).
Security Considerations in Load Testing
Load testing tools generate massive traffic, which means they must be used responsibly and securely.
Never run a load test against a system you don’t own or have explicit permission to test. Unauthorised load testing looks identical to a Denial-of-Service (DoS) attack and can have serious legal consequences.
- Authorisation: Always get written approval before testing shared or production infrastructure, especially third-party services.
- Data protection: Test data should never contain real customer information — use masked or synthetic data instead.
- Rate limiting awareness: Some systems have security rate limiters (like WAFs) that may block load test traffic, giving misleading “failure” results that are actually security features working correctly.
- Credential handling: Load test scripts often need login credentials for realistic testing — these must be stored securely, never hardcoded in plain text in shared scripts.
- DDoS testing overlap: Load and stress testing techniques resemble DDoS attack patterns — this similarity is exactly why authorisation and controlled environments matter so much.
Monitoring, Logging & Metrics During a Load Test
A load test is only as useful as the visibility you have while it’s running. Teams typically monitor two sides simultaneously:
Client-side metrics
Response times, throughput, error rates — collected by the load testing tool itself and shown on its live dashboard.
Server-side metrics
CPU usage, memory, disk I/O, database query times — collected via monitoring tools like Prometheus, Grafana, or Datadog.
Application logs
Error logs, stack traces, and slow query logs that reveal exactly why something failed under load.
Distributed tracing
Tools like Jaeger or Zipkin trace a single request across microservices to pinpoint exactly which service caused a slowdown.
Correlating client-side and server-side data is crucial. If response times spike exactly when database CPU spikes, that’s a strong clue about where the bottleneck lives. Without this correlation, teams are often left guessing — and guesses lead to expensive fixes that don’t actually solve the real problem.
Running Load Tests in the Cloud & CI/CD
Modern load testing rarely happens on a single laptop. Instead, it’s often deployed as part of automated pipelines and cloud infrastructure.
- Cloud-based load generation: Services like k6 Cloud, BlazeMeter, or AWS-hosted Locust clusters spin up many machines across regions to generate realistic, geographically distributed traffic.
- CI/CD integration: Teams run lightweight load tests automatically on every deployment, catching performance regressions early — before a small change silently breaks scalability.
- Containerised load generators: Running load tools in Docker or Kubernetes makes it easy to scale up the number of generator instances on demand.
- Infrastructure-as-code: Load test environments themselves are often defined as code (Terraform, Pulumi, or Kubernetes manifests) so they exactly mirror production and can be spun up and torn down cheaply.
Run smaller “smoke-level” load tests automatically on every code change, and reserve full-scale, expensive load tests for pre-release milestones — this balances cost with confidence.
How Load Testing Interacts with Infrastructure Layers
Load testing tools don’t just test your application code — they reveal problems across your entire infrastructure stack.
13.1 Databases
Under load, databases often become the bottleneck before anything else — running out of connections, slow queries without proper indexes, or lock contention. Load tests reveal exactly which queries slow down first as concurrency increases, giving you a prioritised list of what to fix.
13.2 Caching
Load testing shows whether a caching layer (like Redis or Memcached) is actually reducing load on the database, or whether cache misses under high concurrency are causing a “thundering herd” — where many requests simultaneously hit the database because the cache expired at the same moment for everyone.
13.3 Load balancers
Load testing validates that traffic is being distributed evenly across backend servers, and that load balancer health checks correctly remove unhealthy instances from rotation during a test. An unbalanced load balancer can silently overload one server while others sit idle.
13.4 A Locust script example
# Simple example: Locust (Python) test with realistic user behavior
from locust import HttpUser, task, between

class ShopperUser(HttpUser):
    wait_time = between(1, 3)  # simulated think time

    @task(3)
    def browse_products(self):
        self.client.get("/api/products")

    @task(1)
    def checkout(self):
        self.client.post("/api/checkout", json={"item_id": 42, "qty": 1})
Notice how @task(3) vs. @task(1) weights browsing three times more common than checkout — a realistic model of shopper behaviour, rather than pretending every visitor buys something.
Load Testing APIs & Microservices
In modern architectures, a single user action might trigger calls across a dozen microservices. Load testing tools are essential here because a bottleneck in just one small service can silently degrade the entire system.
- API-level testing: Load tools send requests directly to REST or GraphQL endpoints, bypassing the UI to isolate backend performance.
- Service dependency mapping: Combined with distributed tracing, load tests reveal which downstream microservice is the true bottleneck in a chain of calls.
- Contract-aware testing: Some tools validate that API responses stay correct (not just fast) under load — catching bugs that only appear under concurrency, like race conditions.
- Rate limit tuning: Load tests help teams set sensible API rate limits that protect the system without frustrating legitimate high-volume users.
Design Patterns & Anti-Patterns in Load Testing
15.1 Good patterns
- Realistic user modelling: Scripts that mimic real behaviour (browsing, pausing, varying paths) rather than hammering one endpoint repeatedly.
- Gradual ramp-up: Slowly increasing load to observe the system’s behaviour at each stage, rather than jumping straight to peak load.
- Baseline-first testing: Always establish a baseline performance number before making changes, so improvements or regressions can be measured accurately.
- Shift-left performance testing: Running lightweight load tests early in development, not just right before launch.
15.2 Anti-patterns to avoid
Ignoring error scenarios, login failures, or edge cases that real users will inevitably hit. Real traffic is messy; your load test should be, too.
Sending requests as fast as technically possible, producing unrealistic load patterns no real user population would generate.
Running a load test once before launch and never again, missing regressions introduced by later changes.
Running a load test without watching server-side metrics, missing the “why” behind failures. You’ll know something broke; you won’t know what.
Best Practices & Common Mistakes
Best practices
- Define clear, measurable goals before writing a single script.
- Use production-like data volumes and environment configuration.
- Start small, increase gradually, and monitor continuously.
- Automate load tests as part of the release pipeline.
- Document and share results with the whole engineering team — performance is a team sport, not a specialist role.
Common mistakes
- Testing against undersized staging environments.
- Forgetting to warm up caches before measuring results.
- Not cleaning up test data after runs, polluting the database.
- Overlooking third-party service rate limits during tests.
- Treating a single test run as the final, permanent answer.
How Real Companies Use Load Testing
Frequently Asked Questions
Is load testing the same as performance testing?
Not exactly. Performance testing is the broader umbrella category, and load testing is one specific type within it, alongside stress testing, spike testing, and soak testing.
Can load testing be done on a production environment?
Yes, but carefully. Some companies do controlled “load testing in production” using techniques like traffic shadowing or testing during low-traffic hours, but it always requires strict safeguards to avoid impacting real users.
What’s the difference between load testing and a real DDoS attack?
Technically, the traffic patterns can look similar, but the key difference is intent and authorisation — load testing is done with permission, in a controlled way, to improve the system, while a DDoS attack is unauthorised and malicious.
How many virtual users should I simulate?
This depends entirely on your expected real-world traffic, ideally based on analytics data — often teams test at 1x expected peak, then push further (1.5x–3x) to find the actual breaking point with headroom to spare.
Do small applications need load testing too?
Yes, even small apps benefit — a sudden spike from a social media mention or a marketing email blast can overwhelm a system that normally has very light traffic.
Summary & Key Takeaways
A load testing tool exists to answer one essential question before real users ever have to find out the hard way: will this system hold up under real-world pressure? By simulating virtual users, ramping traffic gradually, and measuring response times, throughput, and errors, these tools expose weaknesses in code, infrastructure, databases, and architecture — long before they become costly, public failures.
Key takeaways
- Load testing tools simulate many virtual users to reveal how a system behaves under realistic and peak traffic conditions.
- Different test types — load, stress, spike, and soak — each answer a distinct performance question.
- Modern tools (k6, Gatling, Locust, JMeter) use efficient engines to generate high concurrency with lower resource overhead.
- Percentiles (p95, p99) reveal real user pain far better than simple averages.
- Load testing must be authorised, secure, and run in production-representative environments to be trustworthy.
- The best teams treat load testing as a continuous, automated practice — not a one-time pre-launch checkbox.
- Real companies like Netflix, Amazon, and Uber depend on rigorous load testing to survive their biggest traffic moments.

