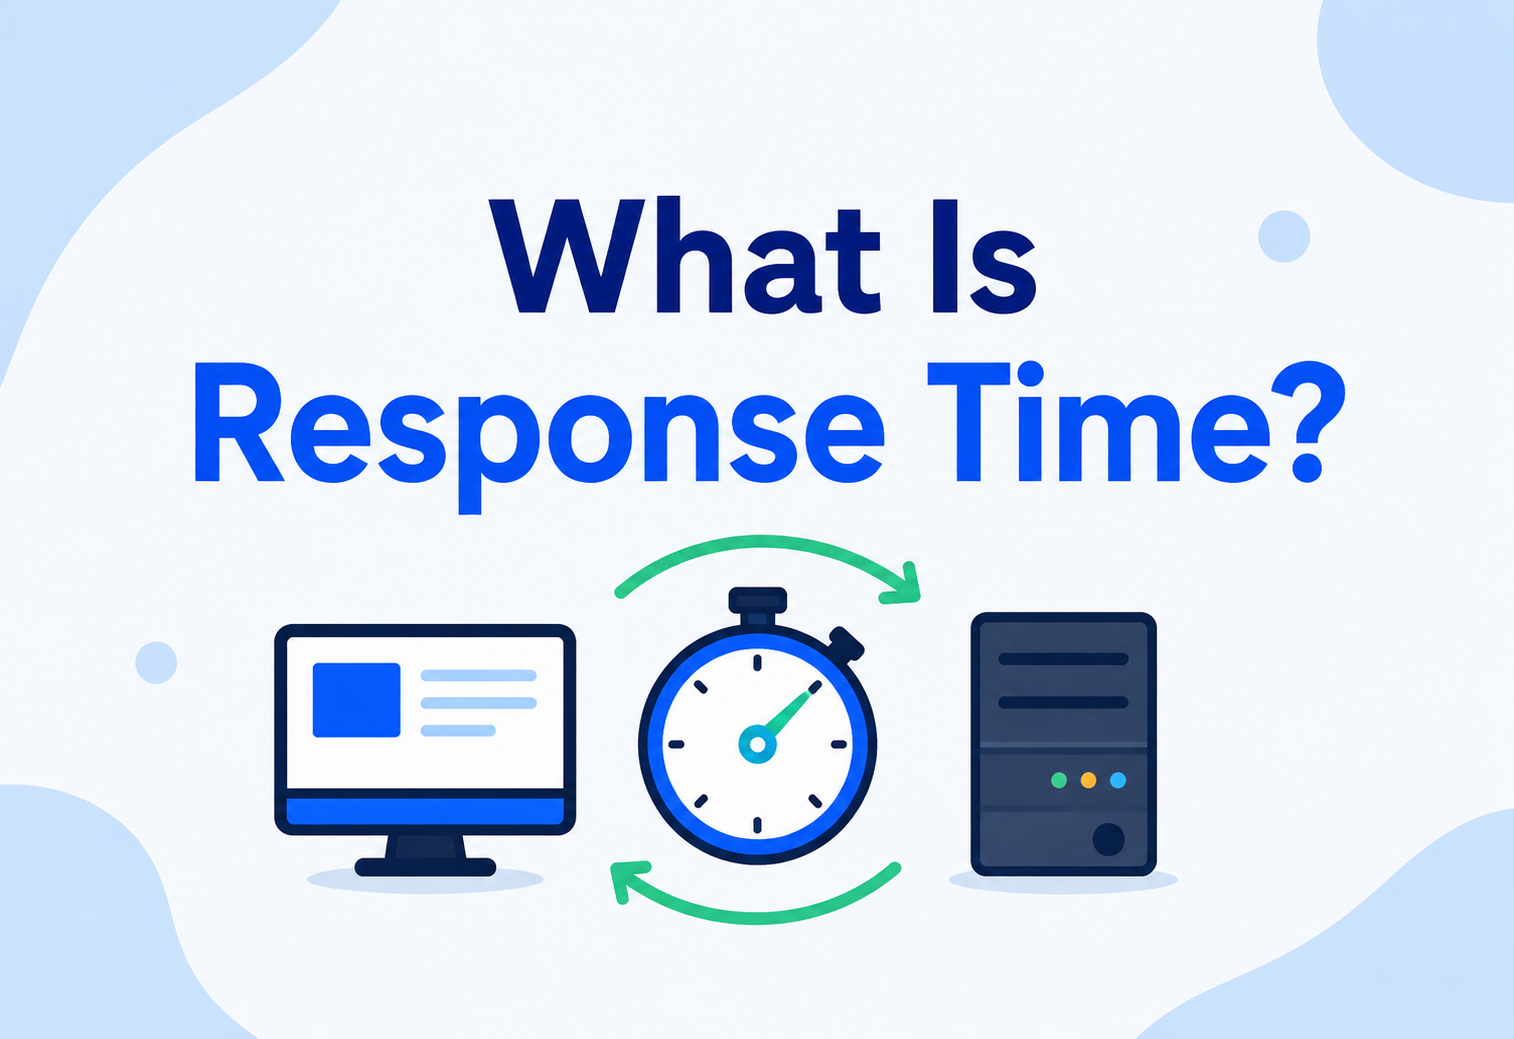
What Is Response Time?
The single number that decides whether an application feels instant or feels broken. This guide breaks down what response time actually measures, where every millisecond of it goes, and how engineers design systems to keep it low.
Introduction & History
Picture yourself pressing a light switch. If the light turns on the instant you flip the switch, you do not think about it at all — it just works. But if there is a two-second delay before the light turns on, you will notice it, you will wonder if the switch is broken, and you might flip it again (making things worse). That gap between “I asked for something” and “I got it” is exactly what response time measures in software systems — except instead of a light switch, it is a button click, a page load, an API call, or a database query.
Response time is the total time that elapses between a request being sent and its corresponding response being fully received. It is one of the oldest and most fundamental measurements in all of computing, because it directly connects a machine’s internal behaviour to a human being’s actual, felt experience.
1.1 A Short History
The formal study of response time goes back to the earliest interactive computer systems of the 1960s and 1970s. Before then, most computing was done in batch mode — you submitted a stack of punch cards, walked away, and came back hours later for your results. There was no “response time” to speak of in the interactive sense, because nobody was sitting and waiting for an immediate answer.
That changed with the rise of time-sharing systems, where multiple users typed commands at terminals and expected the computer to respond quickly, as if it were theirs alone. Researchers at places like MIT and Bell Labs began formally studying how fast a system needed to respond before a human user got frustrated, bored, or lost their train of thought. This research eventually produced now-famous rules of thumb — such as the idea that responses under about 100 milliseconds feel instantaneous, and responses beyond about 10 seconds cause people to mentally give up and switch to another task — which remain foundational to user-experience design even today, decades later.
As computing moved from terminals to graphical desktop applications, then to the web, then to mobile apps, and now to voice assistants and real-time collaborative tools, the exact numbers shifted a little, but the underlying human psychology never has. Response time research from the 1960s still directly informs how modern engineers set performance budgets for a 2026 mobile app.

Think of asking a friend a question in conversation. If they answer within a second, the conversation flows naturally. If they pause for five seconds before answering, you start to wonder if they heard you, if something is wrong, or if they are thinking hard about a difficult question. Software users experience the exact same psychological reactions — response time is the “conversational rhythm” between a person and a machine.
Problem & Motivation
Why does one single number — response time — get so much attention from engineers, designers, and even business executives? Because it has been shown, over and over again, in real, measured studies, to directly affect how people feel about a product and whether they keep using it.
- Large e-commerce companies have measured that every extra 100 milliseconds of page load time can measurably reduce sales.
- Search engines have found that a slower results page, even by a fraction of a second, reduces how often people search again.
- Mobile app studies consistently show that apps which feel slow to open are uninstalled far more often than apps which feel instant, even when both apps ultimately do the same job equally well.
The motivation for studying and measuring response time carefully is simple: humans have hard-wired expectations about the pace of interaction, and those expectations do not bend just because a computer is doing something complicated behind the scenes. If a system feels slow, most users do not care that it is actually running a complex, correct, well-engineered calculation — they simply experience “slow” as “broken” or “annoying.”
Response time is one of the few engineering metrics that maps almost directly onto human emotion. A system can be perfectly correct and still fail its users if it is too slow — which is why response time is treated as a first-class requirement, not an afterthought, in virtually every serious piece of software built today.
Core Concepts
Let us build up the vocabulary needed to talk about response time precisely, one simple idea at a time. Each term has an everyday equivalent, and mixing them up is where most performance conversations quietly go off the rails.
3.1 Response Time — Formal Definition
Response time is the total elapsed time from the moment a request is initiated (a user clicks a button, a client sends an API call) to the moment the complete response is received and ready to use. It is usually measured in milliseconds (ms) or seconds.
3.2 Latency vs. Response Time — Are They the Same Thing?
These two terms are often used interchangeably in casual conversation, but engineers sometimes draw a finer distinction: latency often refers specifically to the delay caused by transmission — the time it takes for a signal to travel across a network, independent of how long the receiving system takes to actually process the request. Response time is usually used as the broader, end-to-end term: network latency plus processing time plus any queueing delay along the way. In everyday engineering conversation, though, many people use “latency” to mean the same thing as “response time” — so always check what specifically is being measured rather than assuming from the word alone.
3.3 Response Time vs. Throughput
What: Throughput measures how much work a system completes per unit of time (e.g. requests per second). Response time measures how long any single piece of work takes.
Why the distinction matters: A system can have high throughput and still have bad response time for individual users — imagine a highway that moves 10,000 cars per hour in total, but where each individual car sits in traffic for 45 minutes. Total “throughput” is fine; each driver’s personal experience is miserable.
Analogy: A post office might process 500 letters an hour (good throughput) while each individual customer still waits in a 20-minute line (bad response time). The two numbers describe different things and must both be watched.
3.4 Time to First Byte (TTFB)
What: The time between when a client sends a request and when it receives the very first byte of the response — before the rest of the response has necessarily arrived.
Why: TTFB is a useful way to isolate “how long did the server take to start responding” from “how long did it take to transfer the entire response,” which matters more for large payloads like videos or big JSON responses.
3.5 Perceived Response Time vs. Actual Response Time
What: The actual response time is what a stopwatch or a monitoring tool measures. The perceived response time is how fast the system feels to the human waiting for it — which can be manipulated (in a good way) through design.
Why: A progress bar, a loading skeleton, or an immediate visual acknowledgement (“Sending message…”) can make an operation that objectively takes 3 seconds feel much faster than an identical 3-second wait with a frozen, blank screen.
Analogy: An elevator that takes 40 seconds to arrive feels much longer if you are staring at a blank wall than if there is a mirror to look at, or a floor-number display counting down — the actual wait is identical, but the perceived wait is very different.
3.6 Response Time Thresholds (Jakob Nielsen’s Classic Guidance)
| Threshold | Human Perception |
|---|---|
| ~0.1 second (100 ms) | Feels instantaneous — the user perceives the system as reacting immediately to their action, with no interruption to their train of thought. |
| ~1 second | The delay is noticeable, but the user’s flow of thought stays uninterrupted; no special feedback is strictly needed, though it helps. |
| ~10 seconds | The limit for keeping a user’s attention focused on the task at all. Beyond this, users mentally switch away, and a clear indication of progress (percentage, spinner, time remaining) becomes essential. |
These thresholds were established decades ago and remain directionally accurate, but modern users — accustomed to extremely fast mobile apps and near-instant search results — are often measurably less patient than the original research subjects were. Many modern products design toward far tighter budgets (e.g. under 200 ms for a “fast” web page) precisely because expectations have only got stricter over time, never looser.
Architecture & Components
Response time is not one indivisible thing — it is the sum of many smaller time segments, each happening in a different part of the system’s architecture. Understanding where each segment lives is the key to being able to actually improve response time later, rather than guessing blindly.
4.1 DNS Resolution
Before a browser can even send a request, it needs to translate a domain name (like example.com) into an IP address. This lookup, if not cached, adds its own delay — typically tens of milliseconds, though it can be longer on a slow network.
4.2 Network Transmission (the Wire)
Data has to physically travel — through cables, routers, cell towers, and undersea fibre — between the client and server. This is fundamentally limited by the speed of light and the number of “hops” along the way, which is why a user in Australia talking to a server in Virginia will always have a higher network-transmission floor than a user sitting next to that same server, no matter how well-optimised the software is.
4.3 Connection Setup (TCP and TLS Handshakes)
Before any actual data flows, the client and server must agree to open a connection (TCP handshake) and, for secure sites, negotiate encryption (TLS handshake). Each of these requires its own back-and-forth round trip, adding fixed overhead before the “real” request even starts.
4.4 Load Balancer & Routing
In any system with more than one server, a load balancer decides which specific server instance should handle the incoming request. This adds a small amount of processing time, but importantly, it also affects response time indirectly — a poorly configured load balancer can send requests to an already-overloaded server, driving that particular request’s response time up sharply.
4.5 Application Processing
This is where the actual business logic runs: validating input, running calculations, calling other internal services, and assembling a response. This segment is usually the one engineers have the most direct control over — and usually the biggest target for optimisation.
4.6 Database and Cache Access
Most non-trivial requests need data — a user’s profile, a product’s price, an order’s status. Fetching this from a database, or better yet from a fast in-memory cache, is very often the single largest contributor to response time in real-world systems.
4.7 Response Transmission
Finally, the response itself has to travel back across the network to the client, and — for larger payloads like images or big JSON documents — this transfer time can itself be a meaningful chunk of the total response time, separate from how long the server took to prepare the response in the first place (this is exactly the distinction TTFB is designed to isolate).

Imagine ordering food through a delivery app. The “response time” a customer feels is DNS-lookup-equivalent to finding the restaurant’s phone number, network-transmission-equivalent to the call connecting, application-processing-equivalent to the kitchen actually cooking the order, and response-transmission-equivalent to the delivery driver bringing the food to the door. A slow experience could be caused by any one of these stages — and fixing the kitchen’s cooking speed will not help at all if the actual bottleneck is a delivery driver stuck in traffic.
Internal Working
How does a system actually measure its own response time internally, down to the millisecond? Let us open the hood.
5.1 Timestamps and Clocks
At its simplest, measuring response time means recording a timestamp right before a request starts, recording another timestamp right after the response completes, and subtracting the two. The tricky part is doing this accurately and consistently — clocks on different machines can drift slightly out of sync with each other, which is why distributed systems often use monotonic clocks (clocks that only ever move forward, immune to time-zone changes or manual clock adjustments) specifically for measuring durations, rather than relying on regular “wall clock” timestamps which can occasionally jump backward or forward.
5.2 Where Measurement Happens — Client-side vs. Server-side
Response time can be measured from multiple vantage points, and they often disagree with each other — deliberately so, because they are each answering a slightly different question:
- Server-side measurement: Timestamps recorded the moment a request arrives at the server and the moment the response leaves it. This excludes network transmission time entirely, so it only tells you how long the server itself took.
- Client-side (Real User Monitoring, or RUM) measurement: Timestamps recorded in the actual user’s browser or device, from the moment they triggered the action to the moment they saw the result. This captures the full, true experience — including network time, DNS, TLS, and rendering — but is harder to instrument consistently across many different user devices and networks.
- Synthetic monitoring: Automated scripts that periodically simulate a user action from a fixed location, giving consistent, comparable measurements over time, though not necessarily representative of every real user’s actual network conditions.
5.3 A Minimal Java Example — Instrumenting Response Time
A simplified illustration of how a server might measure and record its own response time per request — the same pattern real production frameworks (Micrometer, OpenTelemetry) apply through interceptors, filters, and middleware.
import java.time.Duration;
import java.time.Instant;
import java.util.concurrent.ConcurrentLinkedQueue;

public class ResponseTimeInstrumentation {

    // Holds recorded response times in nanoseconds, for later percentile calculation.
    private static final ConcurrentLinkedQueue<Long> recordedTimings = new ConcurrentLinkedQueue<>();

    public static void main(String[] args) throws InterruptedException {
        // Simulate handling 10 incoming requests, one after another.
        for (int i = 0; i < 10; i++) {
            handleRequest("request-" + i);
        }
        printPercentiles();
    }

    /**
     * Wraps the actual business logic with timing instrumentation.
     */
    private static void handleRequest(String requestId) throws InterruptedException {
        Instant start = Instant.now(); // start the clock the moment the request begins

        // --- actual application work happens here ---
        simulateDatabaseLookup();
        simulateBusinessLogic();
        // ---------------------------------------------

        Instant end = Instant.now(); // stop the clock once the response is ready
        long elapsedNanos = Duration.between(start, end).toNanos();
        recordedTimings.add(elapsedNanos);

        System.out.printf("%s completed in %.2f ms%n", requestId, elapsedNanos / 1_000_000.0);
    }

    private static void simulateDatabaseLookup() throws InterruptedException {
        Thread.sleep(20); // pretend a DB call takes ~20ms
    }

    private static void simulateBusinessLogic() throws InterruptedException {
        Thread.sleep(5); // pretend business logic takes ~5ms
    }

    private static void printPercentiles() {
        long[] sorted = recordedTimings.stream().mapToLong(Long::longValue).sorted().toArray();
        System.out.println("---- Response Time Report ----");
        System.out.printf("p50: %.2f ms%n", percentile(sorted, 50) / 1_000_000.0);
        System.out.printf("p95: %.2f ms%n", percentile(sorted, 95) / 1_000_000.0);
        System.out.printf("p99: %.2f ms%n", percentile(sorted, 99) / 1_000_000.0);
    }

    private static long percentile(long[] sortedNanos, int percentile) {
        int index = (int) Math.ceil(percentile / 100.0 * sortedNanos.length) - 1;
        return sortedNanos[Math.max(index, 0)];
    }
}
This tiny example demonstrates the exact same technique used by real production instrumentation libraries (like Micrometer in the Java ecosystem, or OpenTelemetry more broadly): wrap the actual work with a “start the clock” and “stop the clock” boundary, record the elapsed duration, and later summarise many recorded durations into percentiles rather than a single misleading average.
5.4 Breaking Response Time Into Spans (Distributed Tracing)
In a real system made of many services, a single response time measurement is not enough to know why something is slow. Modern systems use distributed tracing, where each internal step (a database call, a call to another microservice, a cache lookup) is recorded as its own timed “span,” and all the spans for one request are linked together into a single trace. This lets an engineer look at one slow request and see, visually, exactly which specific internal step consumed the most time — rather than just knowing the total was slow.
Data Flow & Lifecycle
Let us trace the full lifecycle of a single web request from click to pixels-on-screen, showing exactly where every millisecond of response time is spent.
6.1 Stage-by-Stage Breakdown
- User action: The clock effectively starts the moment a user clicks, taps, or triggers an action.
- DNS lookup: If the domain has not been resolved recently, this adds a lookup delay; browsers and operating systems cache DNS results specifically to avoid repeating this cost on every request.
- Connection setup: TCP handshake, then TLS handshake for secure connections — each requiring a round trip across the network before any real data is exchanged.
- Request transmission: The actual request data (headers, body) travels to the server.
- Server-side processing: The server parses the request, runs business logic, and typically queries a database or cache — usually the largest and most variable chunk of the total.
- Response transmission (TTFB and beyond): The server sends back the response; TTFB marks when the first byte arrives, and the rest follows depending on payload size and network conditions.
- Client-side rendering: The browser or app parses the response and updates what the user actually sees — for a complex webpage, this rendering step can itself take a meaningful slice of the total perceived time.
An important lesson from this breakdown: improving server-side processing time alone does not guarantee a faster experience for the user, because DNS, network transmission, connection setup, and client-side rendering are all happening outside the server’s control, yet they all count toward what the user actually experiences.
Advantages, Disadvantages & Trade-offs
Optimising purely for response time, without considering anything else, comes with real trade-offs. It is worth being explicit about them, because “just make it faster” is rarely as free as it sounds.
Benefits of Prioritising Low Response Time
- Directly improves user satisfaction, engagement, and (in commercial products) conversion and revenue.
- Reduces the chance a user abandons an action mid-way (e.g. abandoning a shopping cart because checkout felt slow).
- Makes a system feel more trustworthy and “alive,” even when doing genuinely complex work behind the scenes.
Trade-offs and Costs
- Chasing ever-lower response time often requires additional infrastructure (more caching layers, more servers, CDNs), which costs real money.
- Some optimisations (aggressive caching, precomputing results) can trade off data freshness / consistency for speed.
- Over-optimising for the “average” case can neglect tail latency (p99), which is where the worst individual experiences actually live.
- Some correctness-improving steps (extra validation, extra security checks, stronger consistency guarantees) inherently cost time, and should not be stripped away purely to chase a faster number.
Response time is important, but it is not the only thing that matters. A system that responds instantly with wrong or stale data is not actually a better system — it is just a faster way to disappoint someone. The goal is to make response time as low as possible within the correctness, consistency, and security constraints the system actually needs, not to sacrifice those constraints for a faster number.
Performance & Scalability
Response time and load are inseparable. Any performance conversation that only names a target latency without also naming the load level it holds at is fundamentally incomplete.
8.1 Response Time Under Load
Response time is rarely a fixed number — it typically changes as the number of concurrent users or requests increases. At low load, a system’s response time is usually close to its theoretical best case. As load increases, response time tends to stay flat for a while, then starts climbing, often sharply, once the system approaches its capacity limit. This relationship is exactly why response time and throughput must always be discussed together, and why “our response time is fine” is an incomplete statement unless it also specifies “…at what load level.”
8.2 Little’s Law — a Useful Mental Model
Little’s Law is a simple but powerful formula from queueing theory: the average number of requests “in flight” inside a system equals the average arrival rate multiplied by the average time each request spends in the system. In plain terms: if requests are arriving faster than the system can finish them, requests start queueing up, and every queued request experiences a longer response time — even if the actual processing work per request has not changed at all. This is precisely why a sudden traffic spike can cause response times to balloon, even though nothing about the underlying code got slower.

8.3 Response Time Budgets
In systems made of multiple layers or services, engineers often set a latency budget: a target maximum response time for the whole request, broken down into an allowance for each stage. For example, a 300 ms total budget for an API call might be allocated as 50 ms for network overhead, 20 ms for authentication, 100 ms for the primary database query, 80 ms for a downstream service call, and 50 ms of margin. This turns a vague goal (“be fast”) into a concrete, per-component engineering target that different teams can each be held accountable for.
High Availability & Reliability
Response time and reliability are two sides of the same coin. Timeouts, retries, and slow-climb detection are all mechanisms that trade some latency for a much stronger guarantee that requests eventually get answered at all.
9.1 Timeouts
Every network call needs a timeout — a maximum amount of time the caller is willing to wait before giving up and treating the call as failed. Without timeouts, a single slow dependency can cause callers to wait indefinitely, tying up their own resources (threads, connections) and potentially causing a cascading slowdown across the whole system. Setting the right timeout value is a genuine engineering skill: too short, and you will abandon requests that would have succeeded if given a bit more time; too long, and a single struggling dependency can drag down everything that depends on it.
9.2 Retries and Their Effect on Response Time
When a request times out or fails, systems often retry automatically. This improves reliability, but it directly affects response time: a request that fails once and succeeds on retry will have a much higher total response time than one that succeeds immediately. Poorly designed retry logic (retrying too aggressively, with no backoff) can also make an already-struggling system worse, by adding even more load exactly when it has the least spare capacity — this is why most production systems use exponential backoff (waiting progressively longer between each retry attempt) and a maximum retry limit.
9.3 Response Time as an Early Warning Signal
A gradual rise in response time is very often the earliest visible symptom of a deeper reliability problem — a memory leak building up, a database running low on connections, a disk filling up — long before the system fully fails. This is why response time is one of the most heavily monitored, alerted-upon metrics in production systems: catching a slow, steady climb early can prevent a full outage later.
Security Angle
Response time is not only a user-experience metric — the very same measurements that reveal how fast a system is can also, in the wrong hands, quietly reveal what is inside it.
10.1 Timing Attacks
A timing attack is a security exploit where an attacker measures small differences in response time to infer secret information. For example, if a login system compares a submitted password to the correct one character by character and returns “wrong password” the instant it finds a mismatch, then a correct first character (even with a wrong overall password) will take microseconds longer to reject than a wrong first character. An attacker who can measure these tiny timing differences precisely enough could, in principle, guess a password one character at a time.
This is exactly why security-critical comparisons (like checking passwords, tokens, or cryptographic signatures) use constant-time comparison functions — code deliberately written to take the exact same amount of time regardless of where or whether a mismatch occurs, specifically to prevent response time itself from becoming a side channel that leaks secret information.
10.2 Response Time as a Reconnaissance Tool
Attackers sometimes probe a system’s response times deliberately to learn about its internal structure — for instance, noticing that requests for valid usernames take slightly longer than requests for invalid ones (because a valid username triggers a real database lookup, while an invalid one might be rejected earlier), which can reveal which usernames exist in a system even without ever seeing an explicit “user not found” vs “user found” message.
10.3 Denial of Service and Response Time Collapse
As discussed in the context of stress testing, a Denial-of-Service attack deliberately drives response time up (and eventually to complete failure) by overwhelming a system’s capacity. Monitoring for sudden, sharp increases in response time is one practical way systems detect that an attack (rather than simply organic traffic growth) might be underway.
Monitoring, Logging & Metrics
Response time is only as useful as the way it is measured, summarised, and alerted upon. Reporting the wrong summary statistic is one of the most common mistakes made by otherwise-mature teams.
11.1 Why Percentiles, Not Averages
An average response time can hide serious problems. If 99 out of 100 requests take 50 ms but 1 takes 8 seconds, the average looks fine (roughly 130 ms) while masking a genuinely terrible experience for that unlucky 1%. This is why virtually all serious monitoring systems report response time as percentiles — p50 (median), p95, and p99 — rather than, or at least in addition to, a simple average.
11.2 Setting SLOs (Service Level Objectives) Around Response Time
A typical SLO might read: “95% of API requests will complete in under 300 ms, measured over a rolling 30-day window.” This turns response time from a vague aspiration into a concrete, measurable commitment that can be tracked, alerted on, and reported to stakeholders. Teams often pair this with an error budget — an allowed amount of SLO violation before it triggers a required slowdown in new feature work in favour of reliability work.
11.3 Dashboards and Alerting
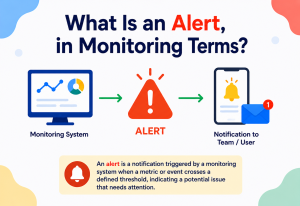
Tools like Grafana (visualising metrics collected by systems like Prometheus), combined with distributed tracing platforms (like Jaeger or Zipkin, or commercial equivalents), let engineers watch response time in real time, broken down by endpoint, region, and percentile, and set automated alerts for when it crosses a defined threshold — ideally catching problems before customers notice them and complain.
| Metric | What it tells you |
|---|---|
| p50 response time | The typical, “normal” experience most users get. |
| p95 / p99 response time | The experience of the unluckiest 5% / 1% of requests — often where real user complaints originate. |
| TTFB | How long the server took to start responding, isolated from payload transfer time. |
| Error rate | Context for response time — a fast error is not actually a “good” result. |
Deployment & Cloud
Because part of response time is fundamentally physics — the speed of light, distance, and number of hops — where the infrastructure lives matters just as much as how it is coded.
12.1 Content Delivery Networks (CDNs)
One of the most effective ways to reduce response time for geographically distributed users is a CDN — a network of servers positioned physically closer to end users around the world, caching content so that a user in Singapore does not need to wait for a round trip all the way to a server in Virginia for every single request. Because network transmission time is fundamentally limited by physical distance, no amount of server-side optimisation can overcome the physics of a long-distance round trip — moving the content closer to the user is often the only real fix.
12.2 Edge Computing
Beyond simply caching static content, modern platforms increasingly run actual application logic at “edge” locations close to users (rather than only in a small number of centralised data centres), reducing response time for dynamic, personalised responses that cannot simply be cached.
12.3 Databases, Caching, and Load Balancing
Three infrastructure choices have an outsized effect on response time:
Databases
Proper indexing can turn a slow, full-table-scanning query into a near-instant lookup; poor indexing is one of the single most common causes of unexpectedly slow response times in real systems.
Caching
Storing frequently-requested data in fast in-memory stores (like Redis or Memcached) avoids repeating expensive database work or computation for every request, often turning a 100 ms database round trip into a sub-millisecond cache hit.
Load Balancing
Spreading requests evenly across multiple server instances prevents any single instance from becoming a bottleneck that drags up response time for the unlucky requests routed to it.
12.4 Geographic and Multi-Region Deployment
Deploying application servers (not just cached content) in multiple regions close to major user populations reduces the network-transmission portion of response time for dynamic requests too, at the cost of additional operational complexity (keeping data consistent across regions).
APIs & Microservices
In a microservices architecture, a single user-facing request can trigger calls to many internal services. The way those calls are orchestrated makes an enormous difference to end-to-end response time.
13.1 The Fan-Out Problem, Revisited for Response Time
If those calls happen sequentially (one after another, each waiting for the previous to finish), the total response time is roughly the sum of every individual call’s response time. If they happen in parallel (fired off simultaneously, with the caller waiting for all of them to finish), the total response time is closer to the slowest individual call, not the sum of all of them. This single architectural choice — sequential versus parallel calls — is one of the biggest levers engineers have over end-to-end response time in a microservices system.
13.2 The Slowest Dependency Sets the Floor
Even with perfect parallelisation, a request’s response time can never be faster than its single slowest required dependency. This is why engineers spend real effort identifying the “critical path” of a request — the specific chain of dependent calls that cannot be avoided or parallelised — because that critical path defines the actual floor on how fast the request can ever be, no matter how much everything else is optimised.
13.3 Graceful Degradation for Non-Critical Calls
A common and highly effective pattern is deciding which parts of a response are actually essential versus “nice to have,” and setting tighter timeouts (with a graceful fallback) on the non-essential ones. For example, a product page might show the price and availability (essential, must wait for it) while simply hiding a “customers also bought” recommendations section if that particular service does not respond within, say, 50 ms — rather than letting a slow, non-critical dependency drag down the response time of the entire page.
Design Patterns & Anti-Patterns
A short, opinionated list of the shapes that recur in every well-performing system, and the ones that quietly ruin performance in nearly every troubled one.
14.1 Good Patterns
- Caching aggressively where data does not change often, to avoid repeating expensive work for every single request.
- Parallelising independent calls rather than chaining them sequentially, whenever the calls do not actually depend on each other’s results.
- Setting sensible, tiered timeouts so no single slow dependency can hold up an entire request indefinitely.
- Optimistic UI updates — showing the expected result immediately in the interface while the real request completes in the background, then correcting if needed — which improves perceived response time even when actual response time is unchanged.
- Progressive loading / skeleton screens, showing a rough outline of the page immediately while the real data streams in, rather than a blank screen until everything is ready.
14.2 Anti-Patterns
Common Anti-Patterns
- The N+1 query problem: Fetching a list of items with one query, then looping through them and firing a separate database query for each item’s details — turning what should be one fast query into potentially hundreds of slow, sequential ones.
- Chatty microservices: Splitting a single logical operation across many small, sequential network calls between services, where each call’s network overhead adds up to dominate the total response time.
- No timeouts at all: Assuming a dependency will always respond quickly, and thus waiting indefinitely when it does not — turning one slow dependency into a system-wide slowdown.
- Measuring only averages: Reporting a healthy-looking average response time while a meaningful fraction of real users are actually experiencing multi-second delays hidden inside that average.
- Premature optimisation of the wrong stage: Spending weeks optimising application code when the actual bottleneck, once measured, turns out to be an unindexed database query or a slow third-party API call.
Best Practices & Common Mistakes
If a code or architecture review turns up any of the common mistakes below, treat it as a real performance risk waiting to surface, rather than a purely cosmetic issue.
15.1 Best Practices
- Measure before optimising. Use tracing and profiling to find out exactly where time is actually being spent before changing any code.
- Track percentiles, not just averages, especially p95 and p99, since that is where the worst real user experiences live.
- Set explicit response time budgets per component, so teams know exactly what “fast enough” means for the part of the system they own.
- Cache what can safely be cached, and be deliberate about how fresh that cached data needs to be.
- Parallelise independent work rather than defaulting to sequential calls out of habit.
- Design for perceived speed as well as actual speed — loading indicators, skeleton screens, and optimistic UI updates all genuinely improve how fast a product feels.
- Alert on response time trends, not just thresholds, since a slow, steady climb can be an early warning of a deeper problem well before it becomes a full outage.
15.2 Common Mistakes
- Optimising only what is easy to measure (server-side processing time) while ignoring the parts users actually feel (network time, client-side rendering).
- Assuming response time measured in a test environment will match production, when production has vastly more data, real network conditions, and real concurrent traffic.
- Retrying failed requests without backoff, making a struggling system’s response time worse at exactly the moment it can least afford it.
- Ignoring the “slowest dependency” floor and assuming parallelising everything will always fix a slow multi-service request, when one unavoidable slow call still sets the minimum possible time.
- Treating a single test or single user’s report as representative, rather than looking at aggregated percentiles across real traffic.
Real-World / Industry Examples
Abstract advice gets much sharper once you see how the biggest, most user-obsessed engineering organisations treat response time in practice.
Amazon
Amazon has publicly discussed internal findings that even very small increases in page load time can measurably reduce sales, which is part of why the company invests heavily in caching, content delivery, and aggressive performance budgets across its retail platform.
Google Search
Google has long emphasised response time as a core product value, with search results widely known for returning in a fraction of a second — a deliberate engineering priority reflected in the massive, globally distributed infrastructure built specifically to keep that number low regardless of where in the world a search originates.
Netflix
Netflix relies heavily on caching and content delivery infrastructure (including its own purpose-built CDN, Open Connect) specifically to minimise the response time and buffering delay users experience when starting or seeking within a video, since even brief stalls are known to noticeably affect viewer satisfaction and continued engagement.
Financial Trading Systems
In high-frequency trading, response time is measured in microseconds rather than milliseconds, and firms have gone as far as building specialised, physically shorter network routes between data centres specifically to shave tiny amounts of network transmission time off their response times — an extreme, but illustrative, example of how seriously some industries take this single metric.
Frequently Asked Questions
A few of the questions that come up most often the first time an engineer, product manager, or designer works seriously with response time as a first-class requirement.
They are often used interchangeably, but strictly speaking, latency usually refers specifically to network transmission delay, while response time is the broader end-to-end measurement including network time, processing time, and any queueing delay. Always check the specific definition being used in context.
Because averages hide outliers. A healthy-looking average can still mean a meaningful fraction of real users are having a genuinely bad, slow experience — and p99 is specifically designed to expose that hidden tail.
There is no single universal number, but common guidance suggests aiming for well under 100 ms for something to feel instantaneous, under roughly 1 second to avoid interrupting a user’s train of thought, and providing clear progress feedback for anything beyond a few seconds. Many modern web and API teams target response times in the tens to low hundreds of milliseconds for their core interactions.
Not in the sense of being a problem for users, but chasing an unnecessarily aggressive response time target can lead to real trade-offs elsewhere — reduced data freshness, higher infrastructure cost, or skipped validation and security checks — so response time targets should be set deliberately, based on real user needs, rather than simply “as fast as theoretically possible.”
Caching stores the result of expensive work (a database query, a computation) so it can be reused instead of redone for every request. A cache hit is typically dramatically faster than the equivalent uncached operation, which is why caching is one of the most effective single techniques for reducing response time in real systems.
Network transmission time is fundamentally limited by physical distance and the number of network hops involved. Unless a system uses a CDN or multi-region deployment to serve you from a location physically closer to you, users farther from the primary server will experience higher response times purely due to the physics of data travelling across longer distances.
Summary & Key Takeaways
Response time turns out to be less a single number and more a lens: every design decision in a modern system, from indexing choices to regional deployment to UI feedback, is quietly shaping the number a user eventually feels.
Key Takeaways
- Response time is the total elapsed time from when a request is made to when its complete response is received — and it directly shapes how fast or slow a system feels to a real human being.
- It is made up of many smaller segments — DNS lookup, connection setup, network transmission, server processing, database/cache access, and client-side rendering — each of which can be individually measured and optimised.
- Percentiles (p50, p95, p99) tell the real story, since averages can hide a painfully slow experience affecting a meaningful slice of real users.
- Response time rises under load, often sharply once a system nears its capacity, which is why it must always be discussed alongside throughput and concurrency.
- Timeouts and retries directly trade off reliability against response time, and need to be tuned deliberately rather than left as an afterthought.
- Response time can be a security concern too, through timing attacks that exploit small, measurable differences in how long an operation takes to leak secret information.
- In microservices, whether calls happen sequentially or in parallel is one of the single biggest levers over end-to-end response time — and the slowest unavoidable dependency ultimately sets the floor.
- Perceived response time can be improved through design (progress indicators, skeleton screens, optimistic UI) even when the actual underlying time has not changed.
- Caching, CDNs, and proper database indexing are among the most effective, broadly applicable techniques for reducing response time in real systems.
- Response time should be measured, budgeted, and monitored continuously, not just checked once before launch — a slow, gradual rise is often the earliest visible sign of a deeper problem.
Response time is the closest thing computing has to a direct line into human patience. Every millisecond it measures is a millisecond a real person spent waiting, and every stage in a system’s architecture — from a DNS lookup halfway across the world to a single unindexed database query — contributes its share. Understanding where that time actually goes is the first and most important step toward making any system genuinely feel fast.