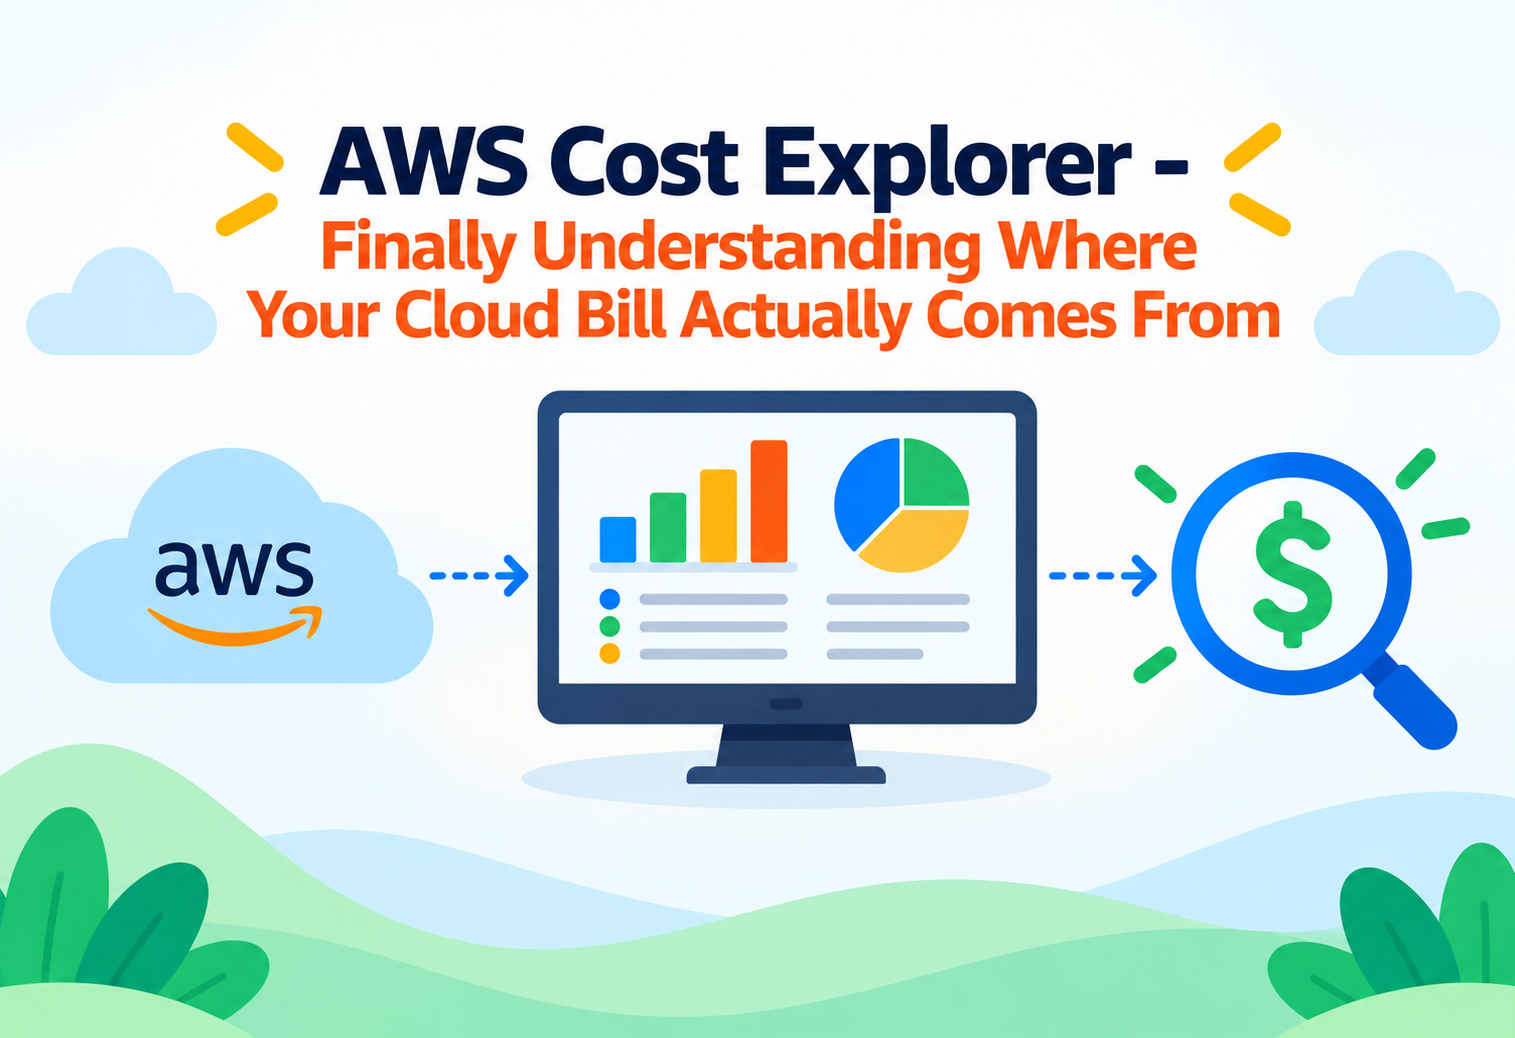
AWS Cost Explorer – Finally Understanding Where Your Cloud Bill Actually Comes From
How a built-in analytics tool turns a confusing monthly invoice into clear charts showing exactly what you're spending, where, and why.
Imagine getting a single, enormous receipt at the end of the month listing hundreds of tiny purchases from dozens of different stores, all mixed together with no clear organization — a few cents here for a coffee, a bit there for groceries, something for a subscription you forgot about — and being asked to figure out exactly why your spending suddenly went up compared to last month. That’s roughly what an AWS bill can feel like to someone managing cloud costs for the first time. AWS provides many different services, and each one can generate its own charges, often in small, easy-to-overlook amounts that add up significantly over time. AWS Cost Explorer exists to turn that confusing pile of numbers into clear, visual charts and breakdowns, helping you actually understand where your money is going, spot unexpected spikes, and plan ahead with confidence. This tutorial explains everything about AWS Cost Explorer from the very beginning, in plain, simple language.
1What Is AWS Cost Explorer?
A visual dashboard for understanding your cloud spending.
AWS Cost Explorer is a free tool built into AWS that lets you visualize, analyze, and understand your spending and usage across all the AWS services you use. Instead of manually digging through a raw billing statement full of numbers, Cost Explorer presents your costs as interactive graphs and tables that you can filter, group, and explore.
It can answer questions like: “How much did I spend last month compared to this month?” “Which specific service is costing me the most?” “Is my spending trending up or down over the past six months?” and “What would happen to my costs if I kept using resources at this same rate?”
Think of a personal budgeting app that connects to your bank account and automatically sorts your spending into categories like groceries, entertainment, and transportation, then shows you colorful charts of where your money actually goes each month. AWS Cost Explorer does the same thing, but for your cloud computing spending instead of your personal finances.
2Why Cloud Costs Are So Easy to Misunderstand
The unique challenges of pay-as-you-go cloud billing.
Cloud computing bills work very differently from a fixed monthly phone or internet bill. AWS charges based on actual usage across potentially dozens of different services, each with their own pricing structure, making it genuinely easy to lose track of where costs are coming from.
Many Services, Many Prices
A single AWS account might use dozens of services, each billed differently — by the hour, by data transferred, by storage used, and more.
Usage-Based Billing
Costs scale with actual usage, meaning a busier month can cost significantly more than a quiet one, without any obvious warning in advance.
Forgotten Resources
It’s common for unused resources, like an idle server left running, to quietly generate charges without anyone noticing right away.
Multiple Teams and Projects
Larger organizations often have several teams using the same AWS account, making it hard to know which team or project is driving specific costs.
Cost Explorer doesn’t change how much you’re billed — it simply makes the existing charges far easier to see, understand, and act on.
3Core Concepts and Terminology
Getting comfortable with the essential vocabulary.
Cost and Usage Report
The underlying detailed data about your AWS usage and charges, which Cost Explorer visualizes in an easier-to-understand form.
Dimension
A way of categorizing your costs — for example, by service, by AWS region, by linked account, or by a custom tag.
Filter
A rule that narrows down which costs are shown, such as viewing charges from only one specific service or time period.
Tag
A custom label you can attach to AWS resources, such as “project-alpha” or “marketing-team,” making it possible to group and track costs by that label.
Forecast
A projection of expected future spending, based on analyzing your past usage patterns.
Budget
A spending threshold you define, often paired with Cost Explorer, that can trigger alerts if actual or forecasted costs approach or exceed it.
A “tag” is like writing a category label on a sticky note and attaching it to a receipt before filing it away — later, you can pull out every receipt labeled “vacation” instead of digging through your entire filing cabinet.
4Slicing Your Costs: Grouping and Filtering
Turning one giant number into meaningful, organized insights.
The real power of Cost Explorer comes from its ability to break a single large total cost down into smaller, more meaningful pieces. Instead of just seeing “you spent $4,500 this month,” you can see exactly which services, regions, or projects contributed to that total.
Service
See how much each individual AWS service (like storage, computing, or databases) contributed to your total bill.
Region
Break down costs by the geographic AWS region where resources were used, useful for companies operating in multiple locations.
Linked Account
For organizations with multiple connected AWS accounts, see spending broken out by each individual account.
Custom Tags
View costs organized by whatever custom categories you’ve defined, such as project name, team, or environment (like “testing” versus “production”).
Beginners sometimes assume Cost Explorer automatically knows which team or project a cost belongs to. In reality, meaningful grouping by project or team requires consistently applying tags to your resources ahead of time.
5How Cost Explorer Processes and Presents Your Data
From raw billing records to a clear, interactive chart.
Usage Occurs
You use various AWS services throughout the day — running servers, storing files, transferring data, and so on.
Detailed Billing Data Is Recorded
AWS records detailed information about this usage and the resulting charges behind the scenes.
Cost Explorer Aggregates the Data
Cost Explorer processes this detailed billing data, organizing it by service, time period, region, and any tags you’ve applied.
You Choose a View
You select a time range, grouping option, and any filters to focus on exactly the cost breakdown you want to see.
Interactive Charts Are Displayed
Cost Explorer renders your selection as visual charts and tables, which you can further explore by clicking into specific categories.
Optional Forecasting
Based on your historical patterns, Cost Explorer can also project what your future costs are likely to look like if trends continue.
flowchart LR
    A[AWS Service Usage] --> B[Detailed Billing Data]
    B --> C[Cost Explorer Aggregation]
    C --> D[Choose Time Range & Grouping]
    D --> E[Interactive Charts & Tables]
    C --> F[Forecast Future Spending]
6Forecasting: Seeing Costs Before They Happen
Using past patterns to anticipate future spending.
One of Cost Explorer’s most valuable features is its ability to forecast future costs based on your historical usage trends. If your spending has been steadily climbing over the past few months, Cost Explorer can project roughly what the next several months might look like if that pattern continues.
It’s similar to a weather forecast — it can’t guarantee exactly what will happen, but by analyzing past patterns, it gives you a reasonably reliable expectation, helping you plan ahead rather than being caught off guard.
7Security and Access Control
Controlling who can view sensitive spending information.
Permission-Based Access
Access to view billing and cost data can be restricted to specific authorized users or teams, rather than being open to everyone.
Scoped Views for Larger Organizations
In organizations with multiple accounts, access can be limited so certain users only see costs relevant to their specific team or project.
Audit Trail
Changes to cost management settings, like budgets or alerts, can be tracked to understand who configured what and when.
Granting broad billing access to every employee “just in case” can unnecessarily expose sensitive financial details that should really be limited to specific finance or leadership roles.
8Common Use Cases
Where Cost Explorer proves genuinely useful in day-to-day operations.
Monthly Cost Reviews
Finance and engineering teams regularly review spending trends to confirm costs align with expectations and catch any surprises early.
Identifying Cost Spikes
When a bill suddenly jumps, Cost Explorer helps pinpoint exactly which service or resource caused the increase.
Chargeback and Cost Allocation
Organizations with multiple teams or clients use tags and grouping to fairly attribute shared cloud costs to the correct department or customer.
Budget Planning
Forecasted spending trends help teams plan upcoming budgets more accurately, based on real historical usage rather than guesswork.
9Advantages, Disadvantages, and Trade-offs
A fair look at what Cost Explorer offers and its limitations.
Advantages
- Free basic access included with every AWS account.
- Clear, interactive visualizations that are far easier to read than raw billing data.
- Flexible grouping and filtering by service, region, account, or custom tags.
- Built-in forecasting to help anticipate future spending.
- No separate software installation required — it’s built directly into the AWS console.
Disadvantages / Trade-offs
- Meaningful grouping by project or team depends on consistently tagging resources beforehand.
- It shows historical and forecasted costs, but doesn’t automatically fix or optimize spending on its own.
- Very detailed, granular analysis for large organizations may require pairing it with more advanced reporting tools.
10Best Practices and Common Mistakes
Getting genuinely useful insights out of your cost data.
Problem
Never applying tags to resources, then later trying to figure out which team or project is responsible for specific costs.
Why It’s Harmful
Without consistent tags, costs end up lumped together in ways that make fair cost allocation or team-level accountability nearly impossible.
Correct Approach
Establish a consistent tagging strategy from the start, applying labels like project name or team to resources as they’re created.
Problem
Only checking Cost Explorer occasionally, or just once at the end of the month, rather than reviewing it regularly.
Why It’s Harmful
Cost spikes or unexpected charges can go unnoticed for weeks, resulting in a much larger surprise bill than necessary.
Correct Approach
Review cost trends on a regular schedule, and pair Cost Explorer with budget alerts for proactive notification of unusual spending.
Set Up Budget Alerts
Pair Cost Explorer’s insights with budget alerts that notify you automatically when spending approaches a defined threshold.
Review Trends, Not Just Totals
Look at how costs are changing over time, not just the current total, to catch gradual increases before they become large problems.
Investigate Unusual Spikes Promptly
When a cost jump appears, use grouping and filtering right away to identify the specific cause while details are still fresh.
11Frequently Asked Questions
Basic Cost Explorer access is included for free with every AWS account, though some advanced reporting features may have additional costs.
Yes, it can display historical cost and usage data going back up to 13 months, giving a solid basis for comparing trends over time.
Forecasts are based on analyzing your historical usage patterns and are generally reasonable estimates, though actual future costs can vary if your usage patterns change significantly.
No, Cost Explorer works out of the box using default groupings like service and region. Tags simply unlock more meaningful, custom groupings like project or team.
Not directly — it’s an analysis and visibility tool. It helps you identify where to take action, but any actual cost-saving changes need to be made separately based on those insights.
12Summary and Key Takeaways
AWS Cost Explorer takes the often confusing, overwhelming experience of reviewing a cloud services bill and turns it into something genuinely understandable. By offering flexible grouping, filtering, historical trends, and forward-looking forecasts, all through clear visual charts, it gives individuals and organizations the visibility they need to actually manage their cloud spending intentionally, rather than reacting in surprise at the end of each month. Paired with good habits like consistent tagging and regular review, Cost Explorer becomes far more than a reporting tool — it becomes the foundation for genuinely informed, confident cloud financial management.
Key Takeaways
- AWS Cost Explorer — a free, built-in tool that visualizes and analyzes your AWS spending and usage.
- Core building blocks — dimensions, filters, tags, forecasts, and the underlying cost and usage data.
- Why it matters — cloud bills combine many services with usage-based pricing, making costs easy to lose track of.
- Grouping and filtering — break total costs down by service, region, account, or custom tags for real clarity.
- Forecasting — projects likely future spending based on historical usage trends.
- Common uses — monthly cost reviews, spike investigation, chargeback allocation, and budget planning.
- Best practice — apply consistent tags early, review trends regularly, and pair insights with proactive budget alerts.