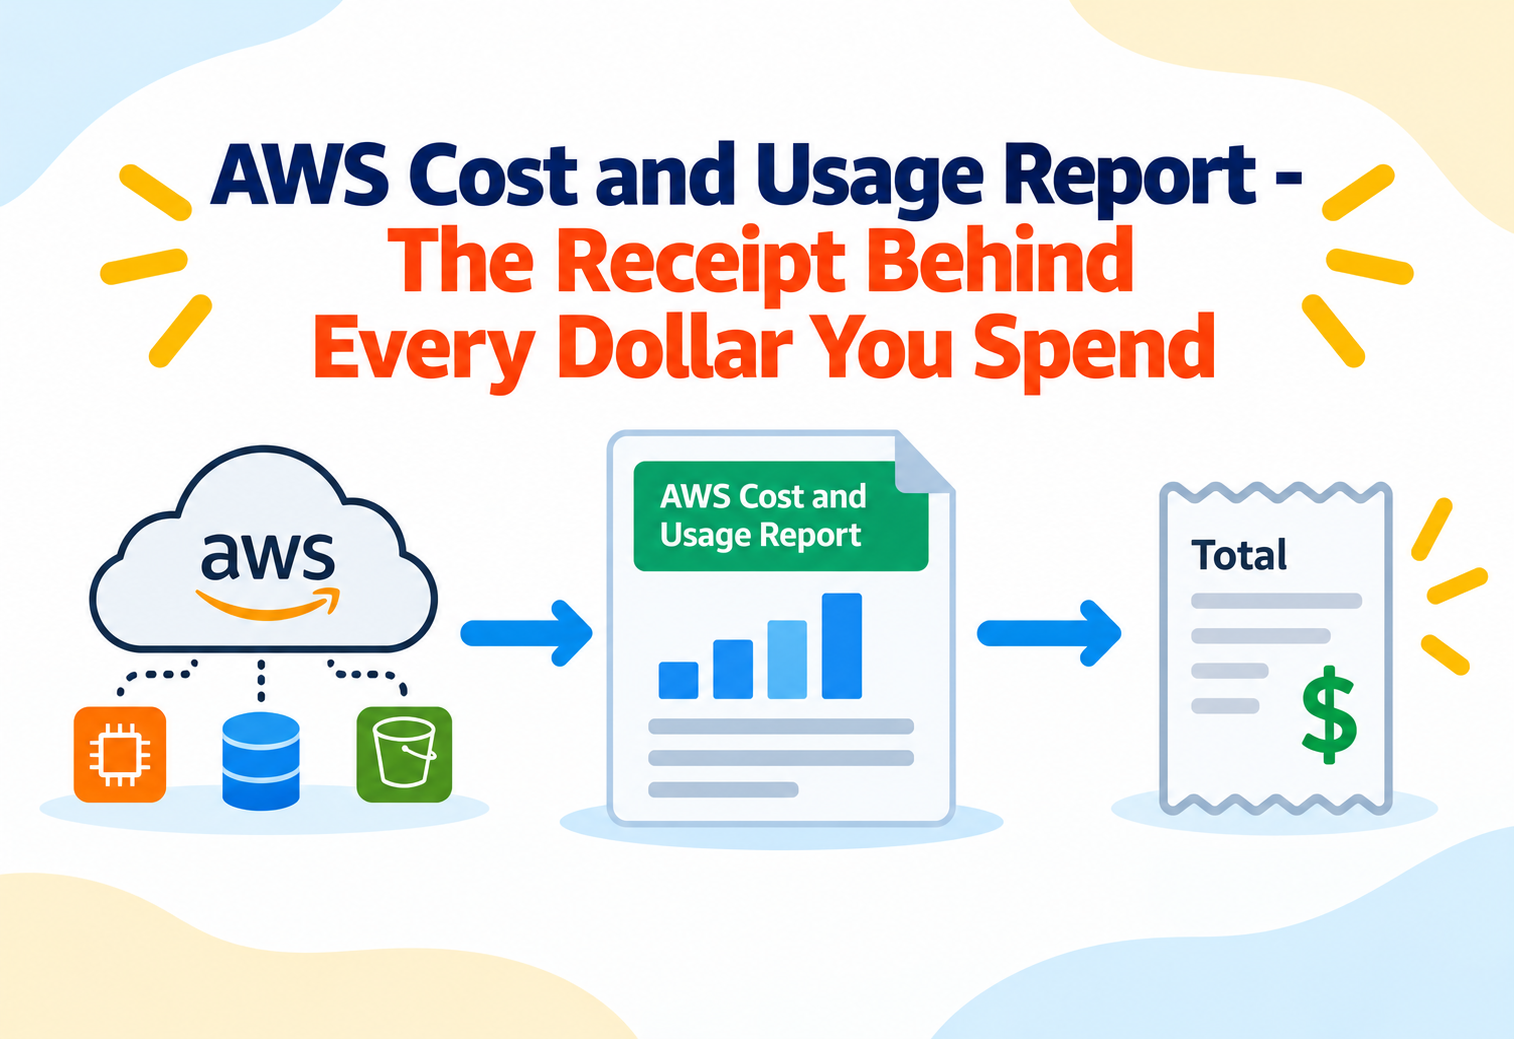
AWS Cost and Usage Report – The Receipt Behind Every Dollar You Spend
The AWS Cost and Usage Report gives you the most detailed, line-by-line breakdown of exactly what you are paying for in the cloud, down to the individual resource.
Imagine going grocery shopping and receiving a receipt that only said “Total: $87.50,” with no list of what you actually bought. You would have no way to know if you were overcharged, which items cost the most, or where you could realistically cut back next time. Now imagine that same vague receipt, but for an entire company’s cloud computing bill, potentially involving thousands of different resources across dozens of services. The AWS Cost and Usage Report exists to solve exactly this problem, providing the most detailed, itemized receipt AWS offers for your cloud spending.
1What Is the AWS Cost and Usage Report?
The single most detailed source of truth for understanding exactly what you are paying for in AWS.
The AWS Cost and Usage Report, often shortened to CUR, is a detailed data export that breaks down your AWS costs and usage down to the individual line item, showing exactly which resource, service, and usage type contributed to every part of your bill. The current recommended version, Cost and Usage Report 2.0 (CUR 2.0), is delivered through a feature called AWS Data Exports, and provides a consistent, well-structured set of columns that can be queried directly using standard SQL tools.
Think of the Cost and Usage Report like an itemized hospital bill, listing every single test, medication, and procedure separately, rather than just showing one lump total. While a lump total tells you how much you owe, an itemized breakdown tells you exactly why, which is essential if you want to understand, question, or optimize any part of that spending.
This level of detail exists because AWS bills can include an enormous variety of charges — different services, different regions, different pricing models, and different individual resources — all contributing to a single overall total. Without a detailed breakdown, it would be nearly impossible to answer questions like “which specific application is driving up our storage costs” or “how much are we really paying for this one particular database.”
Line Item
A single row of billing data representing one specific charge, tied to a particular resource, service, and time period.
AWS Data Exports
The AWS feature used to configure and deliver Cost and Usage Report 2.0 data automatically to your chosen storage location.
Fixed Schema
A consistent, predictable set of columns that does not change unexpectedly from month to month, making long-term analysis more reliable.
Cost Allocation Tags
Labels applied to AWS resources that help attribute costs to specific projects, teams, or departments within the report.
2Why Does This Level of Detail Matter?
Summary numbers tell you how much, but detailed reports tell you why.
Higher-level tools like AWS Budgets or the AWS Cost Explorer dashboard are great for getting a quick, visual sense of overall spending trends, but they often summarize data in ways that hide the finer details. When a business needs to answer very specific questions — such as identifying exactly which team’s testing environment is responsible for an unexpected cost spike — a summarized dashboard view is often not detailed enough.
Without line-item-level detail, cost optimization efforts can end up being little more than guesswork, since teams cannot precisely identify which specific resources or usage patterns are actually driving costs up.
The Cost and Usage Report solves this by providing the raw, detailed data that finance teams, engineers, and automated analysis tools can use to build custom dashboards, run precise queries, and attribute costs accurately across an organization, down to the level of a single resource or usage type.
3How the Cost and Usage Report Works Internally
From raw AWS billing events to a queryable, structured dataset you can analyze directly.
flowchart TD
    A[AWS records billing events across all your usage] --> B[You configure a Cost and Usage Report export]
    B --> C[AWS compiles detailed line items into the CUR 2.0 schema]
    C --> D[Report data is delivered to your chosen Amazon S3 bucket]
    D --> E[Optional integration connects the data to Athena or Redshift]
    E --> F[You query the data using standard SQL]
The Configuration Step
You start by setting up a Cost and Usage Report export through AWS Data Exports, choosing settings such as time granularity (hourly, daily, or monthly), whether to include individual resource-level detail, and which output format you prefer.
The Compilation Step
AWS then compiles all relevant billing line items into the report’s fixed schema, ensuring the columns remain consistent from one report to the next, which is especially helpful for building reliable, long-term analysis tools on top of the data.
The Delivery Step
The finished report is automatically delivered to an Amazon S3 bucket you specify, on a regular, ongoing basis, without requiring you to manually request or download it each time.
The Analysis Step
Once delivered, the report can be queried directly using standard SQL through integrations with services like Amazon Athena or Amazon Redshift, or loaded into other analysis and visualization tools of your choice.
4CUR 1.0 Versus CUR 2.0
AWS has evolved the report format over time, and the newer version is now the recommended approach.
| Aspect | CUR 1.0 (Legacy) | CUR 2.0 (Current) |
|---|---|---|
| Schema Consistency | Columns can vary month to month | Fixed, consistent set of columns |
| Data Structure | Can be sparse across many columns | Nested key-value structure reduces sparsity |
| Delivery Mechanism | Older Cost and Usage Report configuration | Delivered through AWS Data Exports |
| Query Integration | Manual setup typically required | Built-in Athena and Redshift integration options |
AWS recommends CUR 2.0 as the current, forward-looking way to receive detailed cost and usage data, and it offers a documented migration path for organizations still using the legacy CUR 1.0 format.
5Setting Up Your First Cost and Usage Report
A typical path from a fresh AWS account to a fully automated, queryable cost dataset.
Open AWS Data Exports
Navigate to the Data Exports section within AWS Billing and Cost Management to begin configuring your report.
Choose the CUR 2.0 Export Type
Select Cost and Usage Report 2.0 as your export type, taking advantage of its fixed schema and additional columns.
Configure Table Settings
Choose your preferred time granularity, whether to include resource-level detail, and which columns matter most for your needs.
Select a Destination
Point the export to an Amazon S3 bucket where the report data will be delivered automatically going forward.
Enable Query Integration (Optional)
Choose to integrate with Amazon Athena or Amazon Redshift, so your report data is ready for SQL queries without extra manual setup.
Start Analyzing
Once the first export is delivered, begin running queries or building dashboards on top of your detailed cost and usage data.
6What’s Inside a Cost and Usage Report
A closer look at the kinds of information each line item actually contains.
Service and Resource Information
Identifies exactly which AWS service and, optionally, which specific resource generated a given charge.
Usage Amounts
Records precisely how much of a resource was used, such as compute hours or gigabytes of storage.
Pricing and Cost
Shows the exact rate applied and the resulting cost for that specific line item.
Account and Tag Information
Includes account names and cost allocation tags, helping attribute spending to specific teams or projects.
7Advantages, Disadvantages & Trade-offs
Unmatched detail comes with a learning curve and a need for proper tooling.
Advantages
- Provides the most granular, detailed view of AWS costs available.
- Supports precise cost attribution to specific teams, projects, or resources.
- CUR 2.0’s fixed schema makes long-term analysis and automation more reliable.
- Integrates directly with standard SQL analysis tools like Athena and Redshift.
- Delivered automatically on an ongoing basis, without manual, repeated exports.
Disadvantages / Trade-offs
- The raw level of detail can be overwhelming without the right analysis tools in place.
- Requires some familiarity with SQL or data analysis to get full value from the data.
- Organizations still on legacy CUR 1.0 need to plan a migration to benefit from CUR 2.0 improvements.
- Storing and querying very large, detailed datasets can add its own modest storage and compute costs.
8Performance & Scalability
Designed to handle the billing detail of accounts ranging from small to massive in scale.
Because the report is delivered automatically and stored in Amazon S3, it naturally scales to handle the billing detail of accounts ranging from a small personal project to a massive enterprise with thousands of resources across many services. Choosing coarser time granularity, such as daily or monthly instead of hourly, can help manage the size of the dataset for organizations that do not need the finest possible detail, while still preserving accurate, itemized cost information.
9Real-World & Industry Examples
The Cost and Usage Report quietly powers many of the cost dashboards and finance processes businesses rely on.
Chargeback and Showback Reporting
Large organizations use detailed cost data to accurately charge back cloud costs to the specific departments or projects responsible for them.
Cost Optimization Initiatives
Engineering teams analyze line-item data to identify underused or oversized resources that could be resized or eliminated to reduce spending.
Custom Finance Dashboards
Finance teams build custom internal dashboards on top of Cost and Usage Report data, tailored specifically to how their organization tracks and reports spending.
Third-Party Cost Management Tools
Many third-party cloud cost management platforms rely on Cost and Usage Report data as their primary source of detailed AWS billing information.
10Best Practices & Common Mistakes
A few thoughtful choices make the difference between a useful report and an overwhelming pile of data.
Apply consistent cost allocation tags across your resources before setting up your report, so cost attribution by team or project becomes far more accurate and useful.
Choosing the finest possible hourly granularity by default, even when it is not actually needed, which can significantly increase the size and complexity of the dataset without adding meaningful value.
Use the built-in Athena or Redshift integration options when available, rather than building a custom data pipeline from scratch, to get started more quickly and reliably.
Continuing to rely on legacy CUR 1.0 indefinitely without planning a migration, missing out on the schema consistency and integration improvements available in CUR 2.0.
11Design Patterns & Anti-patterns
How experienced finance and engineering teams structure their use of the Cost and Usage Report.
Problem
A team enables the Cost and Usage Report but never actually builds any analysis, dashboards, or queries on top of the resulting data.
Why It’s Harmful
Detailed data sitting unused provides no real benefit, while still incurring the modest storage costs of keeping it in Amazon S3.
Correct Approach
Pair the report with at least a basic Athena or Redshift integration, and build a small set of regular queries or dashboards that the team actually reviews.
Problem
An organization wants accurate chargeback reporting across many internal teams, without building a custom cost-tracking system from scratch.
Why It Works
Combining well-applied cost allocation tags with CUR 2.0’s consistent schema allows automated, reliable attribution of costs to the correct team or project.
Correct Approach
Establish a clear tagging strategy first, then configure the Cost and Usage Report to include those tags, and build reporting queries that group costs accordingly.
12Frequently Asked Questions
AWS recommends CUR 2.0 for new setups, since it offers a consistent, fixed schema and built-in integration with tools like Athena and Redshift.
The report is automatically delivered to an Amazon S3 bucket that you specify when setting up the export.
Basic SQL knowledge is very helpful for querying the data directly, though some tools and dashboards can present the data visually without requiring you to write queries yourself.
Yes. When resource-level detail is enabled, the report can include a specific resource identifier alongside each relevant line item.
Reports are refreshed regularly and automatically, and when integrated with Athena or Redshift, those connected tables reflect the updates without requiring additional manual steps.
While large organizations benefit significantly from its detail at scale, even smaller teams and individual developers can use it to better understand exactly where their AWS spending is going.
13Summary and Key Takeaways
The AWS Cost and Usage Report exists to answer the question that summary dashboards often cannot: exactly what, specifically, is driving every part of your AWS bill. By providing detailed, line-item-level data, and evolving into the more consistent, integration-friendly CUR 2.0 format delivered through AWS Data Exports, this report gives finance teams, engineers, and analysis tools the precise information needed to attribute, understand, and ultimately optimize cloud spending. Paired with good tagging practices and the right analysis tools, it turns a vague monthly total into a clear, itemized story of where every dollar actually went.
Key Takeaways
- The Cost and Usage Report provides line-item detail — the most granular view of AWS spending available.
- CUR 2.0 is the current recommended version, offering a fixed schema and built-in Athena and Redshift integration.
- Reports are delivered automatically to Amazon S3, without needing manual, repeated exports.
- Cost allocation tags make it possible to accurately attribute spending to specific teams or projects.
- SQL-based analysis unlocks the full value of the detailed data the report provides.
- Choosing appropriate time granularity helps balance detail against dataset size and complexity.
- Detailed data only helps if it is actually analyzed — pairing it with real dashboards or queries is essential.