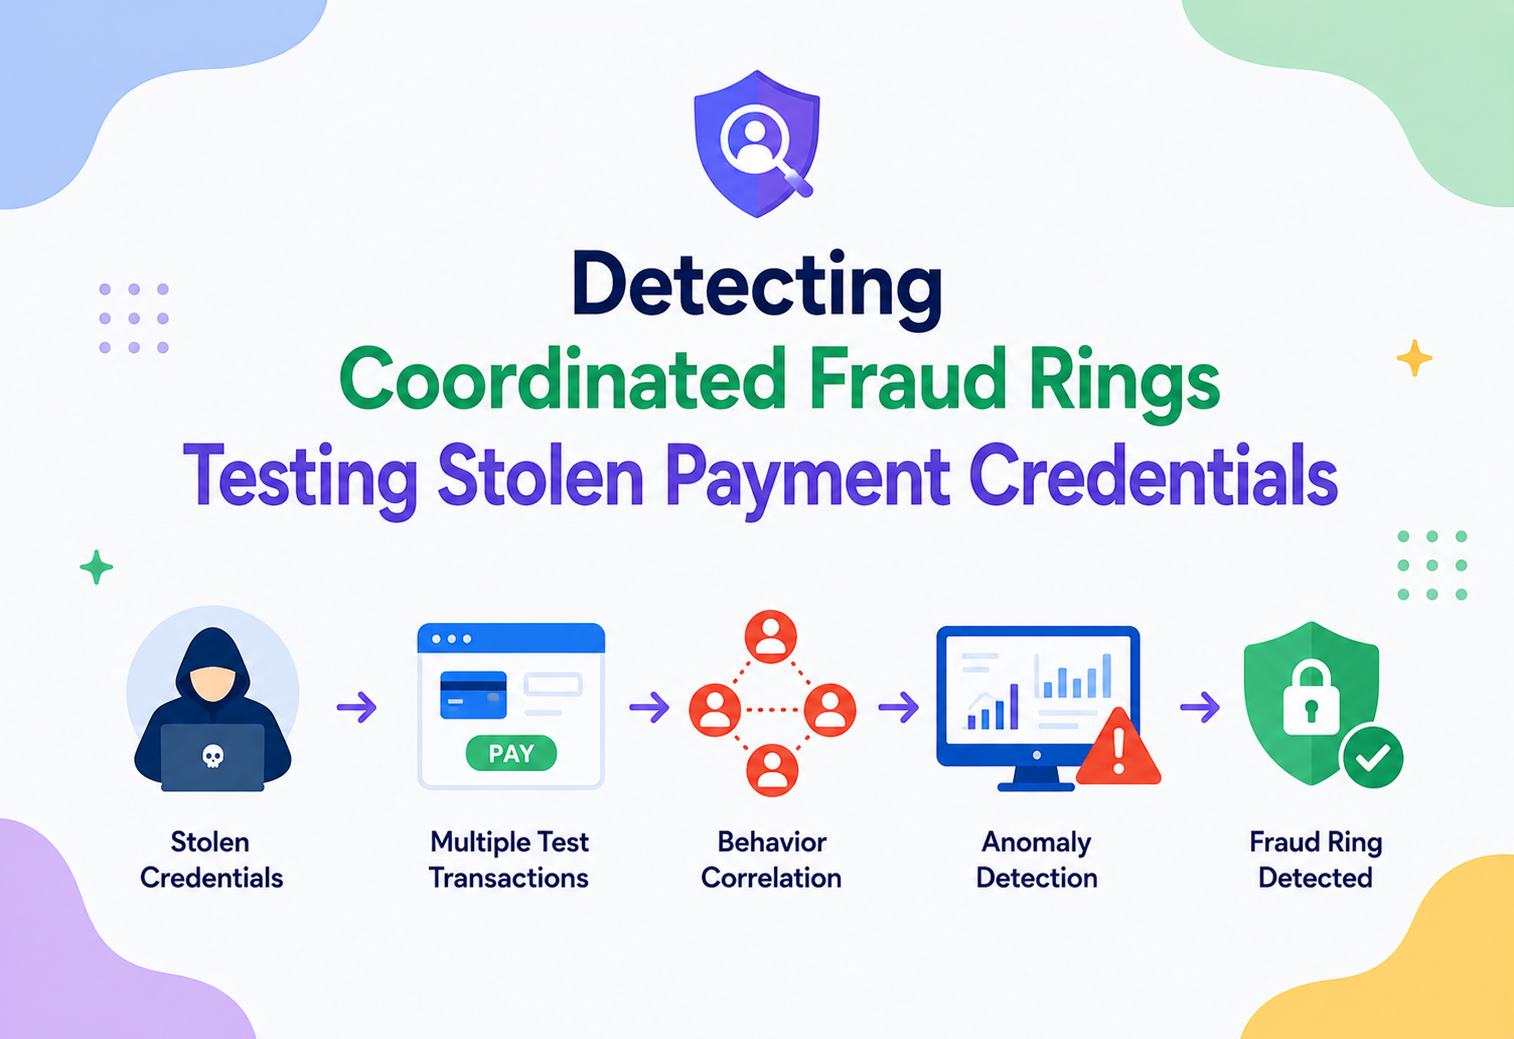
Detecting Coordinated Fraud Rings Testing Stolen Payment Credentials
A production-grade system design deep dive on catching card-testing attacks that scatter tiny, forgettable transactions across many seemingly unrelated merchant accounts. A streaming entity graph, layered detection, community clustering, and adaptive scoring designed for the moment a single merchant sees a raindrop but the platform needs to see the storm.
Introduction & History
Picture a criminal who has just bought a list of ten thousand stolen card numbers on an underground marketplace. Most of those numbers are already expired, cancelled, or attached to accounts with insufficient funds. Before the criminal spends real effort on a big purchase, they need to know which cards are still alive. The cheapest, fastest way to find out is to run each card through a tiny, forgettable transaction — a dollar donation to a charity, a ninety-nine cent app purchase, a small top-up on a prepaid service — at a merchant unlikely to notice or investigate a single small decline or approval. This is called card testing, and it is the reconnaissance phase of a much larger attack.
A single small transaction, viewed by itself at a single merchant, looks like nothing at all: a customer bought a coffee, or tried to and failed. The problem is that the same criminal is running this exact play across hundreds or thousands of merchants simultaneously, using automated tooling, and no individual merchant ever sees more than their own tiny slice of the pattern.
This is precisely why card testing is so hard to catch with traditional, merchant-scoped fraud detection. Each merchant’s own fraud system evaluates each transaction in isolation, or at best against that one merchant’s own transaction history, and a single one-dollar transaction on a stolen card simply does not look alarming on its own. It is only when you can see across merchant boundaries — correlating a burst of similar small transactions using overlapping cards, devices, IP addresses, or timing patterns across dozens of unrelated businesses — that the coordinated nature of the attack becomes visible.
1.1 A brief history of cross-merchant fraud detection
Siloed origins
Fraud detection was historically built merchant by merchant, or at best bank by bank, because payment data was siloed by design, partly for competitive reasons and partly for genuine privacy and regulatory reasons.
Card networks as first cross-cutting vantage
Card networks sat in a unique position, seeing transactions across every merchant and every issuing bank that used their rails. It is largely card networks and large multi-tenant payment processors who pioneered cross-merchant fraud ring detection, precisely because they were the only parties structurally positioned to see the pattern at all.
Processor consolidation opens a new door
As payment processing consolidated around a smaller number of very large platforms, many businesses now process payments through the same handful of processors, a new opportunity emerged: a processor serving hundreds of thousands of merchants can, with the right infrastructure, detect a coordinated card-testing campaign within minutes of it starting.
Streaming graphs and ML
Modern designs combine high-throughput streaming pipelines, purpose-built entity graphs, community detection, and machine learning scoring — enabling detection well before any individual merchant would notice anything unusual in their own dashboard.
“Why can’t each merchant simply rate-limit small transactions to defend against this on their own?” A strong answer explains that per-merchant rate limiting helps but is fundamentally limited, because a sophisticated fraud ring deliberately spreads its testing traffic thin across many merchants specifically so that no single merchant’s volume ever crosses a suspicious threshold; the attack is only visible in aggregate, across merchant boundaries.
1.2 Framing the problem precisely
It helps to state the design goal precisely before diving into architecture. The system must ingest transaction and authorization events from a large, diverse population of merchant accounts, correlate signals across those events using shared underlying entities such as devices, network origins, and timing patterns, and surface a confident, actionable alert identifying a coordinated card-testing campaign fast enough to interrupt it before the compromised credentials are used for larger, more damaging transactions elsewhere. It must do this while keeping the false positive rate low enough that legitimate commerce is not meaningfully disrupted, and while respecting the data governance boundaries inherent in correlating information across many independent merchant relationships.
“How would you define success for this system in a single sentence a business stakeholder would understand?” A strong answer frames it around measurable outcomes: minimizing the value of fraud that successfully passes through the platform by catching coordinated testing campaigns during their earliest, lowest-value reconnaissance phase, while keeping the friction imposed on legitimate customers — measured in unnecessary blocks or step-up challenges — within an acceptable, continuously monitored bound.
Architecture & Components
The system is built around one central idea: individual transactions are cheap and mostly meaningless in isolation, but the relationships between transactions — shared cards, shared devices, shared network origins, shared timing — are where the signal actually lives. The architecture is therefore organized around a real-time entity graph, not a traditional per-transaction scoring pipeline alone.
graph TB
    subgraph INGEST["Ingestion Layer"]
        MERCH["Merchant Transaction Streams thousands of accounts"]
        ACQ["Acquirer Processor Feed"]
    end

    subgraph STREAM["Streaming Pipeline"]
        COLLECT["Event Collector"]
        ENRICH["Enrichment Service device IP BIN geo"]
        FEATSTORE["Real Time Feature Store"]
    end

    subgraph GRAPH["Entity Graph Engine"]
        RESOLVE["Entity Resolution Service"]
        GRAPHDB["Streaming Entity Graph cards devices IPs merchants"]
        CLUSTER["Community Detection Clustering"]
    end

    subgraph SCORING["Detection Layer"]
        RULES["Velocity and Heuristic Rules Engine"]
        MODEL["ML Ring Scoring Model"]
        RANK["Alert Prioritization Service"]
    end

    subgraph RESPONSE["Response Layer"]
        CASE["Case Management System"]
        BLOCK["Real Time Block or Step Up Service"]
        NOTIFY["Issuer and Network Notification"]
    end

    MERCH --> COLLECT
    ACQ --> COLLECT
    COLLECT --> ENRICH
    ENRICH --> FEATSTORE
    ENRICH --> RESOLVE
    RESOLVE --> GRAPHDB
    GRAPHDB --> CLUSTER
    CLUSTER --> MODEL
    FEATSTORE --> RULES
    FEATSTORE --> MODEL
    RULES --> RANK
    MODEL --> RANK
    RANK --> CASE
    RANK --> BLOCK
    CASE --> NOTIFY
    BLOCK --> MERCH
2.1 Core components
Event Collector
Every authorization request and transaction event across every participating merchant account flows into a single event collector, typically consuming from a high-throughput streaming platform. Its only job is fast, reliable ingestion: it does not evaluate fraud risk itself, it simply normalizes incoming events into a common schema and forwards them downstream with minimal added latency.
Enrichment Service
Raw transaction events carry a card token, a merchant ID, an amount, and a timestamp. Enrichment resolves the card’s BIN, resolves the originating IP to an approximate geolocation and reputation score, extracts a device fingerprint from available telemetry, and attaches any known risk signals already associated with these entities. This happens inline — the entity graph downstream is only as useful as the entities it can actually link together.
Entity Resolution Service
Decides which real-world or logical entities a given transaction touches — which card, which device, which IP, which merchant — and critically resolves near-duplicate or slightly varied representations of the same underlying entity, so the graph does not fragment a single attacker’s footprint into many disconnected, individually unremarkable nodes.
Streaming Entity Graph
A continuously updated graph where nodes represent entities (cards, devices, IPs, merchants) and edges represent observed co-occurrence. Unlike a traditional graph DB optimized for infrequent updates and complex offline queries, this graph is optimized for extremely high-throughput streaming writes and low-latency neighborhood queries.
Community Detection
Periodically and incrementally, community-detection algorithms identify densely connected clusters of cards, devices, and IPs that are unusually interconnected relative to legitimate patterns — the signature a coordinated card-testing ring leaves behind, even though no single transaction looks suspicious on its own.
Velocity & Heuristic Rules Engine
Alongside graph-based detection, a complementary rules engine tracks simple, fast, explainable velocity signals: how many distinct cards a device has attempted, how many merchants an IP has touched, how many small-value transactions a card has attempted in rapid succession — catching the most blatant patterns cheaply and with very low latency.
Ring-Scoring Model
A machine learning model, trained on graph-derived features, cluster density metrics, and historical confirmed rings, produces a probability score for whether a given cluster represents coordinated credential testing rather than coincidental overlap (a shared corporate network or a popular public Wi-Fi hotspot).
Case Management & Real-Time Block
High-confidence alerts flow into case management for analyst review; sufficiently high-confidence signals trigger automated responses directly — step-up authentication challenges or temporary transaction blocking for the specific cards and devices implicated — without waiting for human review when evidence is strong enough.
“Why build a custom streaming graph instead of using an off-the-shelf graph database?” Most general-purpose graph databases are optimized for complex analytical queries over a relatively slowly changing graph, whereas this system needs extremely high-throughput writes (millions of new edges per minute) combined with very low-latency neighborhood lookups on the hot path — a combination that usually requires a purpose-built or heavily customized streaming graph implementation.
2.2 Core data structures behind the graph engine
The streaming entity graph is not implemented as a single monolithic structure but as a combination of purpose-built pieces, each chosen for the specific access pattern it must serve under extreme throughput. New edges arriving from the enrichment layer are first written into an append-only edge log — similar in spirit to the durable ledger pattern used in transactional financial systems — which gives the system a complete, replayable history of every observed relationship and makes it possible to reconstruct the exact graph state at any past point in time for forensic investigation.
Layered on top of this append-only log sits an in-memory adjacency structure, essentially a sharded hash map from entity identifier to a compact, frequently pruned list of its most recent neighbors, optimized specifically for the “what does this entity’s immediate neighborhood look like right now” query that both the velocity rules engine and the clustering process rely on constantly. For approximate distinct-count tracking used by velocity signals, the system layers in probabilistic sketches (discussed further in the performance chapter) rather than exact set structures, since exact tracking at this scale would be prohibitively expensive in both memory and computation.
Internal Working
To see how this actually catches a fraud ring, walk through what happens as a coordinated card-testing campaign unfolds in real time.
Step one — the first few transactions look clean
The fraud ring’s automated tooling begins submitting one-dollar or smaller transactions across a rotating set of merchant accounts, each individual transaction using a different stolen card, but a shared pool of a small number of devices and IP addresses (often proxied or rotated but with detectable underlying patterns). At this earliest stage, each individual transaction passes through each merchant’s own fraud checks without issue, since nothing about any single transaction is unusual.
Step two — the graph starts to densify
As these transactions stream through the Event Collector and Enrichment Service, the Entity Resolution Service adds new nodes and edges to the streaming entity graph: new card nodes connect to a small, shared set of device and IP nodes across an increasingly wide set of merchant nodes. Within the first few dozen transactions, a distinctive pattern begins to emerge in the graph’s local structure: an unusually high ratio of distinct cards to distinct devices, and an unusually wide spread of distinct merchants relative to the short time window involved, both signatures that are extremely rare in legitimate transaction patterns.
Step three — velocity rules fire early warnings
Concurrently, the Velocity and Heuristic Rules Engine, watching simpler aggregate counters per device and per IP, crosses its own threshold (for example more than a defined number of distinct cards attempted from a single device within a short rolling window) and raises a fast, low-latency preliminary signal well before the more computationally expensive graph clustering pass has run.
Step four — community detection confirms the cluster
The incremental community detection process, running continuously over the most recently active portion of the graph rather than the entire historical graph, identifies the newly densified region as a distinct, tightly connected community with structural properties matching previously confirmed fraud rings: high card-to-device ratio, high merchant spread, tight time clustering, and low overlap with any legitimate customer behavior pattern the model has learned to expect.
Step five — the ML model scores the cluster
Graph-derived features describing this cluster (its density, its growth rate, its merchant diversity, its similarity to known historical fraud ring fingerprints) are fed into the ML Ring-Scoring Model, which returns a high-confidence probability score that this cluster represents coordinated credential testing rather than coincidental overlap.
Step six — automated and human response
Given a sufficiently high confidence score, the system automatically flags every card, device, and IP address in the identified cluster for step-up authentication or outright blocking on any subsequent transaction attempt, and simultaneously opens a case for human fraud analyst review. The analyst can examine the full graph visualization, confirm the finding, and take further action such as notifying the affected card-issuing banks so they can proactively reissue the compromised cards before the ring moves on to larger transactions.
sequenceDiagram
    participant Ring as Fraud Ring Tooling
    participant Merch as Multiple Merchants
    participant Collect as Event Collector
    participant Enrich as Enrichment Service
    participant Graph as Entity Graph
    participant Cluster as Community Detection
    participant Model as ML Scoring Model
    participant Case as Case Management

    Ring->>Merch: Small test transactions rotating cards
    Merch->>Collect: Transaction events
    Collect->>Enrich: Normalize and enrich
    Enrich->>Graph: Add nodes and edges
    Graph->>Cluster: Incremental community detection
    Cluster->>Model: Cluster features
    Model->>Case: High confidence ring score
    Case->>Merch: Block or step up implicated cards and devices
“How quickly can this system realistically detect a ring, and why does that speed matter?” Detection speed matters because the entire point of the reconnaissance phase is to work quickly before defenses can react, so a system that only aggregates and analyzes overnight in a batch job is nearly useless for interrupting an active attack. A streaming graph and low-latency velocity rules can realistically surface high-confidence alerts within minutes of a campaign starting, fast enough to block later, higher-value transactions from the same compromised card set before real damage occurs.
Graph Theory & Distributed Systems Concepts Behind Ring Detection
It is worth stepping back from the specific components to examine the underlying theoretical ideas that justify why a graph-based approach works well for this problem, and what distributed systems trade-offs are involved in actually implementing it at scale.
4.1 Why community detection, not simple threshold counting
A naive approach might simply count, for each device or IP, how many distinct cards it has touched within a window, and flag anything above a fixed threshold. This works for blatant, unsophisticated attacks but fails against a ring that deliberately spreads its testing traffic across a slightly larger, coordinated pool of devices and IP addresses, each individually staying below any single simple threshold while the overall cluster remains just as suspicious in aggregate. Community detection algorithms, which identify groups of nodes that are far more densely interconnected with each other than with the rest of the graph, catch this distributed pattern precisely because they evaluate structural density across a whole neighborhood rather than a single entity’s own individual count — making them far more resistant to an attacker’s attempt to stay under any single fixed threshold.
4.2 Graph sketching and approximate algorithms
Running exact, full community detection algorithms — which are often computationally expensive — over a graph with hundreds of millions of nodes and billions of edges on every single new transaction is not feasible. Production systems instead rely on incremental and approximate graph algorithms, updating only a bounded local neighborhood around newly changed nodes and edges rather than recomputing global graph structure, and accepting a small, well-understood approximation error in exchange for keeping detection latency within a practical, useful window measured in seconds rather than hours.
4.3 Consistency model for the graph
Unlike the strict, immediate consistency required for a financial ledger tracking real money, the entity graph can tolerate a small amount of eventual consistency — a newly added edge might take a brief moment to propagate to every replica or partition boundary — without meaningfully undermining the detection mission, since the relevant patterns this system looks for typically develop over many transactions across at least several seconds to minutes, not single milliseconds. This relaxed consistency requirement, compared to a payment authorization system, is precisely what allows the graph engine to prioritize throughput and horizontal scalability over the stricter consistency guarantees that would otherwise limit its performance.
4.4 Partition tolerance and the CAP trade-off
Given the graph’s tolerance for eventual consistency, the system deliberately leans toward availability during a network partition rather than consistency, continuing to accept and process new transaction events even if a portion of the graph is temporarily unreachable from a given region, and reconciling any resulting divergence once connectivity is restored. This is the opposite trade-off from an aggregate exposure or payment authorization system, and the difference is intentional: the cost of a brief, partial blind spot in fraud detection is real but bounded and recoverable, whereas the cost of unavailability in a live payment authorization path would directly block legitimate commerce.
4.5 Concurrency in high-throughput graph writes
Because many transaction events touching the same hot entities — a popular shared IP range, a widely used payment gateway device fingerprint — can arrive concurrently, the graph engine uses lock-free or fine-grained locking strategies for edge insertion, favoring append-friendly data structures that allow many concurrent writers to add new edges without contending for a single exclusive lock, which would otherwise become a severe bottleneck precisely on the hottest, most detection-relevant portions of the graph.
“Why does this system tolerate eventual consistency in the graph when a payment system typically cannot?” A payment authorization decision has an immediate, irreversible financial consequence that demands strict consistency, while a fraud detection signal is inherently probabilistic and evaluated over a window of multiple transactions, meaning a brief propagation delay in graph state changes the detection timing only marginally rather than causing an incorrect financial outcome. That is exactly why this system can and should make a different CAP trade-off than a payment ledger.
Data Flow & Lifecycle
An individual transaction’s journey through this system, and the graph structure it contributes to, moves through several distinct stages, each adding a different kind of value to the overall detection capability.
5.1 Stages of the pipeline
- Raw ingestion. The transaction arrives as a raw event carrying only what the originating merchant or acquirer naturally captures: a tokenized card reference, a merchant identifier, an amount, a timestamp, and whatever device or network metadata was available at the point of sale or checkout.
- Enrichment and normalization. The event is enriched with derived attributes — issuing bank identification, approximate geolocation, network reputation scores for the originating IP, and a resolved device fingerprint — then normalized into the system’s common internal schema so that downstream components never need to know which specific merchant or acquirer originally produced the event.
- Graph integration. The enriched event contributes new nodes (if any of its entities have not been seen before) and new edges representing the co-occurrence relationships this transaction establishes between those entities, with each edge carrying a timestamp and weight that can decay over time so that old, no-longer-relevant relationships naturally fade from influencing current detection without requiring an explicit deletion process.
- Clustering and scoring. The affected region of the graph is evaluated, incrementally rather than by recomputing the entire graph’s structure from scratch, for newly formed or newly strengthened dense communities, and any resulting cluster is scored by the ML model for its likelihood of representing coordinated fraudulent activity.
- Alerting and case creation. Clusters scoring above a defined confidence threshold generate an alert, which either triggers an immediate automated response for very high-confidence cases or opens a case for human analyst review for moderate-confidence cases where additional judgment adds real value.
- Feedback and model retraining. Analyst decisions — confirmed fraud ring or false positive — flow back into the training data used to periodically retrain the ML Ring-Scoring Model. Confirmed fraud ring examples also refine the specific structural signatures the community detection process treats as suspicious, creating a continuously improving feedback loop rather than a static, one-time-trained detection system.
| Stage | Primary Question Answered | Typical Latency |
|---|---|---|
| Raw ingestion | What happened, where, and when. | Milliseconds |
| Enrichment | What entities does this transaction actually touch. | Tens of milliseconds |
| Graph integration | How does this connect to everything else recently seen. | Tens of milliseconds |
| Clustering and scoring | Does this region of the graph look like a coordinated ring. | Seconds to low minutes |
| Alerting and response | What should happen next, and how urgently. | Immediate for automated response, hours for analyst review |
Large payment processors serving a broad, diverse base of small and medium merchants are particularly well positioned to catch this pattern, precisely because a fraud ring targeting many small merchants to stay under any single merchant’s radar inadvertently concentrates a large share of its total activity onto whichever processor serves the largest slice of that small-merchant population — making the cross-merchant graph unusually dense and detectable from that processor’s vantage point.
5.2 A worked example through the lifecycle
Consider a ring that has acquired two hundred stolen card numbers and plans to test them using a pool of six proxy IP addresses and four device fingerprints, spread across roughly one hundred fifty different small merchants over a thirty-minute window. Individually, each merchant sees perhaps one or two small transactions, nothing that would trip any reasonable merchant-level alert.
As these events stream through enrichment and into the graph, the entity resolution service recognizes that the six IP addresses and four devices are recurring across an unusually large and rapidly growing set of distinct card and merchant nodes. Within the first few minutes, the velocity rules engine’s device-level distinct-card counters cross their threshold and raise an early, lower-confidence signal. By around the ten-minute mark, incremental community detection identifies a tightly bound cluster spanning the six IP addresses, four devices, and by then perhaps sixty of the two hundred cards, with a card-to-device ratio and merchant spread far outside the range seen in legitimate traffic. The ML model scores this cluster with high confidence, and the system automatically flags the remaining, not-yet-attempted cards in the same batch pattern for step-up authentication the moment they appear — interrupting the ring roughly two-thirds of the way through its planned campaign rather than allowing it to complete undetected.
5.3 Handling ambiguous or borderline clusters
Not every densely connected cluster the graph surfaces is unambiguous. Some legitimate scenarios — a small business processing payments for a community event, a shared family device used across several household members’ cards — naturally produce moderate density that superficially resembles the early signature of a testing campaign. For these borderline cases, the lifecycle includes an intermediate state beyond simple approve or decline: a watch state, where the implicated entities are monitored more closely and subjected to lighter-weight friction (such as an additional verification step) without an outright block, while the system continues accumulating evidence over a longer window to resolve the ambiguity one way or the other before committing to a more definitive action.

Advantages, Disadvantages & Trade-offs
Every meaningful design choice in this system is a bet on which trade-off is worth accepting. Understanding the shape of those bets is what separates a demo-quality detection prototype from a genuinely useful production system.
6.1 Advantages of cross-merchant graph detection
- Visibility into patterns that are structurally invisible to any single merchant’s own fraud system, since the signal only exists in the relationships between transactions across merchant boundaries.
- Early interruption of fraud rings during their low-value reconnaissance phase, before they progress to larger, more damaging transactions using confirmed-live cards.
- Protection extends across the entire merchant population served by the platform simultaneously, meaning even a merchant with no fraud expertise of their own benefits from detection driven by patterns observed elsewhere in the network.
- Rich forensic context for card-issuing banks, who can proactively reissue compromised cards based on a confirmed ring detection rather than waiting for individual cardholders to report unauthorized charges.
6.2 Disadvantages and costs
- Significant infrastructure complexity and cost — maintaining a high-throughput streaming graph and continuous clustering pipeline is considerably more expensive than traditional per-transaction rule evaluation.
- Risk of false positives affecting legitimate shared-infrastructure scenarios, such as a large public event where many genuine customers happen to share a Wi-Fi network and IP address while making unrelated small purchases.
- Requires broad data access across many merchants, which raises legitimate data governance, privacy, and competitive-sensitivity questions that must be carefully addressed through contractual and technical safeguards.
- Detection latency, while much faster than manual investigation, is still not instantaneous for the graph-based signals, meaning a small window of undetected activity is an inherent, unavoidable trade-off of this approach.
6.3 Trade-off: precision vs. recall in ring detection
Tuning the system toward higher recall — catching more true fraud rings — inevitably increases false positives, flagging legitimate shared-network scenarios as suspicious, which creates real friction and cost: blocked legitimate transactions, unnecessary step-up authentication challenges, and wasted analyst investigation time. Tuning toward higher precision reduces that friction but risks missing genuine fraud rings, particularly more sophisticated ones deliberately designed to stay just below detection thresholds. Production systems typically address this by using automated blocking only for the highest-confidence tier of alerts, while routing moderate-confidence alerts to human review rather than forcing a single global threshold to serve both goals simultaneously.
6.4 Trade-off: real-time streaming graph vs. periodic batch analysis
A simpler, cheaper alternative design would run graph clustering as a periodic batch job (hourly or daily) over accumulated transaction data rather than maintaining a continuously updated streaming graph. Batch analysis is significantly cheaper to build and operate but sacrifices exactly the speed advantage that makes this detection valuable in the first place, since a fraud ring can complete its entire reconnaissance phase and move on to real, damaging transactions well within a single batch cycle if detection only runs once a day.
“How would you handle a large legitimate event, like a stadium concert, that creates a burst of unrelated transactions from a shared network in a short window?” Incorporate contextual signals beyond raw density: whether the transaction amounts and merchant categories are consistent with a legitimate shopping pattern, whether the cards involved have long-standing legitimate transaction histories elsewhere, and whether known public venue IP ranges can be explicitly modeled and given a higher baseline tolerance — rather than relying on graph density alone to distinguish coordinated fraud from coincidental legitimate clustering.
6.5 Trade-off: building in-house vs. third-party fraud intelligence
An institution can choose to build this entire cross-merchant graph detection capability in-house, which offers maximum control and the ability to tune detection tightly to its own specific merchant population and risk appetite, or it can subscribe to a third-party fraud intelligence service that aggregates signals across a much broader, cross-institutional population than any single platform could observe alone. Building in-house is a substantial, ongoing engineering investment but keeps proprietary detection logic and merchant data fully internal, while relying on a third-party service reduces engineering burden and often provides access to a broader signal pool, at the cost of dependency on an external provider’s own reliability, pricing, and roadmap. Many large institutions ultimately adopt a hybrid approach: building core in-house detection for their own transaction population while supplementing it with external threat intelligence feeds for signals (such as globally known compromised card ranges) that no single institution could reasonably observe entirely on its own.
6.6 Trade-off: merchant-level opt-in vs. platform-wide default protection
Some platforms design this capability as an opt-in feature merchants must explicitly enable, giving merchants control and avoiding surprise behavior changes to their checkout flow, while others enable it as a platform-wide default protection, reasoning that the value of a dense, comprehensive graph depends on broad participation, and that a fraud ring able to selectively target only merchants who opted out would simply route around the defense entirely. Platforms that choose the default-on approach typically pair it with clear, accessible opt-out controls and transparent reporting so merchants retain meaningful control even without needing to take affirmative action to be protected.
Performance & Scalability
At the scale of a large multi-tenant payment platform, the ingestion pipeline must sustain millions of transaction events per minute across peak periods, with enrichment and graph integration completing within tens of milliseconds so that graph state is fresh enough to support near-real-time velocity checks on the very next transaction from a related entity.
7.1 Graph partitioning strategy
Because entities are highly interconnected by design — the whole point of the graph is to find these connections — naive partitioning by a single entity type quickly leads to partitions that must constantly communicate across boundaries to answer even simple neighborhood queries. Production systems typically use a partitioning strategy that keeps recently active, densely connected subgraphs co-located on the same processing node wherever possible, using techniques such as edge-cut minimizing partitioning or dynamic entity affinity routing, accepting some added complexity in exchange for dramatically fewer expensive cross-partition graph traversals on the hot path.
7.2 Probabilistic data structures for velocity counting
Exact velocity counting — precisely how many distinct cards a given device has touched in the last hour — becomes expensive at scale if implemented naively with exact set membership tracking across millions of devices. Production systems commonly use probabilistic data structures such as HyperLogLog for approximate distinct-count estimation and Bloom filters for fast approximate set membership checks, trading a small, well-understood margin of statistical error for dramatically reduced memory footprint and computation cost. This is an entirely acceptable trade-off for a signal that feeds into a broader multi-signal scoring decision rather than standing alone as the sole determinant of a block decision.
7.3 Incremental vs. full graph recomputation
Recomputing community detection over the entire historical graph on every new transaction would be computationally infeasible at this scale. Production systems instead use incremental clustering algorithms that efficiently update only the affected region of the graph when new edges are added, combined with a periodic, less frequent full recomputation pass over a bounded recent time window to catch any subtler patterns that incremental updates alone might miss.
7.4 Time-windowed graph decay
Old edges and nodes that have had no recent activity are decayed and eventually pruned from the active hot graph, keeping the working graph’s size bounded and query latency predictable, while historical graph snapshots are retained in cheaper, colder storage for forensic investigation and model training purposes without burdening the real-time detection path.
7.5 Load shedding during attack spikes
Ironically, a very large, aggressive fraud ring attack can itself generate enough transaction volume to stress the detection system precisely when it matters most. The pipeline implements prioritized processing, ensuring that velocity rule evaluation — the cheapest and fastest detection layer — always keeps up even under extreme load, while more expensive graph clustering work can shed load gracefully by processing a representative sample or deferring the least time-sensitive portions of the workload during a genuine capacity crisis, rather than allowing the entire pipeline to fall behind uniformly and delay every signal equally.
“Why use probabilistic data structures instead of exact counting for velocity signals, given that this is a fraud detection system where accuracy matters?” Distinguish between the final blocking decision, which should rely on multiple corroborating signals and can tolerate a human review step for moderate-confidence cases, and the individual velocity counters that feed into that decision, where a small, statistically bounded approximation error is an entirely reasonable trade for the massive memory and compute savings needed to track these counts across millions of entities in real time.
7.6 Latency budget across the detection layers
It is useful to explicitly allocate a latency budget across each stage of the pipeline rather than only targeting a single end-to-end number. A practical breakdown might allocate a few milliseconds for event collection and normalization, a similar amount for enrichment lookups against cached reference data, tens of milliseconds for graph integration and immediate velocity counter updates, and a separate, more generous budget of low single-digit seconds for incremental clustering and ML scoring — since these heavier computations are deliberately decoupled from the fast path that determines whether the originating transaction itself is approved or declined at the point of sale.
7.7 Horizontal scaling of clustering workers
The clustering workers responsible for incremental community detection are scaled horizontally by assigning each worker responsibility for a defined set of graph partitions, with a coordinator process rebalancing partition assignments as partitions grow or shrink in size and activity, ensuring that no single worker becomes a bottleneck simply because its assigned partitions happen to contain an unusually active region of the graph during a given time window.
7.8 Cost-aware scaling during normal vs. attack conditions
Because detection workload spikes are driven by attacker behavior rather than predictable, gradual growth in legitimate transaction volume, the system’s autoscaling policy is tuned specifically to react quickly to sudden bursts in graph edge creation rate — a strong leading indicator of an active attack — rather than relying solely on general infrastructure metrics like overall request volume, which might not spike nearly as sharply during a card-testing campaign concentrated on a relatively modest absolute transaction count spread across many merchants.
High Availability & Reliability
An outage in this system does not stop payments from processing — individual merchant transaction flows continue independently — but it does mean the platform temporarily loses its cross-merchant fraud visibility, effectively going blind to coordinated attacks during the outage window. The system is designed for high availability with a clear-eyed understanding that a brief detection outage, while undesirable, is a fundamentally different risk category than an outage in a payment authorization path itself.

8.1 Multi-region deployment
The streaming pipeline and graph engine are deployed across multiple regions with active-active processing where feasible, and the entity graph itself is partitioned and replicated so that a regional failure does not create a large blind spot in graph coverage — though some added latency in cross-region graph consistency is an accepted trade-off given the detection latency budget is already measured in seconds to minutes rather than milliseconds.
8.2 Graceful degradation of detection layers
If the more computationally expensive graph clustering and ML scoring layers experience a slowdown or partial outage, the system falls back to the faster, cheaper velocity rules engine as a baseline safety net, ensuring the most blatant, high-volume attack patterns are still caught even while the more sophisticated detection layers recover, rather than losing all detection capability simultaneously.
8.3 Data durability for forensic and regulatory needs
Transaction events, enrichment data, and graph snapshots are durably persisted with appropriate retention periods, since confirmed fraud ring investigations often require reconstructing exactly what the graph looked like at a specific historical point in time, both for internal case review and for cooperation with card networks and law enforcement investigating a broader criminal operation.
“If the ML scoring layer goes down entirely, what happens to detection?” A layered fallback: velocity rules continue operating independently and catch the most obvious patterns, previously flagged high-confidence clusters remain blocked based on their last known state, and newly forming subtler clusters that would have required ML scoring to distinguish from coincidence are queued for scoring as soon as the layer recovers — rather than being silently dropped or, worse, automatically approved by default during the outage.
8.4 Chaos testing for the detection pipeline
Teams operating this system regularly run controlled failure injection exercises, deliberately degrading or disabling individual pipeline stages in a staging environment that mirrors production scale, to confirm that the documented fallback behavior — velocity rules continuing independently while graph clustering recovers — actually holds up under realistic conditions rather than only existing as an assumption in an architecture document that has never been tested against a genuine partial failure.
8.5 Recovery objectives specific to detection freshness
Rather than a single generic recovery time objective, the team defines separate objectives for different failure categories: a brief clustering worker outage might carry a recovery time objective of a few minutes with minimal detection impact, given the velocity rules safety net, while a broader graph engine outage affecting the underlying entity graph itself carries a more urgent recovery objective, since an extended gap in graph freshness represents a genuine, growing blind spot that a sophisticated attacker could exploit if the outage were prolonged and, worse, somehow detectable from outside the system.
Security
The detection system is itself an attractive target for a sophisticated adversary, and it correlates sensitive data across merchant boundaries — so its security posture has to be considered on two fronts: hardening the system against attacker probing and enforcing strict guardrails on the cross-merchant data it necessarily aggregates.
9.1 Protecting the detection system itself as an attack target
A sufficiently sophisticated fraud ring may attempt to probe or reverse-engineer the detection system’s own thresholds, deliberately staying just below known velocity limits or artificially diversifying devices and IP addresses to avoid forming a detectable dense cluster. The system’s defenses account for this adversarial dynamic by keeping exact thresholds and model internals confidential, rotating and periodically retuning detection parameters, and incorporating less easily gamed signals — such as subtle timing regularities in automated tooling that are much harder for an attacker to vary convincingly than a device fingerprint or IP address.
9.2 Data access controls across merchant boundaries
Because this system necessarily correlates data across many independent merchant accounts, strict access controls ensure that no individual merchant, or any employee without a specific, audited need, can view another merchant’s raw transaction data through this system, even though the aggregated, anonymized graph structure itself is used platform-wide for detection purposes.
9.3 Encryption and tokenization
Card numbers are never stored or processed in raw form within this system; only tokenized references are used throughout the pipeline, with the mapping between tokens and real card numbers held exclusively within a separate, tightly scoped tokenization service that this detection system never directly accesses.
9.4 Secure handling of enrichment data
Device fingerprints, IP geolocation data, and network reputation scores are themselves sensitive signals that could be misused if exposed, and are protected with the same rigor as core transaction data, since an attacker with visibility into exactly which signals the system tracks would gain a significant advantage in evading detection.
“How do you defend against an adversary who has figured out your detection thresholds?” Defense in depth rather than reliance on any single threshold: combine multiple independent signal types so an attacker evading one signal likely trips another, periodically and unpredictably adjust specific threshold values, and prioritize behavioral and structural signals that are inherently harder for automated fraud tooling to convincingly randomize than simple, easily varied attributes like IP address alone.
9.5 Insider risk and threshold confidentiality
Because knowledge of exact detection thresholds and model feature importance would be extremely valuable to an attacker, access to this configuration is restricted to a small, audited group of engineers and fraud strategists, with any change to detection logic requiring review and approval from more than one person — treating this configuration with a level of confidentiality and change control comparable to the credentials protecting the payment infrastructure itself.
9.6 Secure handling of cross-merchant correlations
Because the system’s core function depends on correlating signals across independent merchant accounts, its data handling practices are designed from the outset to satisfy both regulatory expectations and merchant contractual commitments around data usage, ensuring that cross-merchant correlation is used strictly for shared fraud defense purposes and never exposed in a way that would let one merchant infer competitively sensitive information about another merchant’s business through this shared infrastructure.
Monitoring, Logging & Metrics
Beyond standard infrastructure health metrics, the system tracks detection-specific outcomes and graph-level signals that surface silent degradations well before they turn into user-visible outages or missed detections.
10.1 Detection effectiveness metrics
The system tracks confirmed true positive rate from analyst review, false positive rate and its downstream cost in legitimate transaction friction, average time from first suspicious transaction to alert generation, and the total value of fraudulent transactions estimated to have been prevented by early blocking — which is the metric that ultimately justifies the system’s cost to business stakeholders.
 You may likeDesigning a Real-Time US Sales Tax Calculation System at One Million Requests per Minute
10.2 Graph health metrics
Operational dashboards track graph size, edge creation rate, average node degree, and clustering computation latency, since a gradual, unnoticed degradation in graph freshness or clustering throughput would silently erode detection effectiveness well before it caused an obvious outage-style alert.
10.3 Analyst workflow metrics
Case management metrics track analyst review throughput, average time to resolution per case, and the ratio of automated-response cases to human-reviewed cases, helping the team continuously tune confidence thresholds to keep analyst workload sustainable without either overwhelming the team or under-utilizing the automated response capability the system provides.
10.4 Model drift monitoring
Because fraud rings actively adapt their tactics over time specifically to evade detection, the ML Ring-Scoring Model’s performance is monitored continuously for drift — a gradual decline in detection accuracy on recent data compared to historical performance — which triggers a retraining and threshold review cycle rather than allowing a slowly degrading model to silently underperform for months before anyone notices.
Large card networks and processors that publish periodic fraud trend reports often highlight how quickly fraud tactics evolve in response to detection improvements, underscoring why continuous model monitoring and retraining — not a one-time model deployment — is treated as a core, ongoing operational responsibility for any team running a system like this.
10.5 Executive and board-level reporting
Beyond operational dashboards used by the engineering and fraud analyst teams, summarized detection effectiveness metrics — estimated fraud losses prevented, false positive impact on legitimate transaction volume, and comparison against industry benchmark trends — are regularly reported to executive stakeholders and, for regulated financial institutions, often to board-level risk committees, since this system’s performance directly affects both the institution’s bottom line and its regulatory standing with respect to fraud prevention obligations.
Deployment & Cloud
The pipeline’s deployment topology deliberately separates the stateless, transaction-volume-driven components from the stateful, graph-size-driven ones, since they have very different scaling and change-management profiles.
11.1 Deployment topology
The streaming ingestion and enrichment services are deployed as horizontally scalable, stateless container fleets, while the entity graph engine and clustering workers are deployed as a carefully sized, partitioned stateful cluster — with independent scaling policies reflecting their very different resource profiles. The former scales primarily with transaction volume, the latter with graph size and connectivity density.
11.2 Canary deployments for model and threshold changes
Changes to detection thresholds or a newly retrained ML model are rolled out through a careful canary process, applying the new configuration to a small percentage of traffic or a specific merchant segment first, comparing detection and false-positive rates against the existing configuration before a full rollout — since a poorly tuned threshold change deployed globally without validation could either flood analysts with false positives or silently blind the system to an active attack.
11.3 Infrastructure as code and environment parity
The entire pipeline topology, including graph partitioning configuration and streaming cluster sizing, is defined declaratively and version controlled, and pre-production environments are kept representative of production scale specifically for graph and clustering components — since clustering behavior and performance characteristics at small scale often differ meaningfully from behavior at full production graph size.
“How would you safely roll out a retrained detection model without risking a spike in false positives across your entire merchant base?” A shadow deployment: run the new model alongside the existing one on live traffic without it actually driving any blocking decisions, comparing its outputs against the current model and against eventual analyst-confirmed outcomes, and only promoting it to an active canary rollout once its shadow-mode performance meets a clearly defined bar.
11.4 Environment parity for graph workloads
Because clustering algorithm performance and false-positive behavior can differ meaningfully between a small test graph and a full production-scale graph with its characteristic density and connectivity patterns, pre-production environments used for validating detection changes maintain a representative, anonymized snapshot of production-scale graph structure rather than a synthetic or drastically downsized substitute, since many of the subtler correctness and performance issues in graph clustering simply do not surface at small scale.
11.5 Multi-cloud and data residency considerations
Given that this system often processes transaction data spanning many countries and regulatory jurisdictions, deployment topology must account for data residency requirements that may mandate certain transaction data remain within specific geographic boundaries, which the team addresses through regional graph partitioning aligned with residency requirements combined with carefully scoped, metadata-only cross-region signals — sacrificing full global graph unification for regulatory compliance where legally required.
Databases, Caching & Load Balancing
No single store fits every workload here — the system pairs an in-memory feature store, a purpose-built graph store, and colder archival storage, each tuned for a specific access pattern.
12.1 Streaming feature store
Velocity counters and other frequently accessed derived features are maintained in a low-latency, in-memory feature store, sharded by entity identifier (card, device, or IP), so that both the rules engine and the ML scoring layer can retrieve up-to-the-second feature values without a costly round trip to colder, durable storage on the hot path.
12.2 Graph storage choices
The hot, actively queried portion of the entity graph lives in a specialized in-memory or hybrid memory-and-disk graph store optimized for high-throughput writes and fast neighborhood traversal, while older, decayed graph history is archived to cheaper, disk-based storage that supports the less latency-sensitive forensic and model-training use cases without competing for resources with the real-time detection path.
12.3 Caching enrichment lookups
Reference data used during enrichment — card bank identification number ranges, known IP reputation scores — is cached aggressively with periodic refresh, since this data changes far less frequently than transaction volume and repeated lookups against a slower, authoritative source would otherwise become an unnecessary bottleneck on the enrichment hot path.
12.4 Load balancing across graph partitions
Because graph partitions are not uniformly sized or uniformly active, load balancing across the graph engine’s processing nodes uses partition-aware routing rather than simple round-robin distribution, directing queries and updates to whichever node currently owns the relevant portion of the graph, with dynamic rebalancing when a partition grows disproportionately large or hot relative to its peers.

Systems that track IP and network reputation at scale commonly rely on continuously updated threat intelligence feeds from external providers, cached locally with a refresh cadence tuned to balance freshness against the cost and latency of constantly re-querying an external service on every single transaction.
12.5 Cold storage for forensic investigation
Decayed graph history and full transaction event archives are moved to lower-cost, higher-latency cold storage once they age past the active detection window, remaining fully queryable for forensic investigations, regulatory inquiries, and model training data preparation, but deliberately kept out of the hot, latency-sensitive real-time detection path so that the cost and performance profile of the active system is not burdened by data that no longer contributes to catching an actively unfolding attack.
12.6 Read and write patterns for the feature store
The real-time feature store is designed around a write-heavy, read-heavy workload in roughly equal measure, since every incoming transaction both updates relevant velocity counters and immediately reads current counter values to evaluate rules — which shapes the choice of underlying storage engine toward one optimized for balanced read and write throughput at low latency rather than a store tuned primarily for one access pattern at the expense of the other.
APIs & Microservices
The natural service boundaries mirror the distinct responsibilities and scaling profiles of the underlying components, and their APIs reflect the very different latency budgets each consumer is willing to accept.
Real-Time Signal API
Merchants and their own fraud systems, where they exist, can query a lightweight real-time signal API asking whether a specific card, device, or IP is currently associated with a flagged cluster — letting merchants incorporate cross-merchant fraud ring intelligence into their own point-of-sale or checkout decisioning without needing to build their own cross-merchant graph analysis.
Case Management API
A separate API supports the analyst-facing case management workflow, exposing graph visualization data, cluster evidence, and historical entity activity needed for investigation — deliberately kept distinct from the high-throughput real-time signal API since the two have very different latency and access-pattern requirements.
Issuer & Network Notification Interface
Confirmed fraud ring findings are communicated to affected card-issuing banks and, where appropriate, to the broader card network, through a structured notification interface that includes enough evidence — implicated card identifiers, confidence level, observed pattern summary — for the receiving institution to take informed action such as proactive card reissuance.
Microservice Ownership Boundaries
Ingestion and enrichment, the graph engine, the rules and ML scoring layer, and the case management system are each owned by focused teams with clear interface contracts between them, reflecting their genuinely different technical characteristics and scaling profiles, while still sharing a common entity and event schema so that signals flow cleanly across the pipeline without constant translation overhead.
“Should the real-time signal API used by merchants during checkout be synchronous, and what latency budget would you target?” It must be a fast synchronous call, since it sits on the merchant’s own checkout latency path, typically budgeted at a small number of milliseconds. That is why this API is deliberately served from the low-latency feature store and recent cluster flags rather than triggering any live graph traversal or clustering computation at query time.
13.1 Versioning and backward compatibility
Because many independent merchant integrations and internal consumers depend on the real-time signal API, changes are made additively wherever possible, introducing new optional response fields rather than altering existing ones, with any genuinely breaking change rolled out through a formally versioned endpoint and a generously long, actively communicated deprecation window — since forcing every merchant integration to update on a tight timeline is neither realistic nor fair given the wide range of technical sophistication across the merchant population this system serves.
13.2 Rate limiting and fair resource allocation
The real-time signal API and the case management API both enforce per-consumer rate limits and quota allocations, ensuring that one merchant’s unusually high query volume — whether from a legitimate high-traffic business or from a misbehaving integration — cannot degrade response latency for every other merchant relying on the same shared infrastructure, with quotas set collaboratively based on each consumer’s expected transaction volume and revisited as that volume changes over time.
Design Patterns & Anti-Patterns
The patterns below recur across production ring-detection platforms; the anti-patterns are the recognizable ways well-intentioned designs quietly fail against a determined adversary.
14.1 Useful patterns
Entity Graph with Decaying Edges
Naturally ages out stale relationships without requiring explicit cleanup logic, keeping the active graph focused on currently relevant structure.
Layered Detection, Cheap Signals First
Fast velocity rules provide a baseline safety net while more expensive graph and ML analysis run in parallel, ensuring no single layer’s slowdown blinds the whole system.
Shadow Deployment for Model Changes
Validates new detection logic against live traffic without it driving real decisions, before promoting it to production.
Confidence-Tiered Response
Automated action only for the highest-confidence findings, human review for the moderate-confidence middle ground — avoiding a single brittle global threshold.
Feedback Loop to Retraining
Analyst decisions flow back into the training data used to periodically retrain the ML model, continuously improving detection accuracy based on real, confirmed outcomes.
14.2 Anti-patterns to avoid
- Evaluate transactions purely in isolation. Missing the entire point of this system’s value, which lies specifically in cross-transaction, cross-merchant relationships rather than any single transaction’s own attributes.
- Rely on batch-only detection with long latency. Allowing a fraud ring’s entire reconnaissance phase, and often its subsequent damaging transactions, to complete well before detection ever runs.
- Use a single global confidence threshold. Forcing one number to simultaneously serve automated blocking, analyst triage, and merchant-facing signaling, when each of these use cases genuinely needs a different sensitivity level.
- Store raw card numbers anywhere in the detection pipeline. Unnecessarily expanding the system’s security exposure and regulatory compliance scope when tokenized references serve the detection use case just as effectively.
- Keep static, never-retrained detection thresholds. Allowing sophisticated fraud rings to eventually learn and adapt around thresholds that were never revisited after initial deployment.
“What’s the real-world consequence of the single global threshold anti-pattern?” A threshold tuned conservatively enough to avoid overwhelming human analysts with false positives will systematically miss the subtler fraud rings that a more aggressive automated-blocking threshold would have caught, while a threshold aggressive enough for reliable automated blocking would generate far too many false positives to route through human review. Production systems separate these concerns into distinct, independently tuned confidence tiers rather than trying to serve every downstream consumer from one shared number.
14.3 The purpose-built entity graph pattern
A recurring theme across production fraud detection systems is the deliberate choice to build a purpose-specific entity graph rather than repurposing a general-purpose graph database designed for broader analytical workloads. This pattern trades some flexibility — a general-purpose graph database often supports richer ad-hoc query capabilities — for the specific combination of extremely high write throughput and low-latency neighborhood queries that this detection use case demands, a trade worth making precisely because the system’s core value depends on speed, not on supporting arbitrary exploratory graph queries.
14.4 The progressive trust pattern
Rather than treating every newly observed entity — a brand-new device fingerprint or a first-seen IP address — with the same baseline suspicion as a long-established one, mature detection systems apply a progressive trust model, where entities accumulate a gradually increasing trust signal based on a sustained history of legitimate activity, and conversely lose trust quickly upon any confirmed association with fraudulent activity. This pattern helps the system avoid over-penalizing the enormous volume of entirely legitimate new customers, devices, and networks that naturally appear every day, while still remaining highly sensitive to genuinely suspicious new activity that lacks any redeeming trust history.
Best Practices & Common Mistakes
The gap between a demo-quality detection prototype and a production one lives in the practices below — and in the mistakes on the other side of the ledger.
15.1 Best practices
- Treat detection latency as a first-class design constraint from the beginning, not an afterthought optimized only after a slow batch system already exists in production.
- Build the analyst case management experience with the same care as the automated detection pipeline, since human review remains essential for the moderate-confidence cases that make up a meaningful share of total alert volume.
- Instrument the system to measure false-positive cost in concrete business terms — blocked legitimate transactions, unnecessary step-up friction — not only in abstract accuracy percentages.
- Design the entity graph schema to be extensible, since new signal types (a new device telemetry field, a new network reputation source) will inevitably need to be incorporated over time as detection needs evolve.
- Maintain close, structured feedback channels with card-issuing banks and card networks, since their own fraud signals and eventual chargeback data provide invaluable ground truth for validating and improving the system’s own detection accuracy.
15.2 Common mistakes
- Underestimating how quickly sophisticated fraud rings adapt their tactics in direct response to a platform’s known detection patterns, leading to a detection system that performs well at launch but decays in effectiveness without continuous retuning.
- Allowing graph size to grow unbounded without a decay and pruning strategy, eventually degrading query latency across the entire system as the graph accumulates years of largely irrelevant historical structure.
- Treating a confirmed false positive as simply an error to suppress, rather than a valuable data point that should actively inform threshold and model refinement.
- Insufficient investment in the enrichment layer’s accuracy, since a detection system built on a graph of unreliable or poorly resolved entity relationships cannot meaningfully outperform its weakest data input.
- Neglecting to build a clear, fast escalation path to card-issuing banks, meaning even a correctly detected fraud ring’s compromised cards remain usable elsewhere for longer than necessary after detection.
“How would you use a false positive to actually improve the system, rather than just apologizing for it?” Treat every analyst-confirmed false positive as a labeled training example fed directly back into the ML model’s training set, and additionally review whether the specific graph or velocity feature that triggered the false alert needs refinement — for example distinguishing a legitimate shared corporate network from a suspicious shared IP more precisely — turning each individual mistake into a concrete, traceable improvement to the detection system’s future accuracy.
15.3 Building trust with merchants through transparency
Merchants who experience a false positive — a legitimate customer blocked or challenged because they happened to share a device or network with an entity later confirmed unrelated to any real fraud — are far more forgiving of the occasional mistake when the platform provides clear, specific reasoning and a fast path to resolution, rather than an opaque, unexplained block. Teams that invest in clear merchant-facing communication about why a specific transaction was flagged, without revealing enough operational detail to help an attacker reverse-engineer the system, build considerably more trust and cooperation from their merchant base over time than teams that treat every flagged transaction as a black-box decision.
15.4 Balancing automation with human judgment
It is tempting, especially as detection accuracy improves over time, to push more and more decisions toward full automation to reduce operational cost. Mature teams resist fully automating the moderate-confidence middle tier of alerts even when the cost savings would be attractive, because human fraud analysts consistently catch genuinely novel attack patterns that do not yet match any existing model feature or historical fraud ring signature — providing an essential adaptive capability that a purely automated system, trained only on past patterns, cannot fully replicate on its own.
Real-World Industry Examples
The design decisions above are not academic. Nearly every major card network, processor, wallet, and donation platform runs some version of this system, adapted to its own baseline transaction distribution and its own regulatory footprint.
Large Card Networks
Card networks that sit above every issuing bank and acquiring processor on their rails have historically been uniquely positioned to observe cross-merchant, cross-issuer patterns, and have invested heavily in network-wide fraud scoring services that individual banks and merchants can subscribe to — incorporating exactly this kind of cross-entity graph signal into decisions made far downstream at the point of a much larger, more damaging transaction.
Multi-Tenant Payment Processors
Large payment processors serving a broad base of online merchants — particularly small and medium businesses that individually lack sophisticated in-house fraud teams — have built dedicated fraud intelligence products specifically because their unique cross-merchant visibility lets them catch exactly the kind of distributed card-testing pattern described in this tutorial, offering this detection capability back to their merchants as a value-added service.
Digital Wallets & P2P Payments
Platforms enabling instant transfers and a very large number of small, everyday transactions are attractive card-testing targets precisely because small transactions are common and unremarkable in their normal usage pattern — which has pushed these platforms toward sophisticated graph-based and device-fingerprinting fraud detection specifically tuned to distinguish coordinated testing activity from the platform’s own extremely high volume of legitimate small transactions.
Donation & Nonprofit Platforms
Platforms processing charitable donations are a historically favored target for card testing specifically because small, one-time donations are an extremely natural, unremarkable transaction pattern that blends in easily — which has led donation-processing platforms to develop fraud detection tuned specifically to their own unusual baseline transaction distribution rather than simply reusing generic e-commerce fraud models built around very different typical transaction patterns.
Subscription & App Store Platforms
Platforms offering very low-cost trial subscriptions or small in-app purchases face a similar dynamic, and have developed detection tuned to their own specific baseline — distinguishing a burst of legitimate new customer sign-ups (for example following a marketing campaign or a viral moment) from a coordinated card-testing campaign using their low price point as convenient cover.
Cross-Industry Sharing
Beyond what any single processor or network can see on its own, some segments of the payment industry have formed shared threat intelligence consortiums where participating institutions contribute anonymized fraud pattern signals (such as confirmed compromised device fingerprints or IP ranges) to a shared pool that benefits every participant.
Nonprofit and donation platforms often see their own detection systems trained on a baseline where small, first-time, single transactions from new, unrecognized cards are actually the overwhelming majority of entirely legitimate traffic — which makes naive velocity-only detection tuned for typical e-commerce patterns particularly poorly suited to this domain without careful, platform-specific baseline calibration.
16.1 What these examples have in common
Across every one of these contexts, the pattern that makes cross-merchant graph-based detection effective is the same: a platform or consortium with sufficiently broad visibility across many otherwise-independent transaction streams can observe a structural signature that is fundamentally invisible from any single participant’s narrower vantage point. The specific technology choices vary considerably — some rely more heavily on machine learning, others lean more on curated heuristic rules and shared threat intelligence feeds — but the underlying insight, that coordinated fraud reveals itself only in the relationships between transactions rather than in any single transaction’s own attributes, remains constant across the industry.
Frequently Asked Questions
Questions that recur in interviews, design reviews, and merchant conversations about this system.
Traditional per-transaction scoring evaluates each transaction largely on its own attributes and, at best, against the specific customer’s or merchant’s own history. This system instead specifically looks for structural patterns across many transactions and many merchants simultaneously — patterns that are, by design, invisible when any single transaction is evaluated in isolation — making the two approaches complementary rather than substitutes for one another.
The merchant-facing real-time signal API is designed to support step-up authentication as a first response rather than an outright hard block wherever the confidence level allows, giving a legitimate customer the opportunity to verify their identity through an additional factor rather than being silently and permanently denied, with case management analysts able to quickly clear a confirmed false positive and remove the flag from the affected entities.
Yes, because the detection signal comes from the shared devices, IP addresses, and timing patterns connecting many distinct single-use cards, not from any individual card’s own repeated usage — which is exactly the structural insight that makes this approach effective even against rings that never reuse a single compromised card more than once.
Detection decisions weigh multiple corroborating signals rather than any single merchant-level attribute, and the system is specifically designed to evaluate patterns across the shared entities (cards, devices, IPs) rather than penalizing a merchant simply for being small, new, or having an unusual transaction profile, since legitimate diversity in the merchant population is expected and must not itself be treated as suspicious.
Issuing banks receive structured notification of confirmed fraud ring findings affecting their cards, enabling them to proactively reissue compromised cards, notify affected cardholders, and incorporate the confirmed pattern into their own internal fraud models — closing the loop across the broader payment ecosystem rather than the detection remaining isolated to a single processor’s own defenses.
No, the core cross-merchant detection runs centrally against transaction data the platform already processes as part of normal payment handling, so every merchant benefits automatically from the shared graph and detection pipeline. The optional real-time signal API exists for merchants who want to incorporate the signal into their own additional, merchant-specific decisioning logic, but it is not required for baseline protection.
The distinguishing factor is structural density and shared entities: ordinary, unrelated fraud attempts typically do not share devices, IP addresses, or tight timing correlations with each other, whereas a coordinated ring’s activity, by the very nature of using shared tooling and infrastructure to run its campaign efficiently, leaves exactly this kind of dense, interconnected footprint in the entity graph that unrelated, independent fraud attempts do not produce.
These cards are flagged for step-up authentication or blocking on any subsequent attempt and are included in the notification sent to the issuing bank, allowing the bank to proactively reissue the card before any actual fraudulent charge succeeds — which is precisely the early-interruption value this system is designed to deliver during the reconnaissance phase rather than only after real financial damage has already occurred.

Summary & Key Takeaways
Every design decision in this tutorial follows from one central observation: coordinated fraud rings deliberately exploit the boundaries of individual visibility, structuring their attacks specifically to stay small and unremarkable from any one merchant’s vantage point.
Coordinated card-testing fraud rings exploit a structural blind spot: they deliberately spread thin, forgettable transactions across many merchants specifically so that no single merchant’s own fraud system ever sees enough volume to raise an alarm. The system described in this tutorial closes that blind spot by looking at the problem from a fundamentally different vantage point — not per-transaction, not even per-merchant, but across the entire shared entity graph connecting cards, devices, IP addresses, and merchants over time.
The architecture centers on a continuously updated, high-throughput streaming entity graph, complemented by fast, cheap velocity rules that catch the most obvious patterns immediately, and a more sophisticated machine learning layer that scores subtler clusters based on structural similarity to confirmed historical fraud rings. Layering these detection mechanisms, rather than relying on any single one, ensures the system remains effective even when one layer experiences a slowdown or when a sophisticated attacker manages to evade one specific signal.
Correctly navigating the precision-recall trade-off is central to making this system genuinely useful rather than merely noisy: automated blocking reserved for the highest-confidence findings, human analyst review for the ambiguous middle ground, and continuous feedback from confirmed outcomes back into both the rules and the machine learning model — ensuring the system adapts as fraud tactics themselves inevitably evolve in response to detection improvements.
Finally, this system’s value depends heavily on its cross-merchant vantage point, which means its design must account not only for technical scalability and latency but also for the data governance and access-control responsibilities that come with correlating information across many independent merchant relationships, and for closing the loop with card-issuing banks and networks so that a detected ring’s compromised credentials are neutralized across the broader payment ecosystem, not just within the platform that happened to catch them first.
Key takeaways an interviewer wants to hear
- The signal lives in the relationships between transactions, not in any single transaction — per-transaction scoring alone can never see this pattern.
- A streaming entity graph with decaying edges is the natural data structure for this problem, purpose-built for high write throughput and low-latency neighborhood queries.
- Layer detection from cheapest to most sophisticated so no single component’s slowdown blinds the whole system.
- Separate confidence thresholds for automated action versus human review, rather than one global number forced to serve both.
- Treat the fraud tactics themselves as an actively adapting adversary, requiring continuous retraining and threshold review rather than a static, one-time-tuned system.
- Make a different CAP trade-off than a payment ledger. Availability and throughput over strict consistency is intentional here, because a probabilistic detection signal tolerates brief propagation delay in a way a payment authorization cannot.
- Close the loop with issuing banks. Detection is only half the value — the other half is neutralizing the compromised credentials across the broader ecosystem.
18.1 Closing thought
The single most important idea to carry away from this design is that fraud rings deliberately exploit the boundaries of individual visibility, structuring their attacks specifically to stay small and unremarkable from any one merchant’s vantage point. Defeating that strategy does not require a fundamentally more sophisticated fraud model at the individual transaction level; it requires a fundamentally wider vantage point, one that can see the relationships connecting many small, individually forgettable transactions into the coordinated pattern they actually represent. Every architectural choice in this system — the streaming entity graph, the layered detection tiers, the deliberate CAP trade-off favoring availability over strict consistency in the graph — ultimately serves that one wider vantage point, and it is worth returning to that core idea whenever a specific design decision feels ambiguous or a new edge case needs to be reasoned through from first principles.

