Designing a Real-Time Like & Share Counter for Millions of Concurrent Viewers
How do apps like Instagram, YouTube, and X show a “like” count that updates in front of millions of eyeballs at once, without melting a database or lying to anyone about the real number? This tutorial builds that system from a blank whiteboard to a production-grade architecture, one decision at a time.
Introduction & History
A tiny number under a photo hides one of the more interesting engineering problems in large-scale software.
Picture a number sitting quietly under a photo: 42,318 likes. It looks like the simplest thing on the entire screen — smaller than the photo, smaller than the caption, smaller than the comment box. And yet, behind that one small number sits one of the more interesting engineering problems in large-scale software: how do you count something that millions of people are changing at the exact same instant, and show a number that still feels accurate, still feels instant, and never brings the rest of the app to a crawl?
To understand why this became a genuine engineering discipline of its own, it helps to look back at how “like” counts evolved. In the early web, a “count” usually meant a simple number stored in one row of one table — a hit counter on a personal homepage, a view count on a forum post. If ten people visited a page in a minute, the database happily ran ten small updates and nobody noticed the cost. That model worked because traffic was small and slow, and because nobody was watching the number update live in front of them, second by second, waiting for it to move.
Then came social platforms at global scale. Facebook introduced the “Like” button in 2009, and almost overnight, a feature that seemed cosmetic became one of the highest-traffic write paths in the company’s entire infrastructure. Twitter’s retweet and favorite counts, YouTube’s view counter, Instagram’s like counter, TikTok’s counts for likes, shares, and comments — all of them turned a “small number on the screen” into a distributed systems problem touching caching, databases, message queues, and real-time delivery pipelines, all operating at a scale most engineers never encounter anywhere else in their careers.
What makes this problem genuinely interesting — and a favorite in system design interviews — is that it sits exactly at the crossroads of several classic distributed systems tensions: extremely high write volume against a single logical value, the trade-off between exact correctness and speed, and the challenge of pushing updates to millions of open connections in real time rather than making every client repeatedly ask “has it changed yet?” Solving it well requires touching almost every layer of a modern backend stack, which is exactly why this tutorial walks through it layer by layer, the same way you’d walk through it on a whiteboard in an actual interview or an actual design review. By the end, the goal is not just to remember one specific architecture, but to internalize the reasoning that produces it, so a genuinely new, unfamiliar system design question still feels approachable using the same underlying habits of thought.
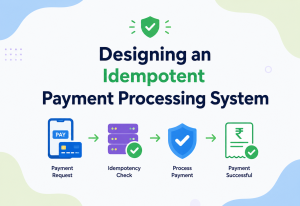
1.1 A Short History of Like & Share Counters
Simple counters stored directly in a relational database row, updated with a basic UPDATE ... SET count = count + 1 statement. Fine for low traffic, catastrophic at scale because every write locks the same row.
Social platforms explode in popularity. Facebook’s Like button and Twitter’s Retweet button turn counters into some of the hottest write paths in the entire system. Engineers start moving counters out of the primary database into in-memory stores.
Rise of distributed caching (Memcached, Redis) and asynchronous processing with message queues. Counting shifts from “synchronous write to database” to “asynchronous event, aggregated later.” Sharded counters and write-behind caching become standard patterns.
Real-time push technologies (WebSockets, Server-Sent Events), stream processing frameworks (Kafka Streams, Flink), and probabilistic data structures mature. Modern counter systems separate the “fast approximate number shown to users” from the “slow exact number used for billing, analytics, and audits.”
Think of a stadium scoreboard during a championship match. Fans in every seat — and millions more watching on television — want to see the score change the instant a goal is scored. A single scorekeeper writing on a chalkboard can’t possibly serve that audience. Instead, the scoreboard operator maintains a fast display, referees confirm the actual points into an official record separately, and cameras broadcast the display so viewers everywhere see it update at once. That’s the same shape of problem, at a smaller scale, that a like counter solves at planet scale.
“Why can’t we just run UPDATE posts SET like_count = like_count + 1 WHERE post_id = ? every time someone likes a post?” This is the opening question almost every interviewer asks, and your answer should immediately point to row-level lock contention — every like on the same post fights over the same database row, so on a viral post with thousands of likes per second, that single row becomes a bottleneck that serializes all writes and can bring update latency from milliseconds into seconds or worse.
Problem & Motivation
Before drawing a single box, sit with why this problem is actually hard — the difficulty appears only once you consider scale and traffic shape.
Before drawing a single box on a diagram, it’s worth sitting with why this problem is actually hard. On the surface it looks trivial — increment a number, show a number. The difficulty appears only once you consider the scale and the shape of the traffic.
2.1 The Hot-Key Problem
Imagine a global celebrity posts a photo. Within minutes, tens of thousands of people are tapping “like” on that exact same post, all targeting the exact same counter. In distributed systems terms, this single post_id becomes a hot key — one specific piece of data receiving a disproportionate share of all traffic. A normal system, sized for average load, can handle millions of different keys receiving modest traffic each. It struggles badly when one single key receives more traffic than an entire average day’s worth of other keys combined.
2.2 Read-Heavy AND Write-Heavy, At the Same Time
Most systems you design lean one way — read-heavy (a product catalog) or write-heavy (a logging pipeline). A like/share counter is unusual because it’s brutally heavy on both sides simultaneously. Every viewer of the post issues a read (show me the current count). Every tap of the like button issues a write. On a viral post, you might see hundreds of thousands of reads per second and tens of thousands of writes per second, on the very same piece of data, at the very same moment.
2.3 Exact Correctness vs. Real-Time Feel
Here’s the twist that makes this a genuinely interesting design problem rather than a plumbing exercise: users do not actually need the exact, perfectly accurate count at every millisecond. Nobody double-checks whether a post has 42,318 or 42,321 likes. What they do need is a number that feels alive — one that visibly climbs while they’re watching, and one that is eventually, provably correct for anything downstream that actually depends on the true value (billing for sponsored engagement, analytics dashboards, content ranking algorithms, abuse detection). This gap between “must feel instant and always-moving” and “must eventually be exactly correct” is the single most important design insight in this whole problem, and nearly every architectural decision that follows flows from it.
2.4 Fan-Out to Millions of Simultaneous Viewers
It’s not enough to update a number correctly on the backend. Millions of people might be looking at the very same post at the very same time — during a live stream, a breaking news event, or a viral moment. Every one of those viewers expects their screen to update without refreshing the page. Pushing a single incrementing number to millions of open client connections, without hammering your servers, is its own significant distributed systems challenge, closely related to the “fan-out” problem seen in chat systems and live sports score apps.
2.5 Back-of-Envelope Math
It’s worth walking through rough numbers out loud, because interviewers consistently reward candidates who can reason quantitatively rather than only qualitatively. Suppose a single viral post receives 50,000 likes in one minute at its absolute peak. That works out to roughly 833 writes per second sustained, with short bursts likely running several times higher during the first few seconds after a post is shared by a major account. If a hundred thousand people are simultaneously viewing that post’s live count, and the system pushed a raw update on every single increment, that’s 833 events per second multiplied by 100,000 viewers — over 83 million individual delivery operations per second, for one single post. That number alone explains why naive “broadcast every increment to every viewer” designs are unworkable, and why both batching on the write side and throttling on the delivery side aren’t optional extras — they’re the only reason this system can exist at all.
Scale that single-post scenario across an entire platform running many such moments concurrently — a major sporting event, an awards show, breaking news — and aggregate write volume across the whole platform can reasonably reach tens of millions of engagement events per second. No single database, however well-tuned, absorbs that volume through direct per-event writes; the entire architecture that follows in this tutorial exists specifically to make that number tractable.
The hardest part of this system isn’t counting. Computers are excellent at counting. The hardest part is counting correctly and cheaply when a hundred thousand people are trying to change the same number in the same second — and then telling a hundred million more people about it, instantly, without asking each one of them to keep asking “has it changed yet?”
“What happens if two users like the same post at the exact same nanosecond?” This tests whether you understand race conditions and atomic operations. The answer: as long as the increment operation itself is atomic (like Redis’s INCR, or a database-level atomic increment, or a CRDT-based counter), both increments are preserved correctly — the danger only appears when you do a non-atomic “read the value, add one, write it back” pattern, which can silently lose updates under concurrency.
Requirements: What We’re Actually Building
Pin down requirements out loud, before touching architecture — interviewers reward this deliberately.
Every good system design starts by pinning down requirements out loud, before touching architecture. Interviewers reward candidates who do this deliberately rather than jumping straight to boxes and arrows.
3.1 Functional Requirements
- Users can “like” or “unlike” a post, and “share” a post, from any client (web, mobile app, third-party embed).
- Every viewer of a post sees a like/share count, and that count updates live, without the user manually refreshing.
- The system supports posts ranging from near-zero engagement to hundreds of millions of likes over their lifetime.
- A user’s own like/unlike state is reflected correctly on their own client (their heart icon fills in, and stays filled in after a refresh).
- Historical, exact counts are available for analytics, billing, and audit purposes, even if the live-facing number is approximate at any given instant.
3.2 Non-Functional Requirements
Scale
Support tens of millions of likes per second in aggregate across the platform, with individual “hot” posts absorbing hundreds of thousands of writes per second.
Latency
A like action should be acknowledged to the acting user in under 100 ms; the visible count should update for other viewers within roughly 1–2 seconds.
Availability
The like/share feature should degrade gracefully rather than fail outright — showing a slightly stale count is acceptable; showing an error or crashing the feed is not.
Consistency
Eventual consistency is acceptable for the displayed count; strong consistency is required for the underlying source-of-truth ledger used in analytics and billing.
Durability
No like or share event should be silently and permanently lost, even during partial system failures.
Cost Efficiency
The design must avoid needless database writes per individual like — batching and aggregation are mandatory at this scale, not optional polish.
Many candidates immediately promise “strong consistency and real-time accuracy everywhere,” without noticing that this is exactly the requirement that makes the system unbuildable at scale. Calling out the eventual-consistency trade-off early, and explaining why it’s not just acceptable but actually the right choice for this specific use case, is one of the strongest signals you can give in an interview. It also demonstrates a broader maturity that separates senior engineers from junior ones: the willingness to negotiate requirements themselves, rather than treating every stated requirement as fixed and unquestionable before any design work begins.
Architecture & Components
Never let a single user action touch the primary database directly — the core idea threading through the whole design.
With requirements agreed, we can lay out the major building blocks. The core idea threading through the whole design: never let a single user action touch the primary database directly. Instead, every like or share becomes a lightweight event that flows through a fast in-memory layer, gets aggregated, and only occasionally, in batches, touches durable storage.
4.1 Component Breakdown
API Gateway
Entry point for all client requests. Handles authentication, TLS termination, rate limiting, and routes traffic to the correct backend service. Shields internal services from direct public exposure.
Like/Share Service
Stateless service that validates a like/share request, checks idempotency, and publishes a lightweight event. Never writes directly to the database on the hot path.
Idempotency Cache
Fast key-value store (Redis) tracking recent (user_id, post_id, action) combinations so duplicate taps, retries, or double-clicks don’t get double-counted.
Event Stream
Durable, ordered, high-throughput log (Kafka or Kinesis) that absorbs bursts of like/share events and decouples the fast write path from slower downstream processing.
Counter Aggregation Service
Stream-processing layer that consumes events in micro-batches, applies atomic increments to sharded in-memory counters, and periodically flushes aggregated deltas to durable storage.
Sharded Counter Cache
A Redis cluster holding the fast, near-real-time counter value, split across multiple shards per hot post to avoid any single node becoming a bottleneck.
Durable Store
A wide-column or document database (Cassandra, DynamoDB) holding the authoritative, exact count and full event history for analytics, billing, and recovery.
Pub/Sub Fan-out + WebSocket Gateway
Distributes count-delta events to every connection currently subscribed to a given post, so viewers see the number climb without polling.
CDN / Edge Cache
Serves the initial count on page load from a globally distributed edge location, cut down on origin load and reduce latency for first paint.
“Why introduce a message queue at all — why not have the Like Service update the cache directly?” A strong answer: the queue provides a durability and buffering boundary. If the aggregation service or cache cluster is temporarily overwhelmed or down, events sit safely in the queue instead of being dropped or causing the Like Service itself to back up and start rejecting user requests. It also lets you decouple the write throughput of the public-facing API from the processing throughput of the aggregation layer, and easily add more consumers if aggregation becomes the bottleneck.
Internal Working
Zoom into how each piece actually behaves internally — the interesting engineering lives in these details.
Let’s zoom into how each piece actually behaves internally, because the interesting engineering lives in these details, not just in the boxes-and-arrows diagram.
5.1 Step 1: Client Sends the Like Action
When a user taps the heart icon, the client optimistically updates its own UI immediately — the heart fills in, the number increments locally by one — before waiting for any server confirmation. This is called optimistic UI update, and it’s why liking a post feels instantaneous even on a slow network. The actual network request happens in the background, and if it ultimately fails, the client quietly rolls the UI back and can show a subtle retry or error state.
5.2 Step 2: API Gateway Validates and Routes
The request carries an auth token (validated against a session or JWT service) and hits a rate limiter tuned per-user, to block abusive scripts that might try to like the same post thousands of times per second. Assuming it passes, it’s routed to an available instance of the Like/Share Service.
5.3 Step 3: Idempotency Check
Networks are unreliable — a client might retry a request that actually succeeded the first time, or a double-tap might slip through. The service checks a fast idempotency cache keyed by something like user_id + post_id + action_type. If that exact action was already recorded in the last few seconds, the request is safely deduplicated and simply returns success without re-processing.
5.4 Step 4: Event Published to the Stream
Instead of writing to a database, the service publishes a tiny event — essentially {post_id, user_id, action: "like", timestamp} — onto a partitioned event stream. Events for the same post_id are routed to the same partition, which preserves ordering for that post and lets a single consumer instance own the aggregation for it.
5.5 Step 5: Aggregation Service Consumes in Micro-Batches
Rather than processing one event at a time (which would recreate the exact hot-row problem we’re trying to avoid), the aggregation service reads small batches of events — say, every 50–200 milliseconds, or every N events, whichever comes first — and applies a single atomic increment-by-N operation to the counter cache. This turns potentially tens of thousands of individual increments per second into a much smaller number of batched operations.
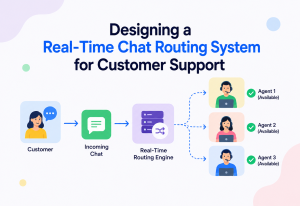
5.6 Step 6: Sharded Cache Update
For an average post, one Redis key holding the count is plenty. For a viral post receiving extreme write volume, the counter itself is split into multiple shards (for example, post:123:shard:0 through post:123:shard:15), and the true count is the sum across shards. Writes are spread evenly across shards (often by hashing the user_id), and reads sum them together, dramatically reducing contention on any single key.
5.7 Step 7: Periodic Durable Flush
On a fixed interval (for example every 5–10 seconds) or after a threshold number of increments, the aggregation service writes the accumulated delta to the durable database, alongside a checkpoint marking which stream offset has been safely persisted. This keeps the database write rate low and predictable, regardless of how bursty the live traffic is.
5.8 Step 8: Fan-Out to Live Viewers
Whenever the aggregation service updates a counter meaningfully (not necessarily on every single micro-batch, often throttled to something like once per second per post), it emits a small delta event to a pub/sub channel scoped to that post. Any WebSocket gateway instance with clients subscribed to that post_id receives the delta and pushes it down to those open connections.
YouTube famously does not increment its public view counter for every single video play in real time. Instead, view events are logged and processed asynchronously through a pipeline that applies fraud and spam filtering before the count is updated — which is exactly why a view count sometimes visibly “freezes” for a period on fast-growing videos: the system is deliberately trading a small amount of real-time accuracy for correctness and abuse resistance, the same core trade-off this tutorial builds toward for likes and shares.
Data Flow & Lifecycle
The full lifecycle of a single like, end to end — one of the most common things an interviewer will ask you to draw.
It helps to see the full lifecycle of a single like, end to end, as a sequence — this is also one of the most common things an interviewer will ask you to draw on a whiteboard.
6.1 Read Path Lifecycle
The read path is deliberately simpler and shorter, because reads vastly outnumber writes and every extra hop adds latency multiplied by an enormous number of requests.
- Client requests a post’s initial data (including its like/share count) — usually served from a CDN or edge cache for the first paint.
- Client opens a persistent connection (WebSocket or SSE) and subscribes to live updates for the posts currently visible on screen.
- As count-delta events arrive, the client updates the displayed number directly, without any further network request per update.
- If the persistent connection drops, the client falls back to periodic polling with exponential backoff, or reconnects and re-syncs the latest count from the read API.
“What happens if the WebSocket connection drops for a user in the middle of a viral moment?” A good answer describes a reconnection strategy: the client detects the drop, attempts reconnection with jittered exponential backoff to avoid a reconnection stampede, and on reconnect, immediately fetches a fresh snapshot of the count from the read API before resuming live delta updates — this way the user never sees a permanently stale number, even after a network blip.
Checkpoint: What’s Been Established
The write path is deliberately asynchronous end to end (tap → event → batched INCR → batched flush), and the read path leans on cache and CDN at every hop. Everything that follows — algorithms, concurrency control, CAP, caching depth, database schema, delivery mechanics, scaling, HA, security, monitoring, deployment, and testing — is about making each of those hops behave correctly at real scale.
Algorithms & Data Structures
Several classic and modern data structures make this system possible at scale — and knowing when each is the right tool.
Several classic and modern data structures make this system possible at scale. Understanding them — and, crucially, when each one is the right tool — is often the difference between a good and a great interview performance.
7.1 Sharded Counters
The single most important pattern in this whole system. Instead of one counter per post, maintain N counters per post (say, 16 or 32), and route each increment to one shard using a hash of the acting user’s ID (or a random shard, or round-robin). The true count is the sum of all shards. This spreads write contention across N independent pieces of memory instead of one, turning a single hot key into N warm keys.
public class ShardedLikeCounter {

    private static final int SHARD_COUNT = 16;
    private final RedisClient redisClient;

    public void incrementLike(String postId, String userId) {
        int shard = Math.floorMod(userId.hashCode(), SHARD_COUNT);
        String key = "post:" + postId + ":likes:shard:" + shard;
        // Atomic operation - no read-modify-write race condition
        redisClient.incrBy(key, 1);
    }

    public long getTotalLikes(String postId) {
        long total = 0;
        for (int shard = 0; shard < SHARD_COUNT; shard++) {
            String key = "post:" + postId + ":likes:shard:" + shard;
            String value = redisClient.get(key);
            total += (value != null) ? Long.parseLong(value) : 0L;
        }
        return total;
    }
}Summing across shards on every read is more expensive than reading a single key. In practice, production systems cache the summed total for a short TTL (say, 1–2 seconds) so reads don’t recompute the sum on every single request — a small, deliberate staleness window in exchange for much cheaper reads.
7.2 CRDTs — Conflict-free Replicated Data Types
In a multi-region deployment, you may have counter replicas in the US, Europe, and Asia, each accepting local writes for lower latency, and periodically syncing with each other. A plain integer counter doesn’t merge safely across regions — if both regions think the count is 100 and each adds 5 independently, naively merging by picking one region’s value loses the other’s updates. A G-Counter (grow-only counter), a well-known CRDT, solves this elegantly: each region maintains its own independent counter, and the true global value is always the sum of all regions’ counters. Merging two replicas is as simple as taking the element-wise maximum of shared state, or in this simplified case, summing per-region values — the structure guarantees replicas converge to the same correct total regardless of the order updates arrive in.
7.3 HyperLogLog — For Unique Counts, Not Raw Counts
Worth mentioning as a related, frequently confused concept: if the requirement were “count of unique users who liked this post” rather than a running total, and you needed to do it with minimal memory across billions of entries, HyperLogLog is the classic probabilistic data structure — it estimates cardinality (distinct count) using a small, fixed amount of memory, with a small, well-understood error margin (typically under 2%). It’s not the right tool for a simple additive like-counter, but interviewers sometimes probe whether you can distinguish “counting total events” from “counting unique participants,” and HyperLogLog is the right answer for the latter.
7.4 Sliding Window Counters
Useful for a secondary but related requirement: showing “trending” or “likes in the last hour” rather than lifetime totals. A sliding window counter (or its simpler cousin, fixed time-bucketed counters, e.g., one counter per minute, summed over the last 60 buckets) lets you answer “how much activity recently” without storing and scanning every individual event.
7.5 Data Structure Summary
| Structure | Used For | Why |
|---|---|---|
| Sharded atomic counter | Total like/share count | Removes single hot-key contention; simple, exact once summed |
| G-Counter (CRDT) | Multi-region counter replication | Merges safely without coordination or lost updates |
| HyperLogLog | Unique viewer/liker estimates | Tiny memory footprint for huge cardinality estimates |
| Sliding window / time buckets | Trending / recent activity | Efficient recency-weighted aggregation |
| Bloom filter | “Has this user already liked?” fast check | Very fast, memory-efficient existence check before a full lookup |
“How would you count unique users who liked a post without storing every single user ID?” This is a direct invitation to bring up HyperLogLog. Explain the trade-off clearly: you gain massive memory savings (a HyperLogLog structure can estimate cardinality up to billions using only a few kilobytes) at the cost of a small, tunable approximation error — a perfect fit when the exact number matters less than the ability to compute it cheaply at scale.
Concurrency & Atomicity
At the heart of every counter bug lies a concurrency mistake — getting this right is non-negotiable at scale.
8.1 The Read-Modify-Write Trap
The classic bug: reading a value, adding one in application code, then writing it back. Under concurrency, two threads (or two servers) can both read the same starting value, both add one, and both write back the same result — silently losing one increment. This is a textbook race condition, and it’s exactly why every operation described earlier uses atomic primitives instead.
// WRONG - race condition under concurrency
public void unsafeIncrement(String key) {
    long current = redisClient.get(key);   // read
    long updated = current + 1;             // modify
    redisClient.set(key, updated);          // write - can overwrite a concurrent update
}

// RIGHT - atomic operation, safe under any concurrency level
public void safeIncrement(String key) {
    redisClient.incrBy(key, 1);  // single atomic instruction at the Redis engine level
}
8.2 In-Process Concurrency: LongAdder Over AtomicLong
Within a single JVM instance of the aggregation service, when many threads are incrementing an in-memory counter before a batch flush, Java’s AtomicLong works correctly but can become a contention point under very high thread counts, because every thread competes for the same memory location via compare-and-swap. LongAdder (from java.util.concurrent.atomic) solves this by internally striping the counter across multiple cells, letting different threads update different cells and only summing them when the total is actually needed — trading a little memory and summation cost for dramatically better write throughput under contention.
import java.util.concurrent.atomic.LongAdder;
import java.util.concurrent.ConcurrentHashMap;

public class InMemoryBatcher {

    private final ConcurrentHashMap<String, LongAdder> pendingDeltas = new ConcurrentHashMap<>();

    public void recordLike(String postId) {
        pendingDeltas
            .computeIfAbsent(postId, id -> new LongAdder())
            .increment();
    }

    // Called on a fixed schedule, e.g. every 200ms
    public void flushToCache(RedisClient redis) {
        pendingDeltas.forEach((postId, adder) -> {
            long delta = adder.sumThenReset();
            if (delta != 0) {
                redis.incrBy("post:" + postId + ":likes", delta);
            }
        });
    }
}
8.3 Optimistic vs. Pessimistic Locking
Pessimistic locking (acquiring a lock before every write) guarantees correctness but throttles throughput to whatever a single lock can sustain — exactly wrong for this workload. Optimistic approaches (atomic compare-and-swap, or simply relying on the atomicity guarantees of operations like Redis’s INCR) avoid ever blocking a writer, which is why virtually every high-throughput counter system in production leans optimistic and atomic rather than lock-based.
“Why is Redis’s INCR command safe under concurrency without explicit application-level locking?” Because Redis is fundamentally single-threaded for command execution — every command runs to completion before the next one starts, which makes operations like INCR atomic by construction, with no possibility of two increments interleaving. This is a key reason Redis became the default building block for counters at scale.
8.4 Networking Considerations at Connection Scale
Concurrency isn’t only about threads inside a single process — it’s also about how the network layer behaves under millions of simultaneous, long-lived connections. A few networking details matter more here than in most systems you’ll design:
- TCP connection overhead: each WebSocket connection consumes a file descriptor and kernel-level socket buffer on the server holding it. Operating system tuning (raising file descriptor limits, tuning TCP keepalive intervals) becomes a genuine, practical concern once a single gateway node approaches tens of thousands of open connections.
- HTTP/2 multiplexing: for clients using Server-Sent Events or polling fallbacks, HTTP/2’s ability to multiplex many logical streams over a single TCP connection reduces per-connection overhead compared to older HTTP/1.1 approaches that typically required one connection per request stream.
- Keepalive and idle timeout tuning: WebSocket connections that sit idle (a user has the app open but isn’t actively scrolling) still need periodic keepalive pings to survive intermediate proxies and load balancers that silently drop connections after a period of inactivity — getting this interval wrong either wastes bandwidth on unnecessary pings or causes connections to drop unexpectedly.
- Connection draining during deploys: when a gateway node is being taken out of rotation for a deployment, existing connections should be drained gracefully (clients told to reconnect elsewhere) rather than abruptly severed, avoiding a visible glitch for users mid-session.
CAP Theorem & Consistency Models
No serious conversation about a distributed counter is complete without explicitly placing the design on CAP.
No serious system design conversation about a distributed counter is complete without explicitly placing the design on the CAP theorem. CAP theorem states that under a network partition, a distributed system must choose between Consistency (every read sees the latest write) and Availability (every request gets a response, even if it’s not the absolute latest data).
9.1 Where This System Sits
The visible like/share count deliberately chooses AP (Availability + Partition tolerance) over strict consistency. If a cache shard is temporarily unreachable, it’s far better for users to see a slightly stale count than to see an error or a frozen page. The system is explicitly designed around eventual consistency: given enough time without new writes, every replica of the counter will converge to the same correct value, even though at any single instant different users might briefly see slightly different numbers.
However, the underlying event log (the durable, ordered stream of every like/unlike/share event) is treated with much stronger guarantees, because it’s the source of truth for billing, analytics, and dispute resolution. That layer favors CP (Consistency + Partition tolerance) — better to briefly reject or delay a write than to silently record it incorrectly or lose it.
✓ Why AP for the Visible Counter
- Users tolerate a slightly stale number far better than a broken page
- Enables horizontal scaling without cross-node coordination on every write
- Keeps write latency low and predictable even during partial outages
✗ What You Give Up
- Different users can briefly see different counts for the same post
- Requires careful reconciliation logic to converge counts after a partition heals
- Cannot be used directly as the source of truth for billing without a separate, stricter path
9.2 Consistency Levels in Practice
| Layer | Consistency Model | Reasoning |
|---|---|---|
| Visible like/share count | Eventual consistency | Optimized for speed and availability; small staleness is invisible to users |
| Event stream (Kafka) | Strong ordering per partition | Guarantees events for a single post are processed in the order they occurred |
| Durable ledger (Cassandra/DynamoDB) | Tunable — typically quorum reads/writes | Source of truth for analytics and billing needs stronger guarantees |
| Idempotency cache | Strong, single-node consistency | Must correctly detect duplicates in the short term or double-counting occurs |
“Would you use strong consistency anywhere in this system, and if so, where?” A thoughtful answer: yes — for the idempotency check (you cannot afford eventual consistency there without risking double-counted likes) and for the durable ledger feeding billing systems, where financial or contractual accuracy outweighs latency concerns. The skill being tested is recognizing that a single system can — and often should — apply different consistency models to different sub-components, rather than picking one model for the whole system.
9.3 Consensus and Leader Election Under the Hood
It’s easy to treat Redis and Cassandra as black boxes, but understanding what happens internally during a failure builds real credibility in an interview. Redis, when deployed with Sentinel or Redis Cluster for high availability, uses a consensus-like voting mechanism among Sentinel nodes to detect a failed primary and agree on which replica should be promoted — a lightweight relative of the same leader-election problem solved more rigorously by algorithms like Raft and Paxos in systems like etcd or ZooKeeper. Cassandra takes a different approach entirely: rather than electing a single leader, it uses a gossip protocol, where nodes continuously exchange state information with a few random peers, letting membership and health information propagate through the whole cluster without any central coordinator — a design choice that favors availability and horizontal scale over the stronger coordination guarantees a Raft-based system provides.
Why does this distinction matter for a counter system specifically? Because it explains why different components in this architecture recover differently from failure. A Redis Sentinel failover involves a brief window (often a few seconds) where writes to the affected shard may be rejected or delayed while a new primary is elected and agreed upon — exactly the kind of short, bounded unavailability the write-behind, queue-buffered design is built to absorb gracefully. Cassandra’s gossip-based membership, by contrast, tends to degrade more gradually under partial failure, continuing to serve reads and writes from unaffected nodes even while the cluster is still converging on the current membership state.
Caching Strategy
Caching isn’t bolted on afterward — it’s the primary mechanism that makes the whole system work.
Caching isn’t an optimization bolted on afterward here — it’s the primary mechanism that makes the whole system work. Almost every read and the vast majority of writes touch cache, not the database.
10.1 Write-Behind (Write-Back) Caching
The aggregation service updates the fast cache (Redis) immediately and synchronously, but writes to the durable database asynchronously, in batches, on a delay. This is called write-behind caching: the cache is updated first, and the slower, durable store catches up afterward. It maximizes write throughput at the cost of a short window where the cache is “ahead” of the durable store — acceptable here because the event stream guarantees no data is lost even if the flush is delayed.
10.2 Multi-Layer Caching
L1 — In-process memory
Each service instance briefly buffers increments in local memory (e.g., a LongAdder-backed map) before flushing to Redis, cutting down on network round-trips for extremely hot posts.
L2 — Distributed cache (Redis)
The shared, authoritative “fast” value everyone reads from and writes through. Sharded per hot post, replicated for availability.
L3 — CDN / Edge cache
Caches the count for a very short TTL (1–5 seconds) at edge locations close to users, absorbing the enormous read volume from casual viewers who aren’t actively watching the number change live.
10.3 Cache Invalidation and TTL Strategy
Because staleness is tolerated by design, this system leans on time-based expiration rather than complex invalidation logic. A summed, cached total (across shards) might carry a 1–2 second TTL. Edge/CDN caches might carry a slightly longer TTL for very hot, extremely high-traffic posts, deliberately trading a bit more staleness for a bit less origin load — a classic, well-understood engineering trade-off rather than an oversight.
10.4 Cache Warm-Up and Cold Starts
When a Redis node restarts or a new shard is added, counters temporarily show as zero or missing unless mitigated. Production systems handle this with a fast recovery path: on cache miss, fall back to reading the last known durable value from the database, seed the cache with it, and let live increments continue from there — never showing a like count that appears to have reset to zero, which would look like a visible bug to users.
Twitter (now X) has publicly described evolving its like and retweet counters through several generations of counting infrastructure, moving from direct database counters toward dedicated, horizontally-scaled counting services backed by in-memory stores, precisely to handle extreme bursts around live events like sports finals and award shows, where engagement on specific tweets spikes by orders of magnitude within seconds.
Database Design
The durable store exists for a different purpose than the cache: not speed, but truth.
The durable store exists for a different purpose than the cache: not speed, but truth. It needs to survive restarts, support analytics queries, and provide an auditable history.
11.1 Choosing the Database Type
A wide-column store like Cassandra or a managed NoSQL store like DynamoDB is a strong fit here, for a few concrete reasons: both scale horizontally by partitioning on a key (naturally, post_id), both support very high write throughput for append-style workloads, and both let you tune consistency per-operation (e.g., DynamoDB’s eventually-consistent vs. strongly-consistent reads) rather than forcing one model everywhere.
11.2 Schema Design
-- Aggregated, current-truth counters (one row per post)
CREATE TABLE post_counters (
    post_id       TEXT PRIMARY KEY,
    like_count    BIGINT,
    share_count   BIGINT,
    last_updated  TIMESTAMP,
    version       BIGINT   -- optimistic concurrency marker
);

-- Append-only event ledger (source of truth for audits/billing)
CREATE TABLE like_events (
    post_id       TEXT,
    event_id      UUID,
    user_id       TEXT,
    action        TEXT,      -- 'like' | 'unlike' | 'share'
    event_time    TIMESTAMP,
    PRIMARY KEY (post_id, event_time, event_id)
) WITH CLUSTERING ORDER BY (event_time DESC);
Notice the two-table split: post_counters holds the cheap-to-read aggregated number, while like_events holds the full, granular, append-only history. This separation — a fast summary table plus a detailed event log — is a recurring pattern anywhere aggregation and auditability both matter.
11.3 Partitioning Strategy
Partitioning by post_id is the natural choice — it keeps all data for one post together, which is exactly what both the read path (show this post’s count) and write path (aggregate this post’s events) need. The one risk is the same hot-key problem discussed earlier: a single viral post’s partition can receive disproportionate traffic even at the database layer. Some systems mitigate this with a compound partition key like post_id + time_bucket, spreading a single post’s events across multiple partitions over time.
11.4 Hash Partitioning vs. Range Partitioning
Two broad strategies exist for distributing data across nodes, and the choice matters for this workload specifically. Hash partitioning applies a hash function to the partition key (here, post_id) and uses the result to determine which node owns that data — this distributes load evenly and predictably across the cluster regardless of the actual key values, which is exactly what you want when you can’t predict in advance which post_id is about to go viral. Range partitioning, by contrast, assigns contiguous ranges of keys to specific nodes (useful for range-scan queries, like “give me all events between these two timestamps”), but risks concentrating load on one node if traffic clusters within a narrow key range — a real danger if post_ids were assigned sequentially and recent posts (which naturally receive more engagement) all hashed to nearby ranges. For this reason, counter systems overwhelmingly favor hash partitioning for the primary counter table, sometimes combined with range partitioning on a secondary dimension (like time) for the event ledger, where efficient time-range queries genuinely matter for analytics.
11.5 Replication Factor and Quorum Reads/Writes
Both Cassandra and DynamoDB let you tune a replication factor (commonly 3, meaning each piece of data lives on three separate nodes) and a consistency level per operation — for example, requiring a write to be acknowledged by a quorum (majority) of replicas before returning success. For the durable ledger, a quorum write (e.g., 2 out of 3 replicas) strikes a practical balance: it survives a single node failure without data loss, while avoiding the latency cost of waiting for every single replica to acknowledge on every write.
11.6 Avoiding Write Amplification
Because the aggregation service batches updates before writing, the database sees perhaps one write every 5–10 seconds per active post, rather than one write per individual like. For a post receiving 10,000 likes per second, that’s the difference between roughly 10,000 database writes/sec and roughly 0.1–0.2 writes/sec for that post — a reduction of multiple orders of magnitude, and the single biggest factor making this design viable at scale.
“Why not just use a relational database like PostgreSQL for the counter table?” A relational database can absolutely work for the aggregated post_counters table at moderate scale, and many systems do exactly that. The reasoning to bring up: the choice depends on overall write volume, need for horizontal partitioning beyond a single machine’s capacity, and whether you need cross-row transactions (usually you don’t, for independent per-post counters) — for extreme global scale, a horizontally-partitioned NoSQL store avoids the single-primary bottleneck a traditional relational setup eventually hits.
Real-Time Delivery: Getting Updates to Millions of Screens
Counting correctly on the backend solves only half the problem — the other half is pushing that number to every screen.
Counting correctly on the backend solves only half the problem. The other half is pushing that updated number to every screen currently displaying the post — potentially millions of devices — without asking each one to repeatedly ask “anything new?”
12.1 Polling vs. Long Polling vs. WebSockets vs. SSE
| Technique | How It Works | Trade-off |
|---|---|---|
| Short polling | Client requests the count every few seconds | Simple, but wasteful — most requests return “nothing changed,” and it doesn’t scale well past moderate traffic |
| Long polling | Server holds the request open until there’s an update, or a timeout | Fewer wasted requests than short polling, but still one connection cycle per update, and ties up server resources |
| Server-Sent Events (SSE) | Server pushes a one-way stream of events over a single long-lived HTTP connection | Simple, works well through most infrastructure, but is one-directional and less efficient for very high fan-out than WebSockets |
| WebSockets | Full-duplex, persistent connection between client and server | Most efficient for high-frequency bidirectional updates; more complex to scale (needs careful connection management) and needs sticky routing or a shared pub/sub layer |
For this system, a common production choice is WebSockets for actively engaged users (someone scrolling a feed, watching a live video) combined with polling or SSE as a fallback for clients on restrictive networks or older devices that don’t support persistent WebSocket connections well.
12.2 The Fan-Out Challenge
A single viral post might have a million people simultaneously subscribed to its live updates. No single server holds a million open connections efficiently on its own, so the WebSocket layer is horizontally scaled across many gateway nodes, each holding a slice of the total connections. The hard part is: when the counter updates, how does the update reach the correct subset of gateway nodes holding the relevant subscriptions?
Every WebSocket gateway node subscribes to the pub/sub topics matching the posts its connected clients care about. When a delta event is published, every relevant gateway node receives it independently and forwards it only to its own locally connected, subscribed clients. This design means gateway nodes never need to know about each other directly — the pub/sub layer handles all the coordination.

12.3 Throttling Update Frequency
Pushing an update on literally every single increment would flood connections and waste bandwidth on updates too small to notice visually. Production systems throttle broadcast frequency — for example, at most once per second per post, or only when the count crosses a meaningful threshold — batching many small increments into one broadcast update. Users still perceive the number as “live” because a 1-second cadence feels instantaneous to a human, while dramatically cutting the actual message volume.
public class ThrottledBroadcaster {

    private final Map<String, Long> lastBroadcastTime = new ConcurrentHashMap<>();
    private static final long MIN_INTERVAL_MS = 1000;

    public void maybeBroadcast(String postId, long currentCount, PubSubClient pubSub) {
        long now = System.currentTimeMillis();
        long last = lastBroadcastTime.getOrDefault(postId, 0L);

        if (now - last >= MIN_INTERVAL_MS) {
            pubSub.publish("post:" + postId + ":count", currentCount);
            lastBroadcastTime.put(postId, now);
        }
        // If a broadcast is skipped, the next scheduled tick will catch up
        // with the latest count, so no update is permanently lost.
    }
}“How would you scale WebSocket connections to tens of millions of concurrent users?” Key points to hit: horizontally scale stateless-as-possible gateway nodes behind a load balancer that supports sticky sessions or connection-aware routing; use a pub/sub backbone (Redis Pub/Sub for moderate scale, Kafka for very high scale) so gateway nodes don’t need direct knowledge of each other; and consider connection limits per node (commonly tens of thousands per node depending on message size and frequency) when capacity planning, adding nodes horizontally as connection counts grow.
Scalability & Load Balancing
Every component in this architecture is designed to scale horizontally — no single machine could keep up at this traffic scale, regardless of its size.
Every component in this architecture is designed to scale horizontally — adding more machines rather than relying on ever-bigger single machines — because at this traffic scale, no single machine could keep up regardless of its size.
13.1 Horizontal Scaling of the Like Service
The Like/Share Service is intentionally stateless: any instance can handle any request, because idempotency and business state live in shared external stores (Redis, the event stream), not in the process itself. This means it scales trivially — a load balancer distributes traffic across as many instances as needed, and an autoscaler adds or removes instances based on request rate or CPU utilization.
13.2 Load Balancing Strategies
| Strategy | Best For |
|---|---|
| Round robin | Simple, even distribution when all backend instances are roughly equal in capacity |
| Least connections | Longer-lived connections (like WebSocket gateways) where request duration varies significantly |
| Consistent hashing | Routing requests for the same post consistently to the same aggregation instance, improving cache locality |
| Geo-based routing | Directing users to the nearest regional deployment, reducing latency for a global user base |
13.3 Partitioning the Event Stream
Kafka (or a similar system) partitions the like/share event topic by post_id, ensuring all events for one post land on the same partition and are processed in order by a single consumer at a time — critical for the aggregation logic to work correctly without needing distributed locks. The number of partitions determines the maximum parallelism of the aggregation layer, so it’s chosen generously up front (partitions are far easier to add than to safely reduce later).
13.4 Autoscaling Under Bursty Load
Traffic on this kind of system is inherently spiky — a normal Tuesday afternoon looks nothing like the minute after a celebrity posts something or a sports match ends. Autoscaling policies here typically react to leading indicators (queue depth in the event stream, CPU on aggregation instances, connection count on gateway nodes) rather than lagging indicators alone, so new capacity comes online before a backlog builds up rather than after users already notice degraded performance.
13.5 Reference Numbers
16–64
Typical shard count per hot counter, spreading atomic increments across many independent keys.
200 ms
Typical micro-batch window inside the aggregation service before flushing accumulated deltas.
50K+
Concurrent open connections a single well-tuned WebSocket gateway node can hold.
5–10 s
Typical durable-flush interval from cache to the authoritative store per active post.
“A single post suddenly gets 500,000 likes in one minute — walk me through what happens in your system.” Strong answer: the Like Service instances scale out automatically to absorb the API traffic; events land on that post’s Kafka partition, which can become a temporary hotspot, so a well-designed system either pre-allocates extra partitions for anticipated hot content or applies dynamic key-splitting; the aggregation service’s shard count for that post absorbs concurrent writes without contention; and the durable database sees the same low, batched write rate regardless of the burst, because aggregation smooths the spike before it ever reaches storage.
High Availability & Reliability
A slightly stale count is fine. Errors or a frozen feed are not.
A “like” counter feature failing outright — showing errors, or freezing the entire feed — is far worse for user trust than showing a count that’s a few seconds stale. Every design decision in this section optimizes for graceful degradation over perfect correctness.
14.1 Replication
The Redis cluster holding sharded counters runs with replicas per shard (typically one primary plus one or more replicas), so a single node failure doesn’t lose recently-written counter state — a replica is promoted automatically, and clients reconnect transparently. The durable database (Cassandra/DynamoDB) similarly replicates data across multiple nodes and, ideally, multiple availability zones, so a zone outage doesn’t take down the source of truth.
14.2 Failure Recovery
If the aggregation service crashes mid-batch, it hasn’t lost any data — because it processes events from the durable, replayable event stream, it simply resumes from its last committed offset on restart, reprocessing any events it hadn’t yet acknowledged. This is why an idempotent design matters even at the aggregation layer: reprocessing the same event twice after a crash (a rare but possible “at-least-once” delivery scenario) should never double count.
14.3 Graceful Degradation
Cache Cluster Degraded
Fall back to serving the last known count from the durable database, marked as potentially slightly stale, rather than showing an error.
WebSocket Layer Overloaded
Clients automatically fall back to periodic polling with backoff, trading real-time feel for continued functionality.
Event Stream Backlog Builds Up
Counts lag behind actual activity temporarily but never lose data — the queue absorbs the burst and catches up once load subsides.
Database Temporarily Unreachable
The live cache continues serving reads and writes normally; the durable flush retries with backoff until the database recovers.
14.4 Multi-Region Disaster Recovery
For platforms operating globally, an entire region can fail — a data center outage, a cloud provider incident. A resilient design runs active deployments in multiple regions, with cross-region replication of the durable ledger and CRDT-based counter merging (as discussed earlier) so users can be failed over to a healthy region without losing engagement data or requiring complex reconciliation logic after the fact.
14.5 Backup and Audit
The append-only event ledger doubles as a natural backup mechanism — because it records every individual action with a timestamp, the aggregated counter can always be recomputed from scratch by replaying the ledger, providing a strong disaster-recovery guarantee and a clean audit trail for disputes (for example, if a brand disputes an engagement count used for advertising billing).
14.6 Running Disaster Recovery Drills
A recovery plan that’s never been tested is, in practice, only a hypothesis. Mature teams operating a system at this scale run scheduled disaster-recovery drills — deliberately failing over traffic from a primary region to a secondary one, or restoring the durable counter store from a ledger replay, on a regular cadence, during business hours, with engineers actively observing the process. These drills routinely surface gaps that look fine on paper but fail in practice: a runbook referencing an outdated command, a replay job that takes far longer than expected under real data volumes, or a failover that technically succeeds but produces a brief spike in error rates nobody had accounted for. Treating recovery as a rehearsed, practiced procedure rather than a one-time design decision is what actually determines whether a real incident, months later, resolves in minutes or drags on for hours.
“How do you guarantee no like event is permanently lost, even during a partial outage?” The answer chains together several of the earlier decisions: durable, replicated event streaming means events survive service crashes; at-least-once delivery combined with idempotent processing means reprocessing is safe; and the append-only ledger means the aggregated count can always be reconstructed from raw events if the cache or aggregation layer needs to be rebuilt from scratch.
Security
A feature this simple-looking is, perhaps surprisingly, a common target for abuse — defenses baked in, not bolted on.
A feature this simple-looking is, perhaps surprisingly, a common target for abuse — fake engagement is a real business problem for social platforms, and the counting system needs defenses baked in, not bolted on.
15.1 Authentication and Authorization
Every like/share request must be tied to an authenticated user (via a session token or JWT validated at the API Gateway), preventing anonymous or spoofed likes. Authorization checks ensure a user can only like/unlike on their own behalf, never on behalf of another user_id passed in a request.
15.2 Rate Limiting and Bot Detection
A per-user, per-IP, and per-device rate limiter caps how many like/share actions can occur in a short window, blocking scripted bot accounts attempting to inflate a post’s engagement artificially. More sophisticated systems layer in behavioral signals — click timing patterns, device fingerprinting, account age and history — feeding a fraud-scoring model that can flag suspicious engagement for review or silent exclusion from public counts, without necessarily blocking the action outright.
15.3 Idempotency as a Security Boundary
The same idempotency mechanism that prevents accidental double-counting from network retries also blocks a certain class of abuse — rapid repeated taps or replayed requests attempting to inflate a count through duplication rather than genuine distinct actions.
15.4 Protecting Against DDoS
Because the like/share endpoint is public-facing and lightweight to call, it’s an attractive target for denial-of-service attempts aimed at overwhelming backend capacity. Standard defenses apply: a CDN/WAF layer in front of the API Gateway absorbing volumetric attacks, aggressive rate limiting at the edge, and circuit breakers within the service mesh that shed load gracefully rather than cascading failure into downstream systems.
15.5 Data Integrity for Billing-Relevant Engagement
Where like/share counts feed into anything with financial consequences (sponsored content payouts, creator monetization, ad performance metrics), the durable event ledger needs tamper-evidence — commonly achieved through write-once storage semantics, checksums, and restricted write access limited to the aggregation service’s service account, with all administrative overrides logged and auditable.
“How would you detect and prevent like-count manipulation from bot farms?” A layered answer works best: rate limiting stops the crudest attempts; device and behavioral fingerprinting catches more sophisticated automation; anomaly detection on the aggregation layer can flag posts with statistically unusual like velocity or a suspicious ratio of likes to genuine page views; and flagged engagement can be excluded from the public count pending review, without needing to block the underlying user action outright, minimizing false positives against real users.
15.6 Encryption In Transit and At Rest
All client-to-server traffic, including the WebSocket connections carrying live count updates, should run over TLS, preventing eavesdropping or tampering on untrusted networks — a genuine concern given how often mobile clients connect over public Wi-Fi. Data at rest in the durable database and event stream should also be encrypted, both to satisfy common compliance requirements (SOC 2, GDPR-adjacent obligations around user activity data) and as defense-in-depth, so a storage-layer breach doesn’t directly expose raw engagement history. None of this adds meaningful latency at modern hardware-accelerated TLS speeds, so there’s rarely a good reason to skip it, even on purely internal service-to-service traffic within the same cluster.
Monitoring, Logging & Metrics
Catch problems before users do, and understand normal vs. abnormal on ever-changing traffic patterns.
A system this central to user-facing experience needs deep observability — both to catch problems before users do, and to understand normal versus abnormal behavior on an ever-changing traffic pattern.
16.1 Key Metrics to Track
| Metric | Why It Matters |
|---|---|
| Event stream lag (consumer offset vs. latest offset) | Rising lag signals the aggregation layer can’t keep up with incoming events — an early warning of a coming user-visible delay |
| Cache hit ratio | A dropping hit ratio suggests cache capacity issues or unusual cold-key traffic patterns |
| Durable flush success rate | Failures here risk data loss if not caught and retried promptly |
| P50/P95/P99 write latency | Tail latency (P99) often reveals contention or hot-shard issues invisible in average latency numbers |
| WebSocket connection count per node | Tracks fan-out capacity headroom and informs autoscaling decisions |
| Counter drift (cache vs. durable store) | Detects divergence that could indicate a bug in the reconciliation logic |
16.2 Logging Strategy
High-cardinality, high-volume events like individual likes should not be logged verbosely in a general-purpose logging system at full volume — the cost and noise would be enormous. Instead, structured, sampled logging captures a representative slice of events for debugging, while the full, authoritative record lives in the event stream and durable ledger, which are purpose-built for high-volume storage and later analysis.
16.3 Distributed Tracing
Because a single like touches several services (Gateway, Like Service, Event Stream, Aggregator, Cache, Pub/Sub, WebSocket Gateway), distributed tracing (using something like OpenTelemetry, with a trace ID propagated through every hop) is essential for diagnosing where latency or failures occur in a specific slow request, rather than guessing across a chain of loosely correlated logs.
16.4 Alerting
Alerts should be tuned around leading indicators — a growing event stream lag, a rising error rate on the durable flush, an unusual spike in rate-limit rejections — rather than only alerting after users are already visibly affected. Good alerting on this kind of system distinguishes between “a specific post’s shard is temporarily hot” (often self-resolving, log and watch) and “the aggregation service as a whole is falling behind” (page an engineer immediately).
Meta (Facebook/Instagram) has spoken publicly about internal systems like TAO (The Associations and Objects graph cache) that sit in front of their databases specifically to absorb extremely high read/write volume for social graph data, including like counts, with heavy investment in monitoring cache consistency and replication lag across globally distributed data centers — a direct real-world analog to the caching and monitoring layers described in this tutorial.
16.5 SLOs and Error Budgets
Rather than chasing a vague notion of “as reliable as possible,” mature teams define explicit Service Level Objectives for this system — for example, “99.9% of like actions are reflected in the durable ledger within 30 seconds” or “the read API responds within 100ms at the 99th percentile for 99.95% of requests.” These targets translate directly into an error budget: a defined, tracked allowance for how much the system is permitted to miss its targets before it triggers a deliberate slowdown in new feature rollout to prioritize stability. Framing reliability this way turns an abstract goal into a concrete, trackable number that both engineering and product teams can reason about together, and it directly informs on-call alerting thresholds — alerts should fire when the error budget is being consumed unusually fast, not merely whenever any single request is slow.
Deployment & Cloud
A brilliant architecture poorly deployed still fails users.
How this system is deployed matters almost as much as how it’s designed — a brilliant architecture poorly deployed still fails users.
17.1 Multi-Region Deployment
For a global platform, running the entire stack (Like Service, aggregation, cache, database, WebSocket gateways) in multiple geographic regions reduces latency for users everywhere and provides resilience against regional outages. Users are routed to their nearest healthy region via geo-DNS or a global load balancer, with cross-region replication reconciling counters using the CRDT approach discussed earlier.
17.2 Containerization and Orchestration
Stateless components (Like Service, Aggregation Service, WebSocket Gateway) are natural fits for containerized deployment on Kubernetes or a similar orchestrator, enabling fast, automated horizontal scaling, rolling deployments with zero downtime, and self-healing when individual instances fail health checks.
17.3 Managed Cloud Services Mapping
| Component | AWS | GCP |
|---|---|---|
| Event stream | Kinesis / MSK (managed Kafka) | Pub/Sub / Confluent on GCP |
| Sharded cache | ElastiCache for Redis | Memorystore for Redis |
| Durable store | DynamoDB | Bigtable / Firestore |
| WebSocket gateway | API Gateway WebSocket APIs / self-managed on EKS | Self-managed on GKE |
| CDN / edge cache | CloudFront | Cloud CDN |
17.4 Cost Optimization
The batching and aggregation strategy described throughout this tutorial isn’t only a performance optimization — it’s also directly a cost optimization, since database write operations and inter-service network calls are typically billed per-operation or per-throughput-unit in managed cloud services. Reducing millions of individual writes to a much smaller number of batched writes has a direct, often dramatic, impact on monthly infrastructure cost. Reserved or committed-use capacity for predictable baseline load, combined with autoscaling for bursts, further optimizes spend versus always provisioning for peak capacity.
When rolling out a new WebSocket gateway version, instrument the deployment with an automatic reconnection-rate guardrail: if the per-second reconnect rate observed during connection draining exceeds a preconfigured ceiling, pause the rollout until the herd settles rather than continuing to drain more nodes on top of an already-stressed reconnection surge.
“How would this design change for a company that can’t afford a large multi-region infrastructure investment?” Good answer: the core architectural ideas (batching, sharded counters, eventual consistency, atomic increments) still apply at a single-region, smaller scale, using managed services to reduce operational overhead — for example, a single Redis instance with a few logical shards, a managed Kafka-compatible queue, and a simpler polling-based fallback instead of a full WebSocket fan-out layer, scaling each piece up only once actual traffic demands it.
APIs & Microservices
Clean API design and clear service boundaries keep this maintainable as it grows.
Clean API design and clear service boundaries keep this system maintainable as it grows and as more engineers work on different parts of it.
18.1 API Design
POST /v1/posts/{postId}/like
Headers: Authorization: Bearer <token>
Response: 202 Accepted
{
  "status": "queued",
  "optimisticCount": 42319
}

DELETE /v1/posts/{postId}/like
Response: 202 Accepted

POST /v1/posts/{postId}/share
Response: 202 Accepted

GET /v1/posts/{postId}/counts
Response: 200 OK
{
  "postId": "123",
  "likeCount": 42318,
  "shareCount": 1204,
  "asOf": "2026-07-26T10:15:32Z"
}

WS /v1/realtime/subscribe
Subscribe message: { "postIds": ["123", "456"] }
Server push: { "postId": "123", "likeCount": 42340, "delta": 22 }
Notice the write endpoints return 202 Accepted rather than 200 OK — this deliberately signals to the client that the action has been durably queued for processing, but not necessarily fully reflected everywhere yet, an honest reflection of the system’s asynchronous, eventually-consistent design.
18.2 Microservice Boundaries
Each service owns a narrow, well-defined responsibility: the Like/Share Service only validates and publishes events; it knows nothing about caching internals or aggregation logic. The Aggregation Service only consumes events and maintains counters; it knows nothing about authentication or client connections. This separation lets teams scale, deploy, and even rewrite each service independently, as long as the contracts (event schema, API shape) stay stable.
18.3 gRPC for Internal Service-to-Service Calls
While the public-facing API is typically REST or GraphQL for broad client compatibility, internal service-to-service communication (e.g., between the Aggregation Service and internal analytics consumers) often uses gRPC for its lower serialization overhead and strongly-typed contracts via Protocol Buffers — a meaningful efficiency gain at the scale this system operates.
18.4 Event Schema Versioning
As the system evolves, the like/share event schema will need to change (new fields, new action types). Using a schema registry (common with Kafka deployments) and following backward-compatible evolution rules (only adding optional fields, never repurposing existing ones) prevents a schema change from breaking consumers that haven’t yet been updated — a subtle but important operational discipline at this scale.
“Why return 202 Accepted instead of 200 OK from the like endpoint?” This tests whether you understand the honesty of API design in an asynchronous system: 200 OK implies the operation fully completed and is reflected everywhere; 202 Accepted correctly communicates “your request was durably received and will be processed,” matching the system’s actual eventual-consistency guarantees rather than overpromising synchronous completion.
Design Patterns & Anti-Patterns
Naming the patterns isn’t academic vocabulary — it signals every design choice was deliberate.
Naming the patterns at work here isn’t just academic vocabulary — being able to name a pattern precisely in an interview signals that a design choice was deliberate and well-understood, not accidental or copied without comprehension. Each pattern below solves a specific, identifiable problem encountered earlier in this tutorial, and recognizing which problem each one solves is more valuable than memorizing the pattern names themselves.
19.1 Patterns Used in This Design
CQRS (Command Query Responsibility Segregation)
Writes (commands: like/share) and reads (queries: get count) flow through entirely different paths, optimized independently — the write path prioritizes durability and ordering, the read path prioritizes speed and caching.
Event Sourcing (partial)
The append-only event ledger means the current state (aggregated count) can always be recomputed by replaying historical events, providing a strong recovery and audit mechanism.
Write-Behind Caching
Updates land in the fast cache immediately, with durable persistence happening asynchronously afterward, trading a small durability window for much higher write throughput.
Sharding / Partitioning
Splitting a single hot counter into multiple independently-writable pieces, summed together on read, is the foundational pattern making this whole system viable.
Circuit Breaker
Protects downstream services (database, cache) from cascading failure by failing fast and falling back gracefully when a dependency is unhealthy, rather than piling up retries against a struggling system.
Publish/Subscribe
Decouples the counting logic from the connection-management logic, letting either side scale and evolve independently.
19.2 Anti-Patterns to Avoid
✗ Anti-Patterns
- Direct database increment per like — recreates the hot-row bottleneck this whole design exists to avoid
- Synchronous cross-service calls on the write path — every added synchronous hop directly increases user-facing latency and creates cascading failure risk
- Read-modify-write without atomicity — silently loses increments under concurrency
- Broadcasting every single increment individually — floods connections and wastes bandwidth on imperceptible updates
- Treating the cache as the sole source of truth — leaves no recovery path if the cache is lost entirely
✓ Correct Alternatives
- Batch and aggregate before touching durable storage
- Publish an event asynchronously and return immediately
- Use atomic operations (INCR, CRDTs) exclusively for counters
- Throttle broadcasts to a sensible human-perceivable cadence
- Maintain a durable, replayable ledger as the ultimate source of truth
“What’s the difference between event sourcing and simply logging events for debugging?” Event sourcing treats the event log as the primary, authoritative representation of state — current state is derived from replaying events, not stored independently as the “real” truth. This design uses a partial form of it: the ledger genuinely could reconstruct the counter from scratch, even though for performance the aggregated counter is also stored directly rather than recomputed on every read.
Best Practices & Common Mistakes
Habits to build in — and the specific failure modes each one prevents.
20.1 Best Practices
- Always make counter increments atomic — never implement a manual read-then-write pattern for anything counting at scale.
- Design for idempotency from day one — retries, duplicate taps, and at-least-once delivery are inevitable, not edge cases.
- Separate the fast, approximate, user-facing number from the slow, exact, source-of-truth number — trying to make one number serve both purposes forces you into a bad compromise on both sides.
- Batch aggressively before touching durable storage — this single decision has the largest impact on both cost and scalability.
- Throttle real-time broadcasts to a human-perceivable cadence — sub-second precision is invisible to users and expensive to deliver.
- Plan for hot keys explicitly — assume some piece of content will receive wildly disproportionate traffic, and design sharding for that case, not just the average case.
- Instrument everything — event stream lag, cache hit ratio, and flush success rate are the earliest warning signs of trouble.
- Version your event schemas deliberately — a counting pipeline that runs for years will inevitably need new fields and new action types; backward-compatible schema evolution prevents a routine change from becoming an outage.
20.2 Common Mistakes
A design that comfortably handles a typical post’s traffic can fall over completely on a single viral post — always explicitly design and load-test for the extreme, skewed traffic distribution real social platforms actually see.
These are different properties. A system can feel perfectly real-time to users while being eventually consistent under the hood — chasing strong consistency for a user-facing counter usually sacrifices the very real-time feel it was trying to achieve.
Systems designed only around incrementing counts often handle decrements as an afterthought, leading to subtle bugs — for example, failing to properly cancel a queued increment when a user rapidly likes and then unlikes within the same batching window.
Partitions are relatively easy to add ahead of time but painful to repartition later without disrupting ordering guarantees — it’s generally safer to over-provision partitions modestly upfront.
Teams sometimes build the full sharded, event-driven pipeline for a feature still receiving a few hundred requests per day, adding operational burden and engineering time that would have been better spent elsewhere — this design earns its complexity only once real traffic patterns demonstrate the need for it.
Real-World & Industry Examples
Where these exact patterns appear in production systems you already use every day.
Instagram’s like counts are backed by infrastructure descended from Facebook’s broader social-graph counting systems, which historically moved from direct database counters to dedicated, cache-backed counting services precisely to handle viral posts without database contention — the same core problem and the same core solution shape covered throughout this tutorial. Notably, Instagram also famously experimented with hiding public like counts entirely in some markets, a reminder that the hardest problems in a system like this aren’t always purely technical — product and policy decisions about what to show, and to whom, shape the engineering requirements just as much as raw scale does.
YouTube’s public view counter is well documented to intentionally lag behind actual view events during high-velocity periods, because the counting pipeline applies asynchronous validation and anti-fraud filtering before a view is reflected publicly — a real-world example of deliberately trading immediate accuracy for correctness and abuse resistance. This is also why creators sometimes observe a video’s view count appear to “pause” shortly after a large traffic surge, even while watch time and other metrics continue climbing normally behind the scenes.
Twitter’s engineering blog has historically discussed evolving their counting infrastructure toward dedicated services optimized for extreme write bursts around live events (elections, sports finals, award shows), where a single tweet’s engagement can spike by multiple orders of magnitude within seconds — directly motivating sharded, cache-backed counters over direct database writes. The platform’s real-time trends and engagement counters have long served as one of the most cited public examples of this exact class of scaling problem in distributed-systems literature and conference talks.
Reddit’s vote counting system (upvotes/downvotes) faces a closely related problem — extremely hot posts receiving huge concurrent vote volume — and has publicly discussed using asynchronous, queue-based vote processing combined with periodic score recalculation rather than synchronous per-vote database updates.
While not a like/share counter, Uber’s real-time trip and driver-location systems solve a structurally similar problem — extremely high write volume on frequently-changing values, combined with a need to push updates to many simultaneously-watching clients — using comparable patterns: sharded state, event streaming, and pub/sub fan-out to connected clients.
Advantages, Disadvantages & Trade-offs
Every design choice above trades something away — here they are, side by side.
✓ Advantages of This Architecture
- Scales horizontally to handle extreme, unpredictable traffic spikes on individual pieces of content
- Dramatically reduces database write load through batching, lowering both latency and infrastructure cost
- Degrades gracefully under partial failure rather than breaking outright
- Cleanly separates fast approximate display from slow exact source of truth, letting each be optimized independently
- Naturally supports auditability and disaster recovery via the append-only event ledger
✗ Disadvantages & Costs
- Significantly more operational complexity than a naive direct-database-write approach
- Requires careful tuning (batch windows, shard counts, TTLs) that needs revisiting as traffic patterns evolve
- Eventual consistency means occasional brief discrepancies between what different users see
- More moving pieces (queue, cache cluster, pub/sub, gateway layer) means more components that can individually fail and need monitoring
- Higher upfront engineering investment, justified only once traffic genuinely requires it
This last point is worth emphasizing in an interview: a small application with modest traffic absolutely should not build this entire architecture on day one. The right answer to “how would you build this” always depends on scale — for a small app, a simple database counter with basic caching is the right, pragmatic choice, and this elaborate architecture is what you grow into as traffic genuinely demands it, not what every application needs from the start.
22.1 Key Trade-off: In-Memory Cache vs. Durable Store as the “Truth”
| Dimension | Cache-as-Truth | Ledger-as-Truth (This Design) |
|---|---|---|
| Recovery from cache loss | Data-loss risk if the cache node fails before persistence | Fully recoverable from the append-only event ledger |
| Read latency | Excellent everywhere — cache is authoritative | Excellent for the vast majority of reads (cache-fronted), with a fallback path to durable storage on miss |
| Operational complexity | Simpler, but only in ideal conditions — failure modes are catastrophic | More moving pieces, but every failure mode has a defined, graceful path |
| Best fit | Rare cases where absolute worst-case data loss is acceptable | Anything user-facing at scale, especially where engagement counts feed billing or audits |
Testing, Load Testing & Chaos Engineering
A system built for extreme bursts can’t be trusted until it’s actually been pushed past its limits deliberately.
A system built around handling extreme, unpredictable bursts can’t be trusted until it’s actually been pushed past its limits deliberately, under controlled conditions, before real users do it unexpectedly.
23.1 Load Testing for Hot-Key Scenarios
Standard load tests that spread traffic evenly across many keys won’t reveal hot-key problems at all — the whole point is to simulate the skewed, concentrated traffic pattern a real viral post produces. Effective load tests for this system deliberately generate a small number of extremely hot keys receiving the bulk of simulated traffic (a Zipfian or power-law distribution models real engagement patterns far better than a uniform one), while background traffic continues normally across thousands of other, cooler keys — verifying that a single hot post doesn’t degrade performance for everyone else on the platform.
23.2 Chaos Engineering
Deliberately injecting failure into a running system — killing a Redis node mid-traffic, introducing artificial network latency between the aggregation service and the event stream, forcing a WebSocket gateway node to restart under load — validates that the graceful-degradation behaviors described earlier actually work as designed, rather than only working in theory. Tools like Chaos Monkey (popularized by Netflix) or more targeted fault-injection frameworks let engineers run these experiments safely, on a schedule, rather than discovering failure modes for the first time during an actual outage.
23.3 Correctness Testing for Concurrency
Because so much of this system’s correctness depends on atomic operations behaving correctly under real concurrency, tests should include genuine concurrent-execution scenarios — many threads or processes hammering the same counter key simultaneously — verifying the final count exactly matches the expected total, not just testing the happy path with sequential, non-concurrent calls that would never actually expose a race condition even if one existed.
“How would you test that your sharded counter never loses an increment under heavy concurrent load?” A strong answer describes a targeted concurrency test: spin up a large number of concurrent workers (far exceeding realistic production concurrency, to stress-test headroom), have each perform a known, fixed number of increments against the same counter, then assert the final summed value across all shards exactly equals the expected total — any discrepancy reveals a correctness bug in the atomicity or aggregation logic that needs to be fixed before shipping.
23.4 Practical Test Matrix
| Test Class | Goal | What Success Looks Like |
|---|---|---|
| Unit tests (atomicity) | Prove read-modify-write bugs would be caught if reintroduced | Deliberately unsafe increment path fails the test consistently under concurrent execution |
| Load test (hot key, Zipfian) | Verify a single viral post doesn’t harm other traffic | P99 latency for other keys stays within its normal envelope while the hot key absorbs the burst |
| Chaos test (Redis primary kill) | Confirm failover completes within the design’s SLO window | Writes resume automatically; no ledger data loss; user-visible count catches up within seconds |
| Fan-out saturation test | Bound the WebSocket gateway’s realistic per-node connection ceiling | Node degrades gracefully at ceiling (dropped/queued messages, not crash); autoscaler adds capacity |
Frequently Asked Questions
Because guaranteeing perfect real-time accuracy for a value being modified by thousands of concurrent writers, while also serving that value to millions of concurrent readers, requires exactly the kind of tight coordination that destroys both latency and availability at this scale. The small, momentary staleness in exchange for speed and resilience is a deliberate, well-reasoned trade-off, not a compromise born of laziness.
The idempotency layer and batching window absorb this gracefully — if a like and an unlike for the same user land in the same micro-batch, they net out to zero before ever reaching the counter, avoiding wasted writes and flicker in the displayed count.
The durable database holds the last successfully flushed aggregated value, and the append-only event ledger holds everything since. On recovery, the cache is reseeded from the database, and any events not yet reflected in that snapshot are replayed from the ledger, fully reconstructing an accurate count with no permanent data loss.
For most applications, yes — and that’s fine. This design is specifically for scale where a single post can realistically receive tens of thousands of writes per second and be viewed by millions simultaneously. Smaller platforms should start simple and adopt these patterns incrementally as specific bottlenecks actually appear, rather than building all of this preemptively.
The same core pattern generalizes directly — an event type, sharded atomic counters, batched aggregation, and throttled real-time broadcast work equally well for comments, views, shares, or any other high-volume engagement metric, typically as additional event types flowing through the same underlying pipeline rather than entirely separate systems.
Kafka’s partition-based ordering guarantees and very high sustained throughput make it especially well-suited to this workload’s need for per-post ordering at massive scale. RabbitMQ or similar brokers remain perfectly valid choices at more moderate scale, or where ordering-per-key isn’t as central a requirement — the underlying pattern matters more than the specific technology chosen.
There’s no fixed universal number — it’s tuned based on observed or predicted write throughput for that specific piece of content. Many production systems start every new post with a small default shard count (or even a single shard) and dynamically increase the shard count for a specific post once its write rate crosses a defined threshold, avoiding the wasted overhead of over-sharding the vast majority of ordinary posts that never receive extreme traffic.
Structurally, yes — shares flow through the same event-driven, sharded-counter pipeline. The main practical difference is that a share often triggers secondary side effects (the shared content appearing in another user’s feed, notifications firing) that likes typically don’t, which usually means the share event fans out to additional downstream consumers beyond just the counter aggregation service, using the same underlying event stream as the distribution backbone.
If only one idea survives the conversation, it should be this: recognize early that the visible number doesn’t need to be perfectly accurate at every instant, say that trade-off out loud, and then let every subsequent decision — batching, sharding, eventual consistency, throttled broadcasts — flow logically from it. Interviewers consistently rate candidates higher when they can articulate why a trade-off is being made, not just describe the resulting architecture from memory.
Summary & Key Takeaways
Designing a real-time like and share counter for millions of simultaneous users is deceptively deep — the feature looks trivial from the outside, but building it correctly at scale touches nearly every major distributed systems concept: atomicity and concurrency control, the CAP theorem and consistency trade-offs, caching layers and cache invalidation, event-driven architecture and stream processing, database partitioning, real-time fan-out delivery, and graceful degradation under failure. It’s also a genuinely useful lens for practicing system design thinking more broadly, because nearly every pattern used here — sharding a hot key, batching writes before durable storage, decoupling producers from consumers with a queue, throttling broadcast frequency, choosing consistency models per component rather than globally — reappears constantly across unrelated systems, from ride-sharing dispatch to stock-trading order books to multiplayer game state synchronization. Internalizing this one design deeply pays dividends well beyond the specific problem of counting likes.
Key Takeaways
- The core insight driving the entire design: users need a number that feels instant and alive, not a number that’s provably exact at every millisecond — this single realization is what makes the whole system buildable.
- Never write directly to a database on the hot path of a user action at this scale — route through an event stream, aggregate in batches, and flush durably on a schedule.
- Sharded, atomic counters eliminate hot-key contention; batching turns tens of thousands of writes per second into a handful of database operations.
- Different sub-components of the same system can, and should, run on different consistency models — eventual for the visible count, strong for idempotency and the durable ledger.
- Real-time delivery to millions of viewers depends on a pub/sub fan-out layer decoupling counting logic from connection management, with throttled broadcast frequency keeping load sane.
- Every layer should degrade gracefully — a stale number beats a broken page, every time, for this kind of feature.
- This architecture is a destination to grow into as scale demands it, not a starting point for every application regardless of size.
- Read this tutorial again after building or studying a different high-scale system — the same handful of patterns, seen from a new angle, tend to click more deeply the second time around.
A number under a photo looks like the simplest pixel change on the whole screen. Behind it is a system that had to decide, for every increment, whether to touch a database, whether to broadcast, whom to broadcast to, and how strictly to promise the number is correct right now — and had to make those decisions tens of millions of times a second without ever letting the rest of the app feel it. That’s the design worth remembering.

