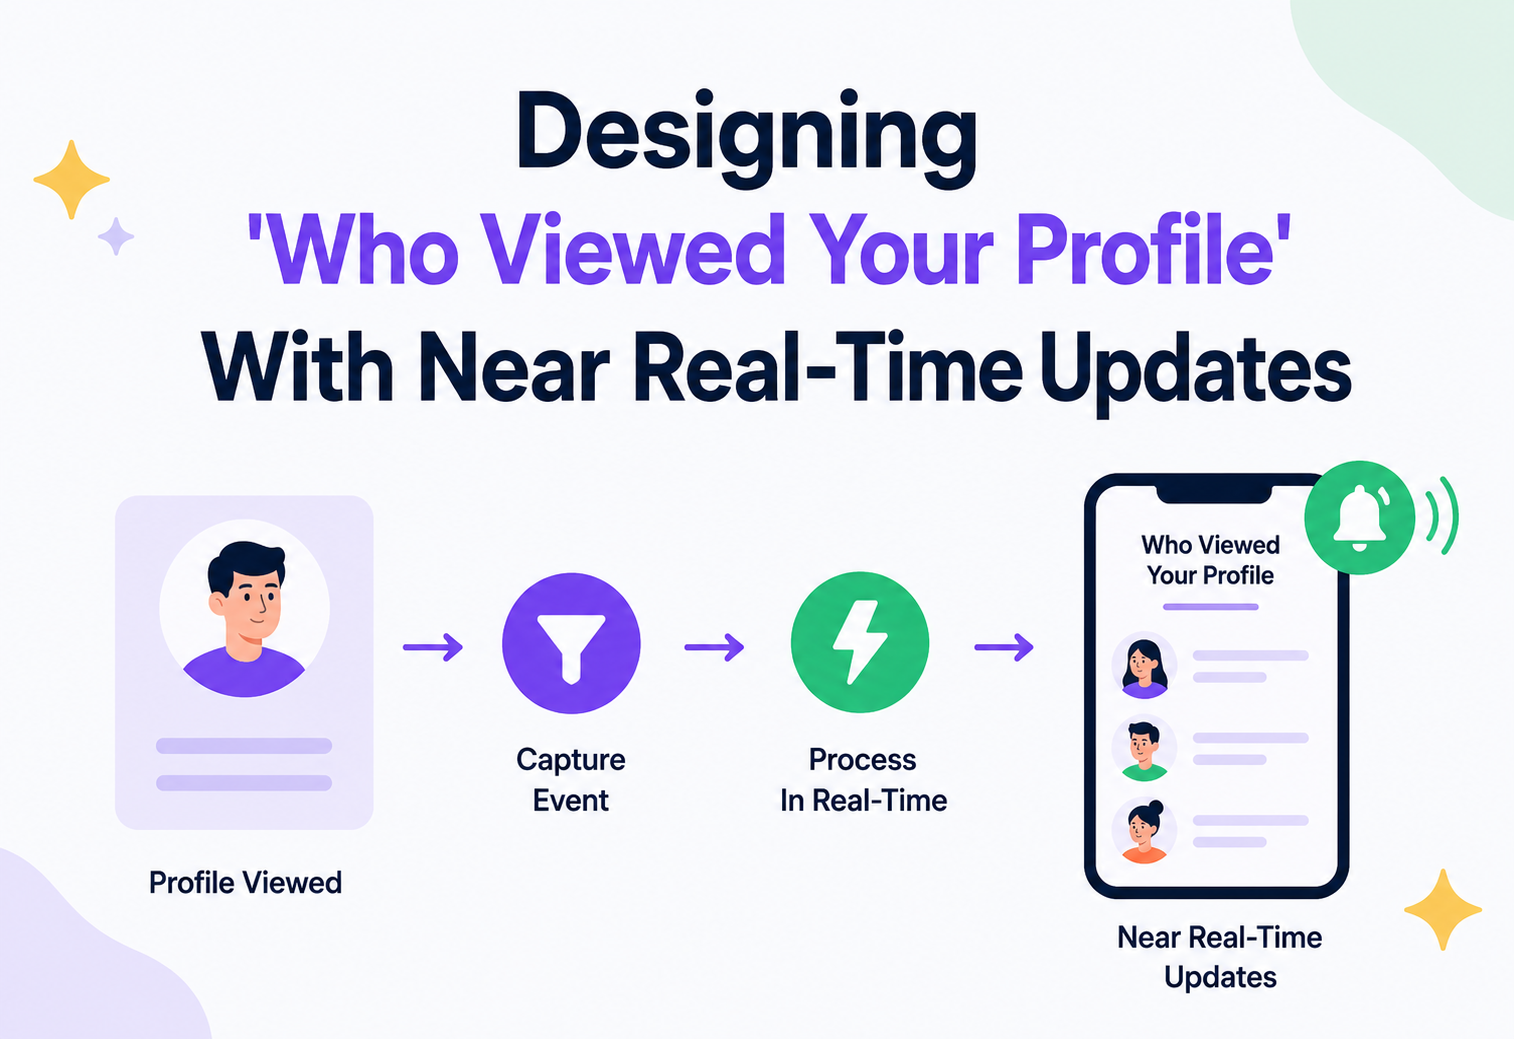
Designing “Who Viewed Your Profile” with near real-time updates
A full walkthrough of how professional networking platforms track, aggregate and surface profile-view activity — near-instantly, at hundreds of millions of users, without drowning the system in write traffic.
Introduction & History
If you have ever used a professional networking site, you have almost certainly seen a small panel that says something like “14 people viewed your profile this week”, sometimes with a partial or full list of who they were. It is a deceptively small-looking feature. It shows up as a single number and a short list. But behind that number sits a genuinely interesting distributed systems problem and it is a favorite in system design interviews because it forces a very different set of trade-offs than the more commonly discussed “feed” problems.
The feature itself traces back to the earliest professional networking platforms in the mid-2000s, where the core value proposition was less about entertainment and more about visibility — who is looking at my career profile and should I reach out to them? Unlike a social feed, where the content itself is the product, “who viewed your profile” is fundamentally a piece of meta-information about attention: it tells you not what happened, but who was paying attention to what happened to you. That distinction matters more than it first appears, because it changes almost every assumption about how the system should be built.
Over time, this feature has become a genuine business lever for these platforms too — many professional networks intentionally show only a partial view (say, the last five viewers) to free-tier users and unlock the full list only for paying subscribers. That single product decision — gating visibility rather than gating data collection — turns out to have a real influence on the storage design, which we will get into later in this tutorial.
The interesting engineering question, the one worth spending an entire design session on, is this: every single profile page load anywhere on the platform potentially generates a “view” event that needs to be recorded, deduplicated, attributed to the right viewer and eventually surfaced back to the person being viewed — ideally within seconds, not hours — at a scale where hundreds of millions of people are browsing constantly. That is a genuinely different shape of problem than a news feed and it rewards a different architecture.
“How is this problem different from designing a social media feed?” A strong answer identifies the core inversion early: in a feed, reads vastly outnumber writes (people scroll far more often than they post). In a profile-view system, the opposite is often true — nearly every page view is a write, while relatively few people check their “who viewed me” page on any given day. That inversion should visibly shape the whole design and noticing it early is exactly the kind of signal interviewers are listening for.
Problem & Motivation
Design a system that shows users who has viewed their profile, with near real-time updates, at the scale of a professional networking platform (hundreds of millions of users). Views should be captured accurately, deduplicated sensibly, respect viewer privacy preferences (anonymous browsing) and be surfaced back to the profile owner quickly — ideally within seconds for users who are currently active on the platform.
Let us break this into the sub-problems that actually make it hard, because “just log a row every time someone views a profile” sounds trivial until you consider the scale and the product requirements layered on top of it.
Sub-problem 1: write volume is enormous and constant
Every profile page load is a potential write. Unlike posting, which is a deliberate, relatively infrequent action, browsing profiles is a background activity that happens constantly as people search, network and research each other — recruiters searching candidates, salespeople researching prospects, job seekers researching companies and interviewers. This means the write path here needs to be treated with the same seriousness that a feed system gives its read path.
Sub-problem 2: not every view should count, or count the same way
If the same person refreshes your profile five times in ten minutes, should that count as five views? Almost certainly not — most real systems deduplicate views from the same viewer within some time window (commonly a day) so the count reflects distinct interest, not accidental refresh spam or bot activity. This deduplication has to happen at genuinely high throughput without becoming a bottleneck itself.
Sub-problem 3: near real-time delivery, without paying feed-scale fanout costs
The product wants the “someone viewed your profile” signal to feel fresh — ideally, if you are actively using the platform right now and someone views your profile, you would notice within seconds, the same way a chat message feels instant. But building a full fan-out pipeline for every single view, the way we did for posts in a news feed design, would be enormously wasteful here, because — unlike a post, which is meant for potentially thousands of followers — a profile view is meaningful to exactly one person: the profile owner. There is no fan-out audience to speak of. The challenge is delivering one lightweight signal to one specific person, quickly, at very high frequency, across the whole platform.
Sub-problem 4: privacy and tiered visibility are first-class requirements, not afterthoughts
Real platforms let viewers browse anonymously (their identity is hidden from the person they viewed, though the platform itself still needs to know who it was, for its own analytics and abuse detection) and many gate the full viewer list behind a paid tier. Both of these are product requirements that meaningfully shape the storage and access-control design — they cannot be bolted on as a UI-only restriction after the fact.
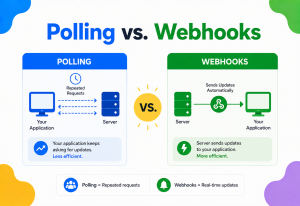
“Why cannot you just reuse a typical fan-out-on-write feed architecture here?” Because fan-out architectures are built to solve a one-to-many distribution problem — one post reaching many followers. A profile view is fundamentally a many-to-one signal — many possible viewers, but each individual view matters only to one specific recipient. Reusing feed-style fan-out here would be solving a distribution problem that does not actually exist in this domain, while missing the real challenges: extremely high write volume, deduplication and cheap, targeted, low-latency delivery to a single recipient.
Requirements & Capacity Estimation
Functional requirements
- Record a view every time User A visits User B’s profile.
- Deduplicate repeated views from the same viewer within a configurable time window (e.g., once per day counts as one view).
- Let profile owners see an aggregate count and a list of recent viewers, subject to their account tier.
- Let viewers opt into anonymous browsing, hiding their identity from the person they viewed.
- Deliver a near real-time notification to the profile owner if they are currently active on the platform.
- Provide approximate or exact view counts over multiple time windows (today, this week, this month, all-time).
Non-functional requirements
- Very high write throughput — the write path must absorb continuous, high-frequency profile-view events without becoming a bottleneck for the page loads that trigger them.
- Low write latency on the critical path — recording a view should never noticeably slow down the profile page itself loading for the viewer.
- Near real-time delivery — a few seconds of delay for an active user is the target; this is stricter than the “eventually, within a minute or two” tolerance we would accept in a typical feed system.
- Eventual consistency is fine for the aggregate count and viewer list — nobody notices or cares if a view takes a few extra seconds to appear in a list they are not actively watching.
- Strong privacy guarantees — anonymous viewers must never leak their identity through any observable side channel (timing, counters, error messages).
Back-of-the-envelope capacity estimation
Let us work through realistic numbers for a platform with 900 million total users and roughly 250 million daily active users (numbers broadly in the range professional networking platforms have publicly discussed).
250,000,000
Daily active users
6
Avg profile views per DAU per day
≈ 1.5 billion
Total view events per day
≈ 17,400 / sec
Average view events per second
≈ 70,000 / sec
Peak view events per second (business hours, ~4x)
Now the read side — how often does someone actually open their “who viewed my profile” page?
| Metric | Calculation | Result |
|---|---|---|
| Fraction of DAU checking the page per day | assume 8% | 20 million users/day |
| Average reads per second | 20,000,000 ÷ 86,400 | ≈ 230 reads/sec |
| Write : Read ratio | 17,400 : 230 | roughly 75 : 1 |
Compare this to a typical social feed, where reads outnumber writes by a similar or larger margin in the opposite direction. Here, writes outnumber reads by roughly 75 to 1. That single number should completely reshape our instincts: rather than optimizing to make every read as cheap as possible (which paid off enormously in a feed system), we should optimize primarily to make every write as cheap as possible and accept doing somewhat more work at read time, since reads are comparatively rare.
“Given this write-heavy ratio, would you still want to precompute and cache the viewer list the way a feed system precomputes feeds?” Not eagerly and not for every user. Precomputing an expensive, fully-materialized structure on every single view, for every profile — mirroring fan-out-on-write — would mean paying an expensive cost 75 times more often than necessary. A better approach appends cheaply to a lightweight structure at write time (an append-only log, or a capped list with an inexpensive insert) and defers heavier aggregation work — like computing exact distinct counts over various windows — to either read time or a periodic background batch job, since that work is only needed on the comparatively rare occasions someone actually looks.
High-Level Architecture & Components
With the write-heavy nature of this problem established, here is the overall shape of a system built to handle it well.
Notice the shape here is deliberately different from a feed system’s architecture: instead of one path optimized purely for reads, there are two parallel consumers of the same event stream, each solving a different half of the “near real-time” requirement.
View Capture Service
The service directly on the critical path of a profile page load. Its only job is to validate the view, run a fast deduplication check and publish an event — then respond immediately. It deliberately does none of the heavier aggregation or delivery work itself, keeping this hot path as thin as possible.
Dedup Cache
A fast, TTL-based cache (Redis, often backed by a Bloom filter for extra memory efficiency) that answers, in under a millisecond, “has this viewer already viewed this profile within the dedup window?” We will cover the exact mechanics in the next section.
Real-Time Notifier
Consumes view events and checks, via the Presence Service, whether the profile owner is currently connected (an open WebSocket or active session). If so, it pushes a lightweight notification directly through the WebSocket Gateway — no database round trip needed. If the owner is not online, this branch simply does nothing further; there is no point delivering a real-time signal to someone who is not there to receive it.
Aggregation Service
Consumes the same event stream and handles the “eventually consistent, but complete” side of the picture: appending to the durable view log, updating approximate distinct-viewer counters and maintaining a capped recent-viewers list — all work that can comfortably lag by a few seconds without anyone noticing.
Presence Service
Tracks which users currently have an active connection to the platform — the same kind of infrastructure that powers “online now” indicators in messaging products. This is what lets the Real-Time Notifier avoid wasted work delivering signals to offline users.
“Why have two separate consumers of the same event instead of one service doing everything?” Because the two jobs have genuinely different latency and durability requirements. Real-time delivery needs to be extremely fast but can tolerate being best-effort (missing a live toast is not a big deal if the owner sees the view in their list moments later). Aggregation needs to be reliable and complete, but has no strict latency requirement. Coupling them into one service would force the durable, reliable path to also be as fast as the best-effort path, or force the fast path to inherit unnecessary durability overhead — splitting them lets each optimize for what it actually needs.
View Capture & Deduplication
This is the part of the system that runs on every single profile page load across the platform, so every microsecond of latency here is multiplied by billions of daily executions. Let us look at it closely.
Two design choices here are worth calling out explicitly, because they are easy to get wrong.
Dedup happens before publishing, not after
It might seem simpler to publish every raw view event and let a downstream consumer deduplicate later. But that would mean paying the cost of a Kafka publish — and every downstream consumer processing that event — for views that ultimately do not count anyway. Filtering as early as possible, right at the point of capture, keeps every downstream system dealing only with events that actually matter, which meaningfully reduces total system load given how many raw page loads happen per genuinely new view.
The dedup check must be extremely fast and cheap, because it runs constantly
A plain Redis SET with a “set if not exists” semantic and a TTL handles the common case well, but at extreme scale, storing a full key per viewer-profile-day pair for hundreds of millions of daily events adds up in memory. A common optimization is a Bloom filter layered in front of the exact-check cache: a Bloom filter can answer “definitely not seen before” with certainty and “possibly seen before” probabilistically, using a small fraction of the memory an exact set would need. Since a false positive here just means occasionally, harmlessly skipping a legitimate view (a small, acceptable trade), while a false negative never happens by construction, this is a very natural place to use one.
// Deduplication check combining a Bloom filter (fast pre-filter)
// with an exact Redis check (authoritative for edge cases)
public class ViewDeduplicator {

    private final BloomFilter<String> bloomFilter; // in-memory, per-shard
    private final RedisClient redis;

    public boolean isNewView(String viewerId, String profileId) {
        String dedupKey = buildDedupKey(viewerId, profileId);

        // Fast path: Bloom filter says "definitely never seen" -> skip Redis entirely
        if (!bloomFilter.mightContain(dedupKey)) {
            bloomFilter.put(dedupKey);
            redis.set(dedupKey, "1", Duration.ofHours(24));
            return true;
        }

        // Bloom filter says "maybe seen" -> confirm with the authoritative cache
        Boolean exists = redis.exists(dedupKey);
        if (Boolean.TRUE.equals(exists)) {
            return false; // genuinely already viewed today
        }

        // Bloom filter false positive - not actually seen, record it now
        redis.set(dedupKey, "1", Duration.ofHours(24));
        return true;
    }

    private String buildDedupKey(String viewerId, String profileId) {
        String today = LocalDate.now(ZoneOffset.UTC).toString();
        return "dedup:" + viewerId + ":" + profileId + ":" + today;
    }
}
What happens when a viewer visits their own profile, or views it while impersonating another role
Self-views are filtered out entirely at the View Capture Service, before dedup even runs — a straightforward equality check between viewer ID and profile owner ID. Administrative or support-tool access to a profile (common on platforms where internal staff occasionally need to inspect a profile for moderation) is typically tagged with a distinct internal actor type and excluded from the viewer-facing count and list, since counting internal tooling access as a “someone viewed your profile” event would be both misleading and a subtle privacy concern.
“What is the actual risk of relying on a Bloom filter here and how would you size it?” The main risk is the false-positive rate climbing too high if the filter is undersized relative to the number of distinct keys it needs to track in a given window, which would cause the system to wrongly skip real views more often than acceptable. Sizing it correctly means picking the filter’s bit array size and hash function count based on the expected number of distinct viewer-profile pairs per day and an acceptable false-positive rate (commonly under 1%) and resizing or rotating the filter daily alongside the TTL window it mirrors.
Near-Real-Time Delivery: The Presence-Aware Path
This is the section that answers the “near real-time” part of the prompt most directly. The core insight is one we already flagged: a profile view only has one intended recipient and delivering a real-time signal only matters if that recipient is actually present to receive it. This lets us design something much lighter than a general-purpose fan-out pipeline.
Presence tracking
Whenever a user opens the app or website, their client opens a persistent connection — typically a WebSocket, sometimes a long-lived HTTP connection with server-sent events as a fallback — to a WebSocket Gateway layer. The Presence Service records, in a fast in-memory store (again, commonly Redis, keyed by user ID with a short TTL refreshed by periodic heartbeats), which gateway instance currently holds that user’s connection.
// Presence tracking - updated on connect, disconnect, and heartbeat
public class PresenceService {

    private final RedisClient redis;
    private static final Duration PRESENCE_TTL = Duration.ofSeconds(45);

    public void markOnline(String userId, String gatewayInstanceId) {
        redis.set("presence:" + userId, gatewayInstanceId, PRESENCE_TTL);
    }

    public void heartbeat(String userId) {
        redis.expire("presence:" + userId, PRESENCE_TTL); // refresh TTL only
    }

    public Optional<String> getGatewayFor(String userId) {
        String value = redis.get("presence:" + userId);
        return Optional.ofNullable(value);
    }

    public void markOffline(String userId) {
        redis.delete("presence:" + userId);
    }
}
The Real-Time Notifier’s decision logic
When a genuinely new (post-dedup) view event arrives, the Real-Time Notifier checks presence for the profile owner. If they are online, it looks up which specific gateway instance holds their connection and routes the notification there directly — a targeted, single-recipient push, not a broadcast. If they are offline, the notifier simply does nothing; the view is already safely recorded by the Aggregation Service and the owner will see it the next time they open the app, which is a perfectly acceptable outcome for someone who is not actively online right now.
public class RealTimeNotifier {

    private final PresenceService presenceService;
    private final WebSocketGatewayClient gatewayClient;

    public void handleViewEvent(ViewEvent event) {
        if (event.isAnonymousViewer()) {
            // We can still notify that "someone" viewed the profile
            // without exposing viewer identity in the push payload.
        }

        Optional<String> gatewayInstance = presenceService.getGatewayFor(event.getProfileOwnerId());
        if (gatewayInstance.isEmpty()) {
            return; // owner not online right now - skip, aggregation still handles it
        }

        NotificationPayload payload = buildPayload(event);
        gatewayClient.pushToUser(gatewayInstance.get(), event.getProfileOwnerId(), payload);
    }

    private NotificationPayload buildPayload(ViewEvent event) {
        String displayName = event.isAnonymousViewer() ? "Someone" : event.getViewerDisplayName();
        return new NotificationPayload(displayName, event.getTimestamp());
    }
}
Why this scales so much better than a general fan-out approach
Because the Real-Time Notifier’s work per event is O(1) — a single presence lookup and, at most, a single targeted push — its total cost scales linearly with the number of view events, with no multiplier for “number of recipients”, since there is always exactly one. This is a meaningfully cheaper shape than the feed fan-out problem, where a single event could fan out to millions of recipients; here, it is always exactly one recipient or zero (if offline), which keeps the real-time path lightweight even at tens of thousands of events per second.
Handling delivery gaps gracefully
WebSocket connections drop and reconnect constantly in real mobile network conditions. Because the real-time path is explicitly best-effort and the aggregation path is the durable source of truth, a missed real-time push is a minor, invisible product gap rather than a data-loss bug — the client simply fetches the current state (recent viewers, updated count) on reconnect or next page load, reconciling naturally with whatever the durable store shows by then.
This presence-aware, targeted-push pattern is the same fundamental approach messaging platforms like Slack and WhatsApp use for delivering “typing…” indicators and read receipts — signals that are only meaningful to a specific, small set of recipients, delivered instantly when they are online and gracefully skipped or caught up on reconnect when they are not.
“What happens if the WebSocket Gateway instance holding a user’s connection crashes?” The presence entry has a short TTL and is refreshed by regular heartbeats specifically so that a crashed gateway’s stale presence entries expire quickly rather than lingering and causing the Real-Time Notifier to keep trying to push to a dead connection. The client’s reconnect logic establishes a new connection to a healthy gateway instance, which updates presence again, restoring normal delivery within seconds.
Beyond the browser tab: mobile push notifications for offline users
Everything covered so far handles the case where a user is actively connected through a live WebSocket session. But a huge share of real-world usage happens on mobile devices where the app is not necessarily in the foreground, or is not open at all — “online” in the presence-tracking sense does not capture every situation where a timely notification would still be valuable. For this, the Real-Time Notifier’s presence check needs a second branch: if the user has no active WebSocket connection but has previously granted push notification permission on a mobile device, the notifier instead hands off to a separate Mobile Push Service (typically integrating with a platform push gateway) rather than simply giving up.
This introduces its own design consideration worth being explicit about: mobile push notifications are meaningfully more expensive and higher-friction than an in-app WebSocket push — they interrupt the user outside the app entirely, so sending one for every single deduplicated view (recall, still potentially dozens per day for an active professional) would quickly become noisy and annoying rather than delightful. Production systems typically apply a separate, coarser rate limit specifically to the mobile push channel — for example, at most one push notification per profile owner per rolling several-hour window, batching multiple views that occurred in that window into a single “3 people viewed your profile” push rather than sending one push per view.
// Deciding between in-app real-time push and batched mobile push
public class NotificationRouter {

    private final PresenceService presenceService;
    private final WebSocketGatewayClient wsClient;
    private final MobilePushService pushService;
    private final RedisClient redis;

    private static final Duration PUSH_BATCH_WINDOW = Duration.ofHours(3);

    public void routeNotification(ViewEvent event) {
        String ownerId = event.getProfileOwnerId();

        Optional<String> gateway = presenceService.getGatewayFor(ownerId);
        if (gateway.isPresent()) {
            wsClient.pushToUser(gateway.get(), ownerId, buildPayload(event));
            return; // in-app delivery handled the case, no need for mobile push
        }

        if (!pushService.hasPushPermission(ownerId)) {
            return; // nothing more we can do for this offline, non-opted-in user
        }

        // Batch: increment a pending count, only actually send a push
        // if one hasn't gone out for this user within the batch window.
        String batchKey = "push_pending:" + ownerId;
        long pendingCount = redis.incr(batchKey);
        redis.expire(batchKey, PUSH_BATCH_WINDOW);

        String lockKey = "push_sent_recently:" + ownerId;
        boolean alreadySentRecently = Boolean.TRUE.equals(redis.exists(lockKey));
        if (!alreadySentRecently) {
            pushService.send(ownerId, buildBatchedMessage(pendingCount));
            redis.set(lockKey, "1", PUSH_BATCH_WINDOW);
            redis.delete(batchKey); // reset the pending counter after sending
        }
    }

    private String buildBatchedMessage(long pendingCount) {
        return pendingCount == 1
            ? "Someone viewed your profile"
            : pendingCount + " people viewed your profile recently";
    }
}
This batching logic is a good illustration of a broader principle worth internalizing: “near real-time” does not have to mean “immediately, every single time, on every channel”. It means matching the delivery mechanism’s cost and intrusiveness to the channel — instant and unbatched for a low-cost, already-open in-app connection; deliberately throttled and batched for a higher-cost, attention-interrupting mobile push — while still keeping the underlying data (the durable log, the recent-viewers list, the approximate counters) fully accurate and complete regardless of which delivery path was taken.
“How would you decide the right batching window for mobile push and could it be personalized?” Start with a reasonable platform-wide default informed by user research and support-ticket or opt-out-rate feedback (a window so short it feels spammy will show up quickly in disable-notification rates), then consider making it adjustable — either as an explicit user setting, or adaptively, shortening the window for users who rarely receive views and lengthening it for unusually popular profiles where an unbatched approach would otherwise generate a notification every few minutes.
Aggregation & Approximate Counting
The Real-Time Notifier handles the “instant” half of the requirement. The Aggregation Service handles the “complete and queryable” half — building the actual view count and recent-viewer list that a user sees when they open their “who viewed my profile” page.
Why exact counting gets expensive at this scale
Naively, “how many distinct people viewed my profile this month” sounds like it just needs a COUNT(DISTINCT viewer_id) query. But maintaining an exact distinct count, updated continuously, for hundreds of millions of profiles, across multiple overlapping time windows (today, this week, this month, all-time) means storing and updating a potentially large set of viewer IDs per profile per window — a genuinely significant amount of memory and computation, multiplied across every profile on the platform.
HyperLogLog — approximate cardinality at a fraction of the cost
HyperLogLog (HLL) is a probabilistic data structure specifically designed to estimate the number of distinct elements in a set, using a tiny, fixed amount of memory (commonly just a few kilobytes) regardless of whether the true count is in the hundreds or the hundreds of millions — trading a small, well-understood margin of error (typically under 1-2%) for an enormous reduction in memory compared to storing the actual set. This is exactly the right trade for a “your profile was viewed approximately 1,240 times this month” style display, where a user would never notice or care about a 1% margin of error, but would absolutely notice if the feature was slow or the platform ran out of memory tracking exact sets for every profile.
// Using Redis's built-in HyperLogLog commands (PFADD / PFCOUNT)
// to maintain an approximate distinct-viewer count per time window
public class ApproxViewCounter {

    private final RedisClient redis;

    public void recordView(String profileId, String viewerId, LocalDate date) {
        redis.pfadd(dailyKey(profileId, date), viewerId);
        redis.pfadd(weeklyKey(profileId, date), viewerId);
        redis.pfadd(monthlyKey(profileId, date), viewerId);
        redis.pfadd(allTimeKey(profileId), viewerId);
    }

    public long getApproxCount(String profileId, TimeWindow window) {
        String key = switch (window) {
            case TODAY -> dailyKey(profileId, LocalDate.now());
            case WEEK -> weeklyKey(profileId, LocalDate.now());
            case MONTH -> monthlyKey(profileId, LocalDate.now());
            case ALL_TIME -> allTimeKey(profileId);
        };
        return redis.pfcount(key); // O(1)-ish, approximate cardinality
    }

    // Redis also supports PFMERGE to combine HLLs, e.g. merging
    // several daily HLLs together to answer a weekly query without
    // re-processing every individual raw view event.
    private String weeklyKey(String profileId, LocalDate date) {
        return "hll:week:" + profileId + ":" + date.get(WeekFields.ISO.weekOfWeekBasedYear());
    }

    private String dailyKey(String profileId, LocalDate date) { return "hll:day:" + profileId + ":" + date; }
    private String monthlyKey(String profileId, LocalDate date) { return "hll:month:" + profileId + ":" + date.getMonthValue(); }
    private String allTimeKey(String profileId) { return "hll:all:" + profileId; }
}
The recent-viewers list — a different, exact structure for a different purpose
The approximate count answers “roughly how many”, but the product also needs an exact, ordered list of the most recent actual viewers (names, headlines, timestamps) to display. This is handled separately with a simple capped list — a Redis list or sorted set holding, say, the most recent 100 viewer entries per profile, trimmed on every insert exactly the way the feed cache was trimmed in a news-feed design. This list is small, exact and cheap to maintain, precisely because it is bounded rather than trying to represent the entire history.
public class RecentViewersStore {

    private static final int MAX_RECENT = 100;
    private final RedisClient redis;

    public void addViewer(String profileId, String viewerId, long timestamp, boolean anonymous) {
        String key = "recent_viewers:" + profileId;
        String entry = anonymous ? "anon:" + timestamp : viewerId + ":" + timestamp;
        redis.zadd(key, timestamp, entry);
        redis.zremrangeByRank(key, 0, -MAX_RECENT - 1); // keep only most recent 100
    }

    public List<String> getRecentViewers(String profileId, int limit) {
        return redis.zrevrange("recent_viewers:" + profileId, 0, limit - 1);
    }
}
Tiered access is enforced at read time, not at write/storage time
Here is the product-driven design decision flagged earlier: the system stores the full recent-viewers list and full counts for every user, regardless of subscription tier. Access restrictions — showing a free-tier user only their most recent 5 viewers, while a premium user sees all 100 — are enforced entirely in the Profile Views Read Service, at query time, by simply truncating the result based on the requester’s current tier. This means upgrading from free to premium requires zero backfill or data migration — the full history was there all along, simply gated by a business-logic check, not by what was physically stored.
“Is not it risky to store full viewer data for free-tier users if they are not supposed to see it?” It is a deliberate and common trade-off, not an oversight — it dramatically simplifies the storage and upgrade-path logic at the cost of needing airtight access control at the read layer, since a bug there could leak data the product intends to gate. A reasonable answer acknowledges this and points out the alternative — physically withholding data until upgrade — would need a complex backfill process on every plan change, which is worse from an engineering-complexity standpoint for a gain in security that is better achieved through correct authorization checks instead.
Data Flow & Lifecycle of a Profile View
Tracing one view from the moment it happens to the moment it is fully settled into durable storage helps make the whole pipeline concrete.

Stage 1 — Page load triggers capture
A viewer’s client requests a profile page. As part of rendering that request (or via a lightweight beacon fired just after render, so it never blocks the page itself), the client signals the View Capture Service with the viewer and profile owner IDs.
Stage 2 — Deduplication check
The Bloom filter and Redis dedup check run, as covered earlier. If this viewer already viewed this profile today, processing stops here — no event is published and no further system does any work at all for this particular page load.
Stage 3 — Event published, response returned
For a genuinely new view, an event is published to the Kafka topic and the View Capture Service returns success immediately, without waiting for anything downstream — the viewer’s page load is never held up by what happens next.
Stage 4a — Real-time branch
In parallel, the Real-Time Notifier consumes the event, checks presence and — if the profile owner is online — pushes an instant notification through their active WebSocket connection, typically landing within one to two seconds of the original page load.
Stage 4b — Aggregation branch
Simultaneously, the Aggregation Service consumes the same event, appends a permanent record to the durable view log (for audit, analytics and exact historical queries), updates the relevant HyperLogLog counters for today/week/month/all-time and updates the capped recent-viewers list.
Stage 5 — Read time
When the profile owner eventually opens their “who viewed my profile” page (whether seconds or days later), the Profile Views Read Service fetches the approximate counts and the recent-viewers list, applies tier-based truncation, resolves anonymous entries to a generic display and returns the assembled result.
Stage 6 — Aging and retention
The durable view log is retained according to the platform’s data retention policy (often bounded by privacy regulation requirements, discussed further in the security section), while the lightweight recent-viewers list and HLL counters persist indefinitely at negligible cost, since they are both bounded in size regardless of how much raw history accumulates behind them.
“At what stage would a user actually see the ‘someone viewed your profile’ toast, versus seeing it appear in their list?” The toast arrives via Stage 4a, typically within a couple of seconds, but only if the owner is online at that moment. The entry appearing correctly in the recent-viewers list and count, guaranteed regardless of whether the owner was online at the time, comes from Stage 4b, which usually completes within a similar few-second window but does not depend on anyone being actively connected — it is the durable, always-eventually-correct path underneath the best-effort real-time layer.
Data Model & Storage Schema
Why the view log is partitioned by profile_owner_id, not viewer_id
The dominant read pattern is “show me who viewed my profile” — a query scoped to a single owner. Partitioning primarily by profile_owner_id keeps all of one person’s incoming view records physically together, making that lookup a single-partition query rather than a scatter-gather across the whole cluster, mirroring the same reasoning used for author-based partitioning in a content-feed system, just with the roles reversed — here the “owner” of the data is the one being viewed, not the one producing content.
Storing the anonymous flag without leaking identity downstream
A subtle but important schema decision: the view log still stores the real viewer_id even for anonymous views, because the platform itself needs that information for its own abuse detection, analytics and legal/regulatory obligations. The anonymous flag is what tells every downstream consumer — the Real-Time Notifier, the Read Service — to mask the identity before it ever reaches the profile owner’s screen. The distinction between “the platform does not know” and “the platform knows but will not show the other user” matters enormously here and getting it right is what makes the anonymous browsing feature actually trustworthy rather than just obscured.
Time-bucketing for efficient range queries
Within a given owner’s partition, view events are further ordered by a time-sortable event ID (the same Snowflake-style approach useful in a feed system works well here too), so that “views from the last 7 days” is a simple, efficient range scan rather than requiring a full scan filtered afterward.
“If a viewer deletes their account, what has to happen to the view events they generated?” The raw view log entries referencing that viewer_id need to be handled according to the platform’s data deletion policy — typically either fully deleted or anonymized (replacing the viewer_id with a generic deleted-user placeholder) within a required timeframe. Because the HyperLogLog counters and recent-viewers list were built incrementally from these events rather than by re-deriving from the log on every read, deleting the underlying log entry does not automatically update those already-computed aggregates — this is a genuine data lifecycle challenge worth mentioning explicitly rather than glossing over, since HLL structures in particular do not support removing an element after it has been added.
Databases Deep Dive
| Data | Store type | Why |
|---|---|---|
| Durable view log | Wide-column NoSQL (Cassandra / ScyllaDB) | Extremely high append-only write throughput, partitioned by profile_owner_id, tunable consistency for eventual reads |
| Dedup keys | Redis, with TTL | Needs sub-millisecond existence checks at very high frequency; data is inherently short-lived, so an in-memory store with automatic expiry fits perfectly |
| Approximate counters | Redis (HyperLogLog data structures) | Fixed, tiny memory footprint per profile regardless of true cardinality; native PFADD/PFCOUNT/PFMERGE support |
| Recent viewers list | Redis (sorted sets) | Naturally ordered, capped structure; O(log N) insert and trim |
| Presence data | Redis, with short TTL | Needs to expire automatically if a heartbeat stops arriving, without requiring an explicit cleanup job |
| User & account tier data | Relational DB (sharded) | Strong consistency valuable for account and billing-adjacent data |
Why an append-only log fits the durable storage layer so well
The durable view log is written far more often than it is read in full (recall the roughly 75:1 write-to-read ratio) and it is almost never updated or deleted individually — only ever appended to and occasionally bulk-processed for retention cleanup. This access pattern is exactly what wide-column, append-optimized stores like Cassandra are built for: sequential writes distributed across a partition key, with compaction handling the underlying storage efficiency in the background rather than requiring expensive in-place updates the way a heavily-indexed relational table would.
Why Redis carries so much of the real-time weight here
Nearly every fast-path structure in this design — dedup keys, HLL counters, recent-viewer lists, presence data — lives in Redis and that is not a coincidence. All four share a common shape: they need to be read and written extremely frequently, they tolerate a small amount of imprecision or staleness and none of them require the complex query flexibility a relational or even a wide-column store offers. An in-memory key-value store with rich built-in data structures (sorted sets, HyperLogLog, simple TTL-based expiry) is close to a perfect fit for all four at once, which is why a single well-operated Redis cluster (sharded, as we will cover shortly) can carry most of this system’s real-time load.
“Redis is in-memory — what happens to all this real-time state if a Redis node crashes?” Redis supports persistence options (RDB snapshots and/or an append-only file) and replication, so a well-configured cluster can recover most state after a crash with only a small window of potential loss. Critically, none of the data living in Redis here is the sole source of truth — the durable view log in Cassandra is — so even in a worst-case scenario where some Redis-held state is lost (a few recent dedup keys, a slightly stale HLL count), the system can be repaired from the durable log rather than losing information permanently.
Caching Strategy
Given the write-heavy ratio established earlier, caching in this system plays a somewhat different role than in a read-heavy feed system — it is less about avoiding repeated expensive reads and more about giving fast, cheap structures to absorb extremely frequent writes without ever touching a heavier durable store on the hot path.
Write-side caching (the dominant concern here)
Every structure discussed so far — dedup keys, HLL counters, recent-viewer lists, presence — is really a form of write-side caching: cheap, in-memory structures that absorb the enormous write volume directly, with the durable Cassandra log receiving writes asynchronously via the Aggregation Service rather than synchronously on every page load. This inverts the usual “cache to avoid hitting the database on reads” framing into “use fast in-memory structures to avoid hitting the durable store synchronously on writes”, which is the right framing for a write-dominated workload.
Read-side caching for the profile-views page itself
Since only a modest fraction of users check their “who viewed my profile” page on a given day and the underlying data (HLL counters, recent-viewer list) is already served from fast in-memory Redis structures directly, there is less need for an additional caching layer purely for read speed here — the “source” data for reads is already about as fast as a cache would be. Where caching still helps is at the hydration step: turning viewer IDs in the recent-viewers list into full display objects (name, headline, profile photo URL) benefits from a standard cache-aside pattern against the user profile store, exactly as content hydration worked in a feed system’s read path.
Cache warming for high-profile accounts
Certain accounts — company pages, highly connected individuals, recruiters actively sourcing — receive disproportionately more views than average, similar in spirit to the celebrity-account skew in a content feed, just showing up here as write skew rather than fan-out skew. For these accounts, keeping their dedup keys, HLL structures and recent-viewer lists on dedicated, well-provisioned cache shards (rather than sharing capacity with typical-traffic profiles) prevents their disproportionate write volume from degrading performance for everyone else sharing the same cache infrastructure.
“Since this system is write-heavy, does caching even matter as much here as it does in a read-heavy system?” It matters just as much, but for a different reason — instead of caching to avoid repeated expensive reads, the fast in-memory structures here exist to avoid making every single write synchronously touch a slower durable store. The underlying principle is the same either way: identify the operation that happens most often (writes here, reads in a feed system) and build the cheapest possible structure specifically to absorb that dominant operation.
Sharding & Load Balancing
The same consistent hashing approach discussed in general system design applies directly here, with profile_owner_id (rather than an author ID) as the natural partition key across Redis, Cassandra and the Kafka topic itself.
Partitioning the Kafka topic
The profile.viewed Kafka topic is partitioned, typically by profile_owner_id, so that all events for a given profile owner land on the same partition, in order — this matters because the Aggregation Service benefits from processing a given owner’s events in the order they occurred, particularly for maintaining a correctly ordered recent-viewers list. Consumer instances of the Real-Time Notifier and Aggregation Service each own a subset of partitions, scaling horizontally as topic throughput grows.
Sharding the dedup and presence caches
Redis Cluster (or a client-side consistent hashing layer in front of several Redis instances) distributes dedup keys and presence entries across shards by key hash, exactly following the consistent hashing pattern with virtual nodes covered in general sharding discussions — this evenly spreads the extremely high write volume of dedup checks and presence heartbeats across many machines rather than concentrating it on one.
Load balancing the WebSocket Gateway layer
Unlike stateless API services, WebSocket connections are inherently sticky — once a client connects to a specific gateway instance, that connection stays open for the session’s duration. Load balancing here happens primarily at connection time (routing a new connection to whichever gateway instance currently has the most available capacity) and the Presence Service is what lets other services find the right already-established connection later, rather than needing to load-balance individual messages after the fact.
“What happens to in-flight real-time delivery if you need to rebalance Kafka partitions across consumer instances?” Kafka consumer groups handle this natively through a rebalance protocol — partitions are reassigned among available consumers and processing resumes from the last committed offset. Because the Real-Time Notifier’s work is explicitly best-effort and short-lived (a missed real-time push is recoverable via the durable aggregation path), a brief rebalance-triggered pause in real-time delivery is a minor, acceptable blip rather than a correctness problem.
APIs & Microservices Design
| Endpoint | Method | Purpose |
|---|---|---|
/v1/profiles/{profileId}/views | POST (internal, called on page load) | Record a profile view |
/v1/me/profile-views | GET | Fetch the caller’s own aggregate count and recent-viewer list, tier-gated |
/v1/me/profile-views/settings | PUT | Toggle anonymous browsing preference |
/v1/realtime/connect | WebSocket upgrade | Establish the persistent connection used for live notifications |
GET /v1/me/profile-views?window=week HTTP/1.1
Authorization: Bearer <token>

Response 200 OK:
{
  "approxViewCount": 214,
  "window": "week",
  "recentViewers": [
    { "displayName": "Someone", "anonymous": true, "viewedAt": "2026-07-25T14:02:00Z" },
    { "displayName": "Priya Nair", "headline": "Engineering Manager at Acme", "anonymous": false, "viewedAt": "2026-07-25T11:47:00Z" }
  ],
  "visibleCount": 5,
  "totalCount": 214,
  "upgradeRequiredForFullList": true
}
Notice the response includes both visibleCount (how many entries the caller’s tier allows them to see) and totalCount (the true total), alongside an explicit upgradeRequiredForFullList flag — this makes the tiered-access business logic explicit and inspectable in the API contract itself, rather than silently truncating data with no indication that more exists.
Why the write endpoint is intentionally internal, not client-triggered directly
Rather than having the client explicitly call a “record my view” API (which would be easy to spoof or replay), the view-recording call is typically triggered server-side, as part of the same request that serves the profile page itself, using a signed, short-lived context the server already trusts. This closes off an obvious abuse vector — a malicious client repeatedly calling a public “record view” endpoint to inflate someone’s view count artificially.
Microservice boundaries reflect the two distinct latency requirements
Just as the architecture section split real-time delivery from aggregation, the service boundaries mirror that split directly: the View Capture Service and Real-Time Notifier are optimized purely for speed and can be scaled and deployed independently from the Aggregation Service and Profile Views Read Service, which are optimized for correctness and completeness instead. This separation means a slowdown or bug in the aggregation pipeline never risks delaying the page-load-critical view capture path.
“How would you prevent someone from scripting repeated profile visits to artificially inflate their own view count, or someone else’s?” Beyond the daily per-viewer dedup already in place, rate limiting at the API Gateway (per viewer and per IP) catches high-frequency scripted access and anomaly detection on view patterns — a huge burst of distinct-looking but suspiciously coordinated viewer IDs hitting one profile — can flag likely manipulation for review, similar in spirit to bot and click-fraud detection used elsewhere in the industry.
Design Patterns & Anti-patterns
Patterns worth naming explicitly
Event-driven fan-out into specialized consumers
One event, two independent consumers, each optimized for a different requirement (speed versus completeness) — a direct application of the same event-driven thinking used elsewhere in distributed systems, applied to a one-to-one delivery problem rather than a one-to-many one.
Probabilistic data structures for approximate answers
Both the Bloom filter (dedup pre-check) and HyperLogLog (distinct counting) trade a small, bounded amount of accuracy for a large reduction in memory and computation — a genuinely important pattern whenever “roughly right, cheap” beats “exactly right, expensive” for the product’s actual needs.
Presence-aware targeted delivery
Checking whether a recipient is actually reachable before doing delivery work avoids wasted effort — a pattern equally applicable to push notifications, live collaboration cursors and typing indicators.
Read-time authorization over write-time restriction
Enforcing the tiered-access business rule at query time rather than restricting what is stored keeps the storage and upgrade-path logic simple, at the cost of needing rigorous authorization checks at the read boundary.
Anti-patterns to avoid
Treating this like a fan-out feed problem
Building full fan-out infrastructure for a one-to-one signal wastes enormous engineering effort solving a distribution problem that does not exist here.
Doing dedup after publishing rather than before
Publishing every raw view and deduplicating downstream means every consumer — and the queue itself — pays for noise that could have been filtered out at the source almost for free.
Storing exact distinct-viewer sets per profile per time window
This looks correct on a whiteboard but becomes a genuinely serious memory and computation problem at hundreds of millions of profiles; approximate counting exists precisely to avoid this trap.
Coupling real-time delivery latency to durable storage latency
Forcing the fast, best-effort push to wait on a durable write to Cassandra reintroduces exactly the kind of unnecessary latency this whole architecture is designed to avoid.
Gating data at write time instead of read time for tiered features
Physically withholding data from free-tier users, rather than simply not showing it, creates a painful backfill problem the moment someone upgrades their subscription.
“If you had already built this system as a straightforward fan-out-style architecture and realized the mistake, how would you migrate it safely?” Introduce the presence-aware real-time path and the approximate-counting aggregation path as new consumers running in parallel with the existing pipeline first, validate their output matches expectations against real production traffic, then gradually shift read traffic to the new Read Service behind a feature flag and only decommission the old fan-out-style write path once the new one has proven itself under real load — the same safe, gradual migration discipline that applies to any significant architectural change in a live system.
Advantages, Disadvantages & Trade-offs
| Decision | Advantages | Disadvantages |
|---|---|---|
| Dedup before publish | Keeps queue and downstream systems free of noise; reduces total system load significantly | Adds a synchronous cache check to the hot write path, however fast |
| Approximate counting (HyperLogLog) | Tiny, fixed memory footprint regardless of true scale; fast merges across time windows | Small, bounded inaccuracy; does not support element removal, complicating deletion/right-to-be-forgotten requests |
| Presence-aware real-time delivery | Avoids wasted work for offline recipients; scales linearly with events, not with any fan-out multiplier | Best-effort only — genuinely offline-then-just-missed-it edge cases rely entirely on the aggregation path catching up |
| Read-time tier gating | Simple upgrade path; no backfill needed on plan changes | Requires strict, well-tested authorization logic at every read boundary to avoid leaking gated data |
The overarching trade-off, worth stating plainly: this design accepts a small amount of imprecision (approximate counts, best-effort real-time delivery) everywhere it does not materially affect the user’s actual experience, specifically to buy back the throughput and simplicity needed to survive a write volume that would make an exact, always-synchronous approach impractical at this scale.
“Is there any part of this system where you would insist on exact rather than approximate data, even at extra cost?” The durable view log itself should remain exact and complete — it is the audit trail used for legal/regulatory requests, abuse investigation and as the ultimate source of truth if any approximate structure needs to be rebuilt. Approximation is the right choice for user-facing aggregates and delivery, but the underlying record of what actually happened should stay precise.
A trade-off that is easy to overlook: engineering complexity versus a simpler, less scalable design
Every decision covered in this tutorial — probabilistic counting, presence-aware delivery, split real-time and aggregation pipelines — adds genuine engineering and operational complexity compared to a much simpler design: one relational table, one straightforward query, computed fresh every time someone opens their viewer list. For a platform at the scale described in the prompt, that complexity is a worthwhile, necessary trade. But it is worth being honest, in an interview or in real engineering practice, that this complexity has ongoing costs beyond the initial build: more moving pieces to monitor, more failure modes to reason about, more onboarding effort for new engineers joining the team and more surface area where subtle bugs (an HLL precision misconfiguration, a presence TTL that is slightly too short, a dedup window that does not quite match product expectations) can hide. A mature engineering answer does not just justify the complexity by pointing at the scale requirement — it also acknowledges that this complexity needs to be actively managed through good documentation, strong observability (as covered in this tutorial’s monitoring section) and a genuine, ongoing willingness to simplify or consolidate components later if actual production experience reveals that some of the sophistication built in up front turned out to be unnecessary for how the system is actually used in practice.
Performance & Scalability
Keeping the hot path thin above everything else
Every millisecond added to the View Capture Service’s critical path is multiplied across roughly 70,000 events per second at peak. This is why the dedup check uses the fastest available structures (Bloom filter, then Redis), why event publishing is fire-and-forget rather than waiting for downstream acknowledgment and why literally everything else — real-time delivery, aggregation, counting — happens after the response has already been returned to the viewer.
Horizontal scaling across the pipeline
Every component here scales horizontally in the same way discussed for general distributed systems: more Kafka partitions and consumer instances as event volume grows, more Redis shards as dedup and presence key volume grows, more Cassandra nodes as the durable log grows. Because the partition key (profile_owner_id) is consistent across nearly every layer, scaling decisions can be made somewhat independently per layer without cross-cutting redesign.
Batching HLL updates for extremely popular profiles
For the small number of profiles receiving disproportionately high view volume, individual PFADD calls for every single view can still add up. A common optimization batches HLL updates for a given profile over a short window (a few hundred milliseconds) into a single pipelined Redis call, trading a tiny amount of additional latency in the aggregation path — which, recall, already tolerates a few seconds of lag — for a meaningful reduction in per-operation overhead during traffic spikes.
Why this system’s scaling story looks different from a feed system’s
A feed system scales primarily by making reads cheaper (caching, precomputation) because reads dominate. This system scales primarily by making the already-cheap write path even cheaper and by keeping the (comparatively rare) read path merely “fast enough” rather than needing extreme optimization, since it is exercised far less often. Recognizing which side of the read/write ratio actually needs the optimization budget is the single most important scaling decision in either design.
“If profile-view traffic tripled overnight — say, due to a viral hiring event on the platform — what would you scale first?” The write-path components: additional Kafka partitions and broker capacity, additional Redis shards for dedup and HLL counters and more View Capture Service instances behind the load balancer. The read path (Profile Views Read Service) would likely need proportionally less additional capacity, since read volume does not scale in lockstep with view volume — most of the extra views would not be checked by their recipients nearly as quickly as they occurred.
High Availability, Reliability & the CAP Theorem
Where this system sits on the CAP spectrum
Nearly everything in this design favors availability and partition tolerance over strict consistency — the same AP-leaning stance that fits most consumer-facing social and professional platforms. A view arriving a few seconds late, a count that is briefly a fraction behind reality, a real-time push that gets missed and caught up later — none of these matter enough to justify sacrificing availability for stronger consistency guarantees.
The one place strong-ish consistency genuinely matters: dedup correctness
It is worth being precise about an important nuance here. While the overall system favors availability, the dedup check itself benefits from at least session-level consistency — if two near-simultaneous requests for the same viewer-profile pair could both read “not yet viewed” before either write completes, that viewer could be double-counted. In practice, routing all dedup checks for a given key to the same Redis shard (a natural consequence of key-based partitioning) and relying on Redis’s single-threaded command processing per shard gives us this consistency for free at the individual-key level, without needing distributed consensus — a good example of how careful data modeling can sidestep the need for heavier consistency machinery.
Replication and failure recovery
Cassandra’s replication factor and quorum-based reads/writes (as discussed generally in distributed storage design) apply directly to the durable view log here, giving it the same resilience against individual node failures. Redis Cluster’s replication (each shard backed by one or more replicas) similarly protects the fast-path structures, with automatic failover promoting a replica to primary if the original primary becomes unreachable.
Graceful degradation under partial failure
- If the Real-Time Notifier or WebSocket Gateway is degraded, views are still safely recorded by the Aggregation Service — users simply do not get the live toast until they next open the app.
- If the Aggregation Service is degraded, the durable log in Kafka retains the events (a message queue naturally buffers backpressure, as discussed in general architecture principles) and aggregation catches up once the service recovers — no view is silently lost.
- If the dedup cache is briefly unavailable, a conservative fallback is to allow the view through rather than block it (occasionally over-counting a view is a far smaller product problem than dropping page loads entirely), logging the anomaly for later reconciliation.
“You mentioned the dedup check needs stronger consistency at the key level — does not that contradict the system’s overall AP-leaning design?” Not really — it shows that “favor availability” is a system-wide default, not a rule applied uniformly to every individual operation without exception. The dedup check achieves its correctness through careful key-based routing to a single authoritative shard, rather than by sacrificing availability elsewhere; the rest of the system remains free to lean AP because dedup correctness at the single-key level does not require coordinating across the whole cluster.
Security & Privacy
Privacy is not a side concern for this particular feature — it is arguably the central design constraint, since the entire product is built around telling one person about another person’s behavior, which is exactly the kind of feature that can go wrong in ways that damage user trust badly if handled carelessly.
Anonymous browsing, done correctly
As covered in the data model section, the platform always knows who actually viewed a profile — the anonymity is a display-layer promise to the viewer, not a data-collection opt-out. It is critical that this masking happens consistently across every surface: the real-time push notification, the recent-viewers list, any exported or downloadable report a premium user might request. A single surface that accidentally reveals a supposedly anonymous viewer’s identity — say, through a poorly considered analytics export feature — undermines the entire privacy guarantee.

Protecting against side-channel identity leaks
Even with names hidden, subtler leaks are possible: if a profile owner can see the exact headline, company and location of an “anonymous” viewer, that is often enough information to identify a specific person in a small enough professional circle. Real systems typically limit how much detail is shown for anonymous entries — commonly just “Someone” with perhaps a very broad category (industry, not company) — precisely to avoid this kind of re-identification risk.
Authentication & authorization
Standard token-based authentication at the API Gateway applies here as it does throughout any platform. The specific authorization rule unique to this feature is the tier-based truncation discussed earlier — the Profile Views Read Service must check the requesting user’s current subscription tier on every single request, since tier status can change at any time (a subscription can lapse) and caching stale tier information could either wrongly grant or wrongly deny access to the full list.
Data retention and regulatory compliance
Because view events constitute personal data about both the viewer and the profile owner, retention policy needs to account for data protection regulations (such as GDPR in the EU or similar frameworks elsewhere) that grant individuals rights to request deletion of data about them. This is precisely why the earlier discussion about HyperLogLog not supporting element removal matters practically — a genuine deletion request may require either accepting a small, documented inaccuracy in historical aggregates, or maintaining enough auxiliary information to allow a full recomputation of affected aggregates from the durable log when required.
Abuse prevention specific to this feature
Beyond general rate limiting, this feature has a distinctive abuse vector: “view farming”, where an account or automated script deliberately generates large volumes of profile views — sometimes as part of a marketing or sales-prospecting scheme, sometimes maliciously to make a target user’s viewer list noisy or misleading. Anomaly detection on view velocity (per viewer and per profile), combined with basic bot-detection signals already used elsewhere on the platform (unusual request patterns, missing typical client fingerprints), helps flag and throttle this kind of activity.
“A regulator requires you to fully delete a user’s view history within 30 days of a deletion request — walk through what actually needs to happen.” Delete or anonymize their view_id entries in the durable Cassandra log (as both viewer and, if they had a profile, as an owner). For HyperLogLog counters affected by views they generated, since individual removal is not supported, the practical options are either accepting the resulting (typically negligible) count drift going forward, or — if precision genuinely matters for that use case — periodically rebuilding affected HLL structures from the durable log with the deleted user’s events excluded. The recent-viewers list, being a simple sorted set, can have the specific entry removed directly and exactly.
Handling access requests, not just deletion requests
Deletion is not the only kind of privacy-related request this system needs to support. Many of the same data protection frameworks that grant a right to deletion also grant a right of access — a user asking “what data do you hold about me and who has viewed my profile and whose profiles have I viewed”. Because the durable view log is already partitioned and queryable by both profile_owner_id and, with a secondary index or a separate viewer-indexed copy, by viewer_id, answering this kind of request is a matter of querying both directions of the same underlying data the feature already needed for its normal product function — a good example of how a data model built thoughtfully for the product’s core use case often ends up serving compliance needs reasonably well too, rather than requiring an entirely separate system built just for regulatory response.
It is worth noting a genuine tension here that is worth naming explicitly in an interview: the viewer’s anonymous browsing setting protects their identity from the person whose profile they viewed, but it generally should not (and typically legally cannot) protect their identity from a legitimate data access request about their own account — a user has a right to know who viewed their own profile activity data insofar as it concerns their own data, but that is a different question from whether the platform reveals a third party’s anonymous browsing choice to someone else. Keeping these two distinct concepts clearly separated in both the data model and the access-control logic avoids accidentally building a compliance response path that either over-exposes anonymous viewers’ identities to the wrong party, or under-serves a user’s legitimate right to their own data.
Monitoring, Logging & Observability
Metrics that matter specifically for this system
- View capture latency (p50/p95/p99) — since this runs on every profile page load, even small regressions here are felt broadly across the platform’s core browsing experience.
- Dedup rate — the ratio of views filtered out versus published; a sudden change often signals either a bug in the dedup logic or an unusual traffic pattern (a bot wave, or a viral spike in genuinely distinct viewers) worth investigating.
- Real-time delivery latency — the time between a view event and a successful WebSocket push, tracked separately from overall event processing time, since this is the number most directly tied to the “near real-time” product promise.
- Kafka consumer lag — for both the Real-Time Notifier and Aggregation Service consumer groups; growing lag on the real-time consumer specifically threatens the core near-real-time requirement more directly than lag on the aggregation consumer, which has more slack.
- HLL cardinality sanity checks — periodically comparing approximate counts against exact counts on a small sample of profiles helps confirm the HyperLogLog implementation continues behaving within its expected error bounds in production, not just in testing.
Distributed tracing across the split pipeline
Because a single view event’s journey splits into two independent consumer paths, a trace ID attached to the original event and propagated through both branches (as discussed generally for cross-service tracing) is what makes it possible to answer questions like “why did this specific user not get a real-time notification for this specific view” by following the trace through presence lookup, gateway routing and delivery attempt, rather than piecing it together from disconnected logs across several services.
Alerting on the real-time delivery promise specifically
Given that near real-time delivery is the feature’s headline promise, a dedicated alert on the distribution of delivery latency (not just its average) is worth having — a rising p99 delivery time is an early, actionable warning that the real-time path is degrading, well before the aggregate “everything looks fine on average” metrics would show a problem.
“How would you detect that the HyperLogLog counts have started drifting further from reality than expected, in production, without waiting for a user complaint?” Run a background job that periodically samples a set of profiles, computes an exact distinct count for those specific profiles directly from the durable view log and compares it against the corresponding HLL estimate — alerting if the observed error exceeds the theoretically expected bound for the chosen HLL precision setting. This kind of ongoing sampled verification catches implementation bugs or misconfiguration that unit tests alone might miss under real production data patterns.
Capacity planning as an ongoing discipline, not a one-time exercise
The back-of-the-envelope numbers worked through earlier in this tutorial are a starting point for the initial design, not a fixed target that stays accurate forever. Real platforms revisit capacity assumptions on a regular cadence, because user growth, feature changes (a new onboarding flow that encourages more profile browsing, for instance) and shifts in usage patterns (a surge in hiring activity across an entire industry, which drives a burst of recruiter-side profile browsing) can each meaningfully change the actual write and read rates the system experiences. Good observability, as covered throughout this section, is what makes this an evidence-based, ongoing process rather than a one-time estimate frozen at launch — dashboards tracking sustained growth trends in view-event rate, dedup rate and read rate over weeks and months give the team the lead time needed to provision additional Kafka partitions, Redis shards, or Cassandra nodes well before existing capacity becomes a genuine constraint, rather than reacting only after users start noticing degraded performance.
Correlating product changes with system load
Because this feature sits downstream of essentially every profile page view across the platform, seemingly unrelated product changes elsewhere — a redesigned homepage that surfaces more profile links, a new “people you may know” recommendation algorithm that drives more profile clicks — can meaningfully shift load onto this system without any change to the profile-viewing feature itself. Maintaining a habit of correlating major product launches elsewhere on the platform with subsequent shifts in this system’s core metrics helps the team distinguish “our own bug or capacity limit” from “load increased because a completely different team shipped something that indirectly drives more profile views”, which are two very different kinds of problems requiring very different responses.
Deployment & Cloud Architecture
Containerized services behind an orchestrator
As with most modern distributed systems, each service here — View Capture, Real-Time Notifier, Aggregation, Profile Views Read Service, WebSocket Gateway — runs as an independently deployable, independently scalable container under an orchestrator like Kubernetes, with auto-scaling tied to relevant load signals (request rate for View Capture, consumer lag for the two Kafka consumers, active connection count for the WebSocket Gateway).
Regional deployment and the WebSocket Gateway’s special requirement
Most components here follow the same multi-region deployment pattern discussed for globally distributed systems generally — regional read replicas and caches serving local users, backed by globally replicated durable storage. The WebSocket Gateway has one additional wrinkle worth calling out: because connections are stateful and sticky, presence data needs to be either globally visible or carefully routed so that a real-time notification triggered by a view event processed in one region can find a profile owner’s connection that happens to be held by a gateway in a different region — commonly solved with a globally accessible presence store (a globally replicated Redis deployment, or a dedicated presence-lookup service) even while most other data stays regionally partitioned for locality.
Safe rollout of changes to the real-time and aggregation pipelines
Canary deployments and feature flags apply here just as they would generally — a new HLL precision setting or a change to dedup window length is the kind of change worth rolling out to a small percentage of profiles first, comparing metrics against the control group, before a full rollout, since a subtle bug in either could quietly skew every profile’s view counts platform-wide.
“Why not just keep presence data regional too, the same way you partition everything else?” Because a user’s physical location when they connect does not necessarily match where the person viewing their profile is connecting from and a view can legitimately originate from anywhere on the platform. Regional-only presence would mean the system could only deliver real-time notifications correctly when both viewer and owner happen to be in the same region — a meaningful gap in a genuinely global product, which is why this specific piece of state needs global visibility even though most of the system benefits from regional partitioning.
Disaster Recovery, Backup & Cost Optimization
Disaster recovery priorities specific to this system
If an entire region fails, the durable view log and account data — replicated across regions — remain recoverable with minimal loss, following the same general multi-region resilience principles used across the platform. The one component genuinely at higher risk during a regional failure is real-time delivery — connections held by a failed region’s WebSocket Gateway instances simply drop and affected users need to reconnect (typically automatically, via client-side reconnect logic) to a healthy region’s gateway before real-time delivery resumes for them; in the meantime, their views are still safely captured by the durable, region-independent aggregation path.
Backup strategy
Regular snapshots of the durable Cassandra view log, on a rolling retention schedule, protect against logical corruption or accidental bulk deletion, exactly as discussed for durable storage layers generally. Because the fast-path Redis structures (dedup keys, HLL counters, recent-viewer lists) are either short-lived by design or reconstructible from the durable log, they generally do not need the same rigorous backup treatment — losing them is an inconvenience requiring some recomputation, not permanent data loss.
Cost optimization
- Aggressive TTLs on dedup keys and presence data — since these are only ever useful for a bounded window (a day for dedup, under a minute for presence), letting them expire automatically avoids paying for memory that serves no purpose past that window.
- HyperLogLog over exact sets — already covered at length, but worth restating as a direct cost lever: the memory savings compound across hundreds of millions of profiles into a very real infrastructure cost difference.
- Tiered retention for the durable log — older, rarely-queried raw view events can move to cheaper cold storage after a reasonable window, retaining only the aggregated, already-computed counters and lists in the fast, expensive tier indefinitely.
- Right-sizing dedicated capacity for high-traffic profiles — similar to celebrity-account handling discussed generally, giving disproportionately popular profiles dedicated cache shards should be a targeted, monitored allocation rather than over-provisioning the entire fleet for a worst case that applies to a small fraction of profiles.
“Where is the biggest cost lever in this specific design, if you had to pick just one?” The choice of HyperLogLog over exact distinct-count tracking is likely the single largest lever, precisely because it applies uniformly across every profile on the platform — a small, fixed memory footprint per profile per time window, multiplied by hundreds of millions of profiles and several overlapping windows each, is the difference between a design that fits comfortably in a well-sized Redis cluster and one that would require an order of magnitude more memory to track exact sets at the same scale.
Algorithms Deep Dive
How HyperLogLog actually works, at an intuitive level
It is worth understanding the core idea behind HyperLogLog, not just how to call the Redis commands, since interviewers often probe here. The intuition rests on a clever observation: if you hash each element into a random-looking binary string, the probability of seeing a specific pattern of leading zeros in that hash is exactly predictable — seeing k leading zero bits has roughly a 1-in-2^k chance for any single random hash. If you have hashed many distinct elements and the maximum number of leading zeros you have observed across all of them is k, that is a signal that you have probably hashed somewhere in the neighborhood of 2^k distinct elements — because it would take roughly that many independent tries to have a good chance of seeing that rare a pattern at all.
A single such estimate is noisy, so HyperLogLog splits the hash space into many small buckets (a common choice is a few thousand), tracks the maximum leading-zero count independently within each bucket and then combines all the bucket estimates using a specific averaging technique (a harmonic mean, which is more resistant to outlier buckets than a simple average) to arrive at a much more stable overall estimate. This bucketing-and-averaging approach is what pushes the typical error rate down to roughly 1-2% while still needing only a small, fixed amount of memory per structure, regardless of how many total elements were ever added.
// A deliberately simplified illustration of the core HLL idea -
// production implementations (like Redis's) are considerably more
// refined, but this captures the essential mechanism.
public class SimplifiedHyperLogLog {

    private final int numBuckets;
    private final int[] maxLeadingZeros;

    public SimplifiedHyperLogLog(int numBuckets) {
        this.numBuckets = numBuckets;
        this.maxLeadingZeros = new int[numBuckets];
    }

    public void add(String element) {
        long hash = hash64(element);
        int bucketIndex = (int) (hash & (numBuckets - 1)); // low bits choose the bucket
        int leadingZeros = Long.numberOfLeadingZeros(hash >>> Integer.numberOfTrailingZeros(numBuckets));
        maxLeadingZeros[bucketIndex] = Math.max(maxLeadingZeros[bucketIndex], leadingZeros);
    }

    public double estimateCardinality() {
        double sumOfInverses = 0;
        for (int bucketMax : maxLeadingZeros) {
            sumOfInverses += Math.pow(2, -bucketMax);
        }
        double harmonicMean = numBuckets / sumOfInverses;
        double alpha = 0.7213 / (1 + 1.079 / numBuckets); // standard bias-correction constant
        return alpha * numBuckets * numBuckets * harmonicMean / numBuckets;
    }

    private long hash64(String s) {
        return Hashing.murmur3_128().hashString(s, StandardCharsets.UTF_8).asLong();
    }
}
Bloom filters — the complementary probabilistic structure
Where HyperLogLog estimates “how many distinct things”, a Bloom filter answers a different question cheaply: “have I possibly seen this specific thing before”. It works by hashing each element with several independent hash functions, setting the corresponding bits in a shared bit array and later checking membership by testing whether all of those same bit positions are set — if any one of them is not, the element definitely was not added; if all of them are, the element probably was, with a small, tunable false-positive rate depending on the array size and number of hash functions relative to how many elements have been added.
Sliding window rate limiting for abuse prevention
Beyond the simple token bucket approach covered generally for API rate limiting, view-farming detection benefits from a sliding window count — tracking how many distinct profiles a given viewer has visited within a rolling time window (rather than a fixed calendar window, which can be gamed at the boundary), flagging accounts whose velocity clearly exceeds normal human browsing behavior.
// Sliding window counter using a Redis sorted set, timestamp as score
public class SlidingWindowCounter {

    private final RedisClient redis;

    public boolean isWithinLimit(String viewerId, int maxEvents, Duration window) {
        String key = "sliding:" + viewerId;
        long now = System.currentTimeMillis();
        long windowStart = now - window.toMillis();

        redis.zremrangeByScore(key, 0, windowStart); // drop events outside the window
        long count = redis.zcard(key);

        if (count >= maxEvents) {
            return false; // over the limit
        }
        redis.zadd(key, now, UUID.randomUUID().toString());
        redis.expire(key, window);
        return true;
    }
}
“Why is a sliding window generally considered better than a simple fixed calendar window (like ‘max 100 views per viewer per calendar day’) for abuse detection?” A fixed window can be gamed at the boundary — a viewer could send 100 views right before midnight and another 100 right after, effectively doubling their real short-term rate while technically staying within both individual daily limits. A sliding window continuously considers “the last 24 hours from right now”, which closes this boundary-gaming loophole entirely.
Concurrency considerations specific to a write-dominated pipeline
Because this system’s entire design centers on absorbing an extremely high, continuous rate of writes, concurrency correctness matters more here than it might in a more read-dominated design. A few specific concerns are worth being explicit about.
Race conditions in the dedup check. If a viewer’s client somehow fires two near-simultaneous view requests (a double-tap, a retry after a slow network response, a buggy client), both requests could theoretically reach the View Capture Service at almost the same instant, before either has finished writing its dedup key. Relying on an atomic “set if not exists” operation (rather than a separate read-then-write sequence, which has an inherent race window between the two steps) closes this gap — the atomicity guarantee means only one of the two concurrent requests can ever “win” the SET and the other correctly observes that a key already exists.
Thread pool and connection pool sizing in high-throughput consumers. The Aggregation Service and Real-Time Notifier both need carefully sized worker thread pools and Redis/Cassandra connection pools — undersized pools cause requests to queue up and add latency exactly where the system can least afford it (the real-time delivery path), while oversized pools can overwhelm the downstream Redis or Cassandra cluster with more concurrent connections than it can efficiently serve. As with the fan-out worker pool discussed for a content-feed system, the right sizing here comes from load testing against realistic traffic patterns rather than guesswork.
Ordering guarantees within a single profile’s event stream. Because the recent-viewers sorted set relies on each event’s timestamp for correct ordering and Kafka partitions preserve order only within a single partition, keying the topic by profile_owner_id (as covered in the sharding section) is what guarantees a given owner’s events are processed in the order they actually occurred, even when many different owners’ events are being processed concurrently across many partitions and consumer threads at once.
Idempotent processing on consumer retry. Following the same idempotency principle discussed for fan-out pipelines generally, if a consumer crashes partway through processing a batch of view events and the message broker redelivers them, reprocessing the same event twice should never double-count it. Using the event’s unique ID as the member value in the recent-viewers sorted set (rather than generating a new synthetic identifier on each processing attempt) and relying on HyperLogLog’s own inherent idempotency — adding the same element to an HLL structure twice has no effect on the estimate, by construction — both provide this safety essentially for free, without needing an explicit deduplication table on the consumer side.
Best Practices & Common Mistakes
Best practices
- Identify the true bottleneck ratio before designing anything. This system’s entire shape flows from recognizing that writes vastly outnumber reads here — the opposite of a typical feed system — and designing accordingly rather than reflexively reaching for feed-style patterns.
- Separate best-effort delivery from durable recording. Real-time delivery and durable aggregation have genuinely different requirements and coupling them either makes the fast path slower than necessary or the durable path less reliable than necessary.
- Reach for probabilistic structures deliberately, not reflexively. HyperLogLog and Bloom filters are excellent tools specifically because a small amount of imprecision is genuinely acceptable for their use here — always confirm that trade is actually acceptable for the specific product requirement before applying it elsewhere.
- Design privacy features to be leak-proof across every surface, not just the obvious one. Anonymous browsing has to be enforced consistently everywhere viewer identity could otherwise surface, not just in the main list view.
- Keep the durable log as the ground truth and treat every fast, approximate structure as derived and rebuildable from it. This makes recovery from data loss, bugs, or deletion requests tractable in a way that would be much harder if the approximate structures were the only record.
Common mistakes
- Defaulting to a feed-style fan-out architecture without first noticing this problem’s read/write ratio runs in the opposite direction, leading to an overbuilt, unnecessarily expensive design.
- Deduplicating after publishing events rather than before, multiplying unnecessary load across every downstream consumer.
- Storing exact viewer sets for count computation instead of approximate structures, which becomes a serious memory problem at platform scale.
- Treating anonymous browsing as a simple “hide the name” UI filter rather than a data-handling requirement enforced consistently at every layer that could otherwise leak identity.
- Gating premium features by withholding data at write/storage time rather than at read time, creating unnecessary backfill complexity on subscription changes.
- Forgetting that HLL structures cannot have elements removed and not planning for how deletion requests will actually be honored against them.
“If you had to explain this whole design in one sentence to a non-technical product manager, what would you say?” Something like: “We record every profile view cheaply and instantly, tell you about it right away if you are online to see it and otherwise make sure it is waiting for you the next time you check — without ever needing to store more than a tiny, fixed amount of extra data per person, no matter how popular their profile gets.” Being able to compress a complex distributed design into a clear, accurate one-line summary is itself a valuable skill interviewers are often quietly evaluating.
Real-World & Industry Examples
Professional networking platforms
Professional networking platforms are the most direct real-world example of this exact feature, having popularized and refined “who viewed your profile” over many years, including the tiered visibility model (limited free view, full list for premium subscribers) that shaped this tutorial’s read-time access-gating discussion. Their public engineering discussions over the years have described exactly the kind of write-heavy, high-cardinality tracking problem this tutorial addresses.
Messaging & collaboration — read receipts and presence
The presence-aware, targeted real-time delivery pattern used here is directly borrowed from how messaging platforms implement read receipts and “typing…” indicators — both are one-to-one or small-audience signals that only matter if the recipient is actively present, exactly the shape of problem this tutorial’s real-time delivery section solves.
Short-form video and story platforms — “who viewed my story”
Ephemeral content platforms that show a creator exactly who viewed their story face a closely related problem: high write volume (every viewer generates a view record), a need for near-real-time updates as views accumulate and a bounded, exact list of recent viewers — very similar in shape to the recent-viewers list design covered in this tutorial’s aggregation section, just without the durable, long-term retention this tutorial’s professional-networking context requires.
Web analytics platforms — approximate counting at scale
Large-scale web analytics tools that report unique visitor counts across enormous volumes of traffic are one of the most widely cited real-world users of HyperLogLog and similar probabilistic cardinality-estimation techniques, precisely because tracking exact unique visitor sets across billions of page views would be prohibitively expensive — the same underlying trade-off this tutorial applies to distinct profile-viewer counting.
“Which of these examples is closest in spirit to your design and why?” The presence-aware delivery pattern from messaging platforms and the approximate-counting approach from large-scale analytics platforms are arguably the two most directly borrowed ideas here — the first solves the “deliver quickly, but only to someone who is there” problem and the second solves the “count accurately enough, cheaply, at massive scale” problem and this tutorial’s design is really a combination of exactly those two well-proven ideas applied to a professional-networking-specific feature.
Frequently Asked Questions
Q: How long should the dedup window actually be — is a full day always right?
A day is a common, reasonable default because it aligns with how people naturally think about “did I check this profile today”, but it is a tunable business decision rather than a technical constant. Some platforms use shorter windows for certain contexts (like search-result impressions) and longer windows for others; the key technical requirement is just that whatever window is chosen, the dedup cache’s TTL matches it.
Q: What if the profile owner blocks or has never interacted with a viewer — should that view still count?
This is a product policy decision layered on top of the technical design covered here — the system can support any policy (always count, never count for blocked relationships, count but never display) simply by adding a check at the appropriate stage: either filtering at capture time if the platform decides blocked users should not generate view records at all, or filtering at read/display time if the platform wants to record the event but never surface it to the profile owner.
Q: Could this system accidentally reveal an anonymous viewer’s identity through the timing of the real-time notification?
This is a genuinely subtle risk worth designing around explicitly — if a profile owner is having a one-on-one conversation with a specific person and sees a “someone viewed your profile” notification at the exact moment that conversation is happening, they might reasonably infer who it was, even without any name shown. Some platforms deliberately introduce a small, randomized delay for anonymous notifications specifically to reduce this kind of timing-based inference risk, trading a small amount of “near” in “near real-time” for stronger privacy in this specific case.
Q: Why not just use a relational database with a well-indexed table for the whole thing, given the scale might not be as extreme as a global feed?
A well-indexed relational database absolutely can work for smaller-scale versions of this feature and it is a perfectly reasonable starting point. The architecture in this tutorial earns its added complexity specifically at the scale described in the prompt — hundreds of millions of users generating tens of thousands of write events per second — where a single relational database, even a powerful one, would need extensive manual sharding and would still struggle to provide the sub-second dedup checks and real-time delivery this design achieves more naturally with purpose-built in-memory structures.
Q: Does this design assume every view happens through a full page load, or does it also need to handle views surfaced through search results or previews?
Real platforms typically distinguish between a full profile view and a lighter-weight impression (seeing someone’s card in search results, for example), often counting only genuine full views toward the “who viewed your profile” feature specifically, while tracking impressions separately for different analytics purposes. The source_context field included in the data model earlier exists precisely to support this kind of distinction if the product requires it.
Q: How would you load test a system like this before launch, given how bursty and unpredictable profile-view traffic can be?
The most useful approach is generating synthetic traffic that mirrors realistic distributions rather than a flat, evenly-spread load — most systems like this see a long tail where a small number of profiles (recruiters actively sourcing, recently-promoted or newsworthy individuals, company pages during a hiring push) receive dramatically more traffic than a typical profile, similar in shape to the celebrity-account skew discussed for content-feed systems. Load tests should specifically include this kind of skewed distribution, not just an average steady rate, since the skewed case is exactly where hot-key and dedup-cache-contention problems tend to surface first, well before an average-case load test would reveal them.
Q: Would this design change meaningfully if the platform wanted to show viewers “trending” profiles that are getting unusually high view volume right now, not just individual counts?
This is a genuinely different, additional read pattern layered on top of everything covered here — rather than “how many people viewed my specific profile”, it becomes “which profiles across the whole platform are seeing an unusual spike right now”, which needs a comparison across many profiles rather than a lookup scoped to one. This typically requires a separate, dedicated aggregation pipeline that periodically ranks profiles by recent view velocity (using the same underlying HyperLogLog-based counters as an efficient input, rather than recomputing from the raw log), rather than trying to extend the single-profile-scoped Read Service to also answer platform-wide ranking queries efficiently.
Summary & Key Takeaways
Here is the narrative worth being able to walk through cleanly, start to finish, if asked to design this system live.
Key takeaways
- Start by finding the actual read/write ratio and notice when it runs opposite to what you might expect from a more familiar problem — here, writes outnumber reads by roughly 75 to 1, which is the inverse of a typical social feed and that inversion should visibly shape every subsequent decision.
- Recognize this as a one-to-one delivery problem, not a fan-out problem. A profile view matters to exactly one recipient, which allows a far lighter real-time delivery mechanism than a general-purpose fan-out pipeline would require.
- Split delivery into a fast, best-effort real-time branch and a slower, durable aggregation branch, each optimized for what it actually needs — speed for one, completeness for the other — rather than forcing one code path to serve both requirements.
- Deduplicate as early as possible, before events even enter the pipeline, to keep every downstream system dealing only with genuinely meaningful events.
- Use probabilistic data structures — HyperLogLog for counting, Bloom filters for dedup pre-checks — deliberately, wherever a small, bounded amount of imprecision is genuinely an acceptable trade for a large reduction in memory and computation.
- Enforce tiered access at read time, not by restricting what is stored, keeping the storage layer simple and the upgrade path free of backfill complexity.
- Treat privacy — especially anonymous browsing — as a cross-cutting requirement enforced consistently at every surface that could otherwise leak identity, not a single filter applied in one obvious place.
- Keep the durable, exact view log as ground truth underneath every fast, approximate structure, so the system remains recoverable, auditable and compliant with deletion requirements even though its fast paths trade some precision for speed.
This system succeeds by noticing early that it is solving the mirror image of a typical feed problem — enormous write volume feeding a comparatively rare, single-recipient read — and building every component, from deduplication through delivery to counting, specifically around that shape, rather than reaching for the more familiar fan-out patterns that solve a different problem entirely.
If there is a broader lesson worth carrying forward into other system design problems beyond this specific one, it is this: the two tutorials in this series — a content feed and a profile-view tracker — solve what look like superficially similar problems (something happens, someone else needs to find out about it) with almost entirely different architectures, purely because the underlying traffic shape is different in each case. That is really the core discipline of system design as a practice: resist the pull toward a familiar, previously-successful pattern until you have actually measured and understood the specific shape of the problem in front of you, because the right architecture is a direct consequence of that shape, not a template to be reapplied from the last problem that merely looked similar on the surface.

