What Is a Performance SLA?
A complete, beginner-friendly, production-grade guide to Service Level Agreements — what they are, why every serious software system needs one, how they are measured, and how real companies like Netflix, Amazon, and Google build systems that actually meet them.
What Is a Performance SLA?
Imagine ordering a pizza with the promise “30 minutes or it’s free.” That single sentence — measurable outcome, clear consequence, shared expectation — is exactly what a Service Level Agreement does for a software system.
Imagine you order a pizza. The pizza shop tells you, “Your pizza will arrive in 30 minutes, or it’s free.” That single sentence is a promise. It has a measurable outcome (30 minutes), a consequence if broken (free pizza), and it tells you exactly what to expect. In the world of software, this exact idea has a name: a Service Level Agreement, or SLA.
A Performance SLA is a formal, measurable promise about how well a software system will perform. It usually covers things like: how fast the system responds, how often it is available, and how reliably it processes requests. When you use a website, a mobile app, a payment gateway, or a cloud service, there is very often an SLA sitting quietly behind the scenes, deciding how that service is built, tested, and monitored.
Think of an SLA like the promise printed on a courier package: “Delivery within 24 hours, or your money back.” You don’t see the trucks, the sorting centers, or the drivers — but that one sentence forces the entire company to build routes, warehouses, and backup vehicles so the promise is kept. A performance SLA does the same thing for software: it is a simple sentence that forces engineers to build fast, resilient, well-monitored systems behind the scenes.
1.1 A Short History
The idea of a “service level agreement” did not begin in software. It started in the telecommunications industry in the 1980s, when phone companies signed contracts with businesses promising a certain percentage of “uptime” for phone lines. If the phone lines went down too often, the telecom company had to pay a penalty.
As computing moved from mainframes to client-server systems in the 1990s, and then to the internet in the 2000s, this same idea moved with it. Early web hosting companies started offering “99.9% uptime guarantees.” Then came cloud computing — Amazon Web Services (AWS) launched in 2006, and shortly after, cloud providers began publishing detailed, public SLAs for services like storage, compute, and databases, because businesses needed to know: “If I build my company on top of your cloud, how reliable and fast will it actually be?”
Today, in the era of microservices, mobile apps, and global-scale platforms, SLAs are everywhere — often invisible to the end user, but absolutely central to how engineering teams design, build, and operate systems.
1980s — Telecom Uptime Guarantees
Phone companies sign the first “service level” contracts, promising a certain percentage of uptime for leased business phone lines and paying penalties when they miss.
1990s — Early Web Hosting “99.9%”
As the web goes commercial, hosting providers advertise “99.9% uptime” guarantees, borrowing the telecom vocabulary for a new audience.
2006 — AWS Launches Public Cloud SLAs
Amazon Web Services goes live and, service by service, publishes formal per-product SLAs with service credits — making SLAs a first-class part of any cloud purchase decision.
2010s — SRE Formalises SLI/SLO/SLA
Google’s Site Reliability Engineering discipline codifies the SLI → SLO → SLA hierarchy and the concept of error budgets, giving the whole industry a shared vocabulary.
Today — Microservices & Composite SLAs
A single mobile app depends on dozens of services; SLAs are the glue that lets independent companies build reliable systems together based on documented promises rather than blind hope.
Whether you become a backend engineer, a site reliability engineer (SRE), a solutions architect, or a technical product manager, you will constantly be asked: “What is our SLA for this API?” or “Are we meeting our SLA this month?” Understanding SLAs deeply is one of the most practical, career-boosting things you can learn in software architecture.
1.2 How SLAs Spread Across the Industry
By the 2010s, almost every serious business-to-business software product came with some form of SLA attached. Software-as-a-Service (SaaS) companies like Salesforce, Slack, and Stripe began publishing public “status pages” and formal SLA documents, because their customers — often other businesses — needed to know exactly how dependable these tools were before building their own operations on top of them.
This spread wasn’t just about being nice to customers. It reflected a deeper shift in how software is built. In the early days of computing, a single company usually owned its entire technology stack — the hardware, the network, the software, everything. If something broke, one team fixed it, end to end. Today, a single mobile app might depend on dozens of external services: a cloud provider, a payment processor, a mapping service, an analytics platform, a push-notification service, and more. SLAs are the “glue” that lets independent companies build reliable systems together, each trusting the others’ documented promises instead of blind hope.
1980s: Telecom companies introduce uptime guarantees for leased phone lines. 1990s: Early web hosting companies advertise “99.9% uptime.” 2006: AWS launches, eventually publishing detailed per-service SLAs. 2010s: The SRE discipline (pioneered at Google) formalizes SLI/SLO/SLA vocabulary industry-wide. Today: SLAs are a standard part of almost every cloud contract, API product, and internal microservice agreement.
The Problem SLAs Solve
Without an SLA there is no shared definition of “fast enough” or “reliable enough.” That single missing sentence turns engineering conversations into personal arguments and business decisions into gut feelings.
Let’s understand why SLAs exist by imagining a world without them.
Suppose you are a company that wants to use a third-party payment gateway to accept credit card payments on your e-commerce site. The payment gateway company just says, “Our service is usually fast and usually works.” That’s it — no numbers, no guarantees.
- What does “usually fast” mean? 1 second? 10 seconds? 1 minute?
- What does “usually works” mean? 99% of the time? 50% of the time?
- What happens if it’s slow or broken during your biggest sale of the year (like Black Friday)?
- Do you get any compensation, or do you just lose money silently?
Without concrete numbers, you cannot plan. You cannot decide whether this payment gateway is good enough for your business. You cannot build fallback systems, because you don’t know how often you would need them. This is the exact problem that SLAs solve: they turn vague promises (“usually fast”) into measurable, testable, enforceable commitments (“95% of payment requests will complete in under 2 seconds, and the service will be available 99.95% of the time each month”).
2.1 The Business Motivation
SLAs exist because of a simple truth: slow or unreliable software costs real money and real trust. Studies by companies like Amazon and Google have repeatedly found that even small delays in response time cause measurable drops in user engagement and revenue. A famous internal finding at Amazon suggested that every 100 milliseconds of extra latency could cost significant sales. Google found that slower search results led to fewer searches per user.
Without a defined SLA, engineering teams have no shared target. One engineer might think “fast enough” means 3 seconds. Another might think it means 300 milliseconds. Product managers can’t set customer expectations. Support teams can’t tell angry customers when something is “actually broken” versus “just having a bad day.” SLAs remove this ambiguity.
2.2 What Happens When Nobody Agrees on “Fast Enough”
Picture a real scenario inside a growing company. The mobile team says the checkout API “feels slow.” The backend team says, “It’s fine, it usually responds in under a second.” The customer support team says, “We’re getting complaints about the app freezing during checkout.” Without numbers, this becomes a personal disagreement rather than an engineering problem. Nobody can say who is “right,” because there is no agreed-upon definition of “slow” or “fine.”
Now imagine the same company with a clear internal SLO: “The checkout API must respond in under 400ms for 95% of requests.” Suddenly, the conversation changes completely. Someone pulls up a dashboard. Either the number is above 400ms for more than 5% of requests, or it isn’t. The disagreement about opinions becomes a shared, measurable fact. This is the single biggest practical benefit of SLAs: they convert subjective arguments into objective, data-driven conversations.
2.3 A Real Consequence: Losing a Deal Because of Missing Numbers
Consider a large enterprise customer evaluating two competing API providers for a critical business function, such as fraud detection during checkout. Provider A says, “We’re reliable and fast.” Provider B says, “We guarantee 99.95% monthly availability and a p99 latency under 200ms, backed by service credits if we miss these numbers.” Almost every serious enterprise buyer will choose Provider B, because Provider B has done the hard work of quantifying their promise and is willing to be held accountable for it. In competitive markets, a well-defined SLA is not just an engineering artifact — it is a genuine sales and trust advantage.
2.4 The Technical Motivation
From a pure engineering standpoint, SLAs give teams a target to design against. If your SLA says “99.9% of requests must complete in under 500ms,” that single number drives dozens of architectural decisions: How many servers do you need? Do you need caching? Do you need a content delivery network (CDN)? Do you need database read replicas? Should you use asynchronous processing? An SLA is not just a marketing promise — it is an engineering specification.
“Feels Slow” Debates
Mobile, backend, and support argue about vibes instead of numbers. Nothing gets fixed because nothing is measured.
No Fallback Planning
You can’t decide whether a payment gateway needs a backup provider if you don’t know how often it fails.
Silent Revenue Leaks
Sub-second latency creeps up unnoticed; conversions drop; nobody connects the dots until quarterly numbers arrive.
Lost Enterprise Deals
Serious buyers pick the vendor whose promise is quantified and enforceable, not the one that says “usually fine.”
SLI, SLO, SLA & the Vocabulary of Reliability
Before we go deeper, we need to carefully define several terms that are often confused with each other: SLA, SLO, and SLI. These three terms form the foundation of reliability engineering.
3.1 SLI — Service Level Indicator
An SLI is a measurement. It is a specific, quantifiable metric that tells you how your system is actually behaving right now. Examples of SLIs:
- Request latency (how long a request takes)
- Error rate (percentage of requests that fail)
- Availability (percentage of time the system is reachable and working)
- Throughput (requests processed per second)
An SLI is like the number your car’s speedometer shows right now — say, 62 km/h. It’s just a live measurement, nothing more.
3.2 SLO — Service Level Objective
An SLO is a goal — an internal target that your team sets for an SLI. For example: “99.9% of requests should have a latency under 300ms, measured over a rolling 30-day window.” SLOs are usually internal — used by engineering teams to guide their own work and decide when to slow down feature development and focus on reliability instead.
An SLO is like the speed limit sign on the highway — 60 km/h. It’s the target you’re aiming to stay within, based on the speedometer reading (the SLI).
3.3 SLA — Service Level Agreement
An SLA is a contract — a formal agreement, often with legal and financial consequences, made between a service provider and a customer. It usually includes one or more SLOs, plus what happens if those objectives are not met (usually a penalty, like a service credit or refund).
An SLA is like the actual traffic law and the fine you pay if a speed camera catches you going over 60 km/h. It has real, external consequences.
| Term | What It Is | Audience | Example |
|---|---|---|---|
| SLI | A raw measurement | Engineers, monitoring dashboards | “Current p99 latency: 340ms” |
| SLO | An internal target | Engineering teams | “p99 latency should stay under 400ms” |
| SLA | An external contract with consequences | Customers, legal, business teams | “We guarantee p99 latency under 500ms, or you get a 10% service credit” |
SLAs are usually set looser than SLOs, which are set looser than what the system typically achieves. This gives teams a safety buffer. If your real-world performance is 200ms, your SLO might be 400ms, and your SLA (the contractual promise) might be 500ms. That buffer protects you from breaking your contract due to small, normal fluctuations.
3.4 What “Performance” Actually Means in a Performance SLA
The word “performance” in a performance SLA usually breaks down into several measurable dimensions:
Latency (Response Time)
How long it takes for the system to respond to a single request, usually measured in milliseconds (ms).
Throughput
How many requests the system can handle per second (often written as RPS or QPS — requests/queries per second).
Availability (Uptime)
What percentage of time the system is up and reachable, usually expressed as a percentage like 99.9% (“three nines”).
Error Rate
What percentage of requests fail or return errors under normal, and under stressed, operating conditions.
3.5 Understanding Percentiles: p50, p95, p99
One of the most important — and most misunderstood — concepts in performance SLAs is the use of percentiles instead of averages.
Imagine 100 students take an exam. If you only look at the average score, one genius who scored 100% could hide the fact that 20 students failed badly. Percentiles let you look at the full picture: “What score did the 95th student (from the bottom) get?” That tells you about the experience of almost everyone, including the strugglers.
In software, we almost never use “average response time” for SLAs, because averages hide bad experiences. Instead, we use percentiles:
- p50 (median): 50% of requests were faster than this value. This represents the “typical” experience.
- p95: 95% of requests were faster than this value. Only 5% were slower.
- p99: 99% of requests were faster than this value. Only 1% were slower — but for a system handling 1 million requests a day, that “1%” is still 10,000 unhappy users!
Suppose 99 requests take 100ms each, and 1 request takes 10,000ms (10 seconds) because of a slow database query. The average is about 199ms — looks fine! But the p99 is 10,000ms — terrible. If you only monitored the average, you would completely miss that 1 out of every 100 users is having a horrible experience.
3.6 The “Nines” of Availability
Availability SLAs are almost always expressed as a percentage made of repeating “9” digits, and each additional nine represents a dramatically smaller allowance for downtime. It helps to see these side by side, because the jump from one level to the next is much bigger than it first appears.
| Availability | Nickname | Downtime / Year | Downtime / Month | Downtime / Day |
|---|---|---|---|---|
| 99% | Two nines | ~3.65 days | ~7.3 hours | ~14.4 minutes |
| 99.9% | Three nines | ~8.76 hours | ~43.8 minutes | ~1.44 minutes |
| 99.95% | Three and a half nines | ~4.38 hours | ~21.9 minutes | ~43 seconds |
| 99.99% | Four nines | ~52.6 minutes | ~4.38 minutes | ~8.6 seconds |
| 99.999% | Five nines | ~5.26 minutes | ~26.3 seconds | ~0.86 seconds |
Notice how going from three nines to four nines shrinks the allowed yearly downtime from almost 9 hours down to under an hour. Going from four nines to five nines shrinks it further, down to just over five minutes a year. This is why teams rarely chase “one more nine” casually — each step usually demands a substantially more sophisticated (and expensive) architecture: multi-region failover, automated recovery, extensive chaos testing, and round-the-clock, highly trained operations teams.
3.7 Latency vs. Response Time vs. Throughput
Beginners often mix up a few closely related words. It’s worth pinning them down precisely:
- Latency usually refers to the time for one specific hop or operation, like “database query latency” or “network latency.”
- Response time usually refers to the full, end-to-end time the user experiences, from sending a request to receiving a complete response.
- Throughput refers to volume over time — how many operations the system completes per second — and is somewhat independent of latency. A system can have low latency but low throughput (fast for one user, but can’t handle many at once), or high throughput but high latency (handles huge volume, but each individual request is slow).
Architecture & Components
Meeting a performance SLA is not the job of a single component — it’s the result of an entire system working together. Let’s look at the key architectural building blocks involved.
4.1 Component Breakdown
CDN (Content Delivery Network)
Serves static content (images, videos, JavaScript files) from servers physically close to the user, drastically cutting latency for users far from your main data center.
Load Balancer
Distributes incoming requests across many servers so no single server becomes overwhelmed. This directly protects both latency and availability SLAs.
API Gateway
A single entry point that can enforce rate limits, authentication, and routing — often where SLA-related metrics like request latency are first recorded.
Service Instances
Multiple copies of your application code running in parallel, so if one instance is slow, crashed, or overloaded, others can absorb the traffic.
Cache Layer
An in-memory data store (like Redis or Memcached) that serves frequently requested data extremely fast, avoiding slow database round-trips.
Database (Primary + Replicas)
The primary database handles writes; read replicas handle read queries, spreading load and improving read latency.
Monitoring & Alerting
Continuously watches every component, calculating SLIs in real time and alerting engineers before an SLA is breached.
Async Workers & Queues
Move non-critical work (emails, analytics, indexing) off the user’s request path so the latency budget is spent only on things users actually wait for.
No single component “owns” the SLA. The SLA is a promise about the end-to-end experience. A weak link anywhere — a slow cache, an overloaded database, a congested network — can break the whole promise. This is why performance SLA work is fundamentally a systems-thinking discipline.
4.2 Why Redundancy Appears at Every Layer
Notice, in the diagram above, that almost every layer has more than one instance: multiple service instances, multiple database read replicas, multiple potential cache nodes. This is not accidental duplication — it is a deliberate architectural principle. Any single point of failure (a component with no backup) is also a single point where an SLA can be broken. If there is only one server and it crashes, availability instantly drops to zero for every user until someone manually intervenes. By contrast, if there are five servers and one crashes, the system might barely notice, because the load balancer simply routes around the failed instance while it is restarted.
This principle extends beyond servers to the physical world as well: redundant power supplies, redundant network links, and redundant data centers in different geographic locations, so that even a fire, flood, or regional power outage does not take the whole system offline.
How SLAs Are Measured & Enforced Internally
Let’s walk through exactly how a system measures and enforces a performance SLA internally, step by step — from raw stopwatch on every request to the postmortem after an inevitable miss.
5.1 Step 1 — Instrumentation
Every service must record timestamps at key points: when a request arrives, and when a response is sent. The difference is the latency for that request.
@Component
public class LatencyTrackingFilter extends OncePerRequestFilter {

    private final MeterRegistry meterRegistry;

    public LatencyTrackingFilter(MeterRegistry meterRegistry) {
        this.meterRegistry = meterRegistry;
    }

    @Override
    protected void doFilterInternal(HttpServletRequest request,
                                     HttpServletResponse response,
                                     FilterChain chain)
            throws ServletException, IOException {

        long startTime = System.nanoTime();
        try {
            chain.doFilter(request, response);
        } finally {
            long durationNanos = System.nanoTime() - startTime;

            // Record the latency, tagged by endpoint and status code
            Timer.builder("http.request.latency")
                 .tag("uri", request.getRequestURI())
                 .tag("status", String.valueOf(response.getStatus()))
                 .register(meterRegistry)
                 .record(durationNanos, TimeUnit.NANOSECONDS);
        }
    }
}
This kind of code runs on every single request, silently recording how long it took. Over thousands or millions of requests, this data forms a distribution that can be summarized using percentiles.
5.2 Step 2 — Aggregation
Raw measurements are aggregated over time windows (e.g., every 1 minute) and stored in a time-series database like Prometheus. The system computes percentiles from these aggregated values, feeding both live dashboards and long-running trend reports.
5.3 Step 3 — SLO Evaluation & Error Budgets
Teams often use a concept called an error budget. If your SLO is 99.9% availability over 30 days, that means you’re “allowed” 0.1% downtime — roughly 43 minutes per month. This 43 minutes is your error budget. Every minute of downtime “spends” some of that budget.
public class ErrorBudgetCalculator {

    /**
     * Calculates remaining error budget in minutes for a given
     * availability SLO over a 30-day window.
     */
    public double calculateRemainingBudgetMinutes(
            double sloPercentage, double downtimeMinutesSoFar) {

        double totalMinutesInWindow = 30 * 24 * 60; // 43,200 minutes
        double allowedDowntimeMinutes =
                totalMinutesInWindow * (1 - sloPercentage / 100.0);

        double remaining = allowedDowntimeMinutes - downtimeMinutesSoFar;
        return Math.max(remaining, 0);
    }

    public static void main(String[] args) {
        ErrorBudgetCalculator calc = new ErrorBudgetCalculator();
        // SLO of 99.9%, and 10 minutes of downtime already recorded
        double remaining = calc.calculateRemainingBudgetMinutes(99.9, 10);
        System.out.println("Remaining error budget: " + remaining + " minutes");
        // Output: Remaining error budget: 33.2 minutes
    }
}When the error budget is healthy (lots left), teams can ship new features quickly, even if slightly risky. When the error budget is nearly exhausted, teams pause feature work and focus entirely on stability. This is a widely used practice at Google’s Site Reliability Engineering (SRE) teams.
5.4 Step 4 — Alerting
If SLIs approach the edge of the SLO (not yet the SLA, but close), automated alerts fire, giving engineers a chance to fix problems before the stricter, contractual SLA is actually breached. Mature teams tune these alerts on burn rate — how fast the error budget is being consumed — rather than on raw thresholds, so a slow drift and a sudden cliff get treated differently.
5.5 Step 5 — Postmortems & Continuous Improvement
When an SLA or SLO is actually breached, mature engineering organizations conduct a “postmortem” — a structured, blame-free investigation into what happened, why it happened, and what changes (code, process, or monitoring) will prevent it from happening again. These postmortems are usually written down and shared across the team, turning every failure into a lesson that strengthens the system for the future. Over time, this feedback loop is what allows a system’s real-world reliability to keep improving even as traffic and complexity grow.
Instrument Every Request
Filters, middleware, or agents capture start & end timestamps, endpoint, and status code for each hop.
Aggregate into Time-Series
Per-minute buckets flow into Prometheus / Datadog / CloudWatch and are summarised as p50/p95/p99.
Compare Against SLO
Rolling 30-day error budget is recomputed continuously; teams see exactly how much runway remains.
Alert on Burn Rate
Pages fire not only when the SLO is missed, but when the current rate of consumption would exhaust the budget too soon.
Postmortem & Learn
Every breach becomes a blameless writeup with concrete follow-ups — the system gets more reliable each cycle.
Data Flow & the Latency Budget
Let’s trace a single user request end-to-end, and see exactly where time is spent — this is often called the “latency budget” of a request.
6.1 Breaking Down the Latency Budget
Suppose your SLA promises a p95 latency of 300ms. Engineers often break this “budget” down across the stack:
| Stage | Typical Budget | Notes |
|---|---|---|
| Network (client to server) | 40ms | Depends on user’s geography; CDNs reduce this |
| Load balancer + gateway | 5ms | Routing and auth checks |
| Application logic | 50ms | Business logic, validation |
| Cache lookup | 2ms | If cache hit |
| Database query (if cache miss) | 150ms | The most common bottleneck |
| Serialization + response | 10ms | Converting data to JSON, etc. |
| Total | ~257ms | Leaves a small buffer under the 300ms SLA |
Meeting an SLA is not a one-time achievement — it is a continuous lifecycle: measure → compare against SLO → detect drift → investigate → fix → re-measure. This loop runs forever, 24 hours a day, as long as the system is live.
Advantages, Disadvantages & Trade-offs
SLAs are enormously valuable, but they are not free. The most common mistakes are either under-committing (a useless SLA) or over-committing (an SLA the architecture can’t support).
Advantages of Defining SLAs
- Sets clear, shared expectations between provider and customer
- Gives engineering teams concrete design targets
- Builds customer trust through transparency and accountability
- Enables objective measurement of system health over time
- Provides a business justification for reliability investments
- Creates a shared language between engineering, product, and business teams
Disadvantages & Challenges
- Overly strict SLAs can force expensive over-engineering
- Poorly chosen metrics (like averages) can hide real problems
- SLAs can create legal and financial risk if breached
- Chasing SLA numbers can distract from real user experience
- Requires ongoing investment in monitoring infrastructure
- Multiple dependent SLAs (from third parties) can be hard to compose reliably
7.1 Stricter SLAs vs. Cost
Going from 99.9% (“three nines,” about 8.7 hours of downtime per year) to 99.99% (“four nines,” about 52 minutes per year) can require dramatically more infrastructure: redundant data centers, automated failover, extensive testing. Each additional “nine” often costs exponentially more to achieve.
Getting from “good” to “very good” reliability is like renovating a house. Fixing an obviously broken window is cheap. But making the house withstand a magnitude-9 earthquake requires completely rebuilding the foundation. The last little bit of reliability is always the most expensive.
7.2 Strict Latency vs. Feature Richness
Adding more features to an API response (extra fields, extra joins, personalization) often means more processing time, which can conflict with a strict latency SLA. Teams must balance richness of functionality against speed — sometimes deliberately splitting a “fast core” response from a slower “enrichment” response that arrives asynchronously.
7.3 Consistency vs. Latency
Systems that guarantee strong data consistency (every read sees the latest write) often have to wait for confirmations across multiple servers, adding latency. Systems that accept “eventual consistency” can respond faster but might occasionally show slightly stale data. This connects directly to the CAP theorem, a foundational system design concept.
7.4 Global Reach vs. Operational Complexity
Expanding to multiple regions to reduce latency for users around the world is powerful, but it multiplies operational complexity: data now needs to be replicated and kept in sync across continents, deployments must be coordinated across regions, and teams must reason about network partitions between data centers. Many companies deliberately delay multi-region expansion until their user base and revenue clearly justify the added engineering overhead, choosing instead to optimize a single, well-run region first.
Performance & Scalability
To meet a performance SLA, architecture must be explicitly designed for both speed and the ability to grow under load. Every technique below buys back some part of the latency budget or lifts the throughput ceiling.
8.1 Horizontal Scaling
Instead of making one server more powerful (vertical scaling), you add more servers running the same code (horizontal scaling), and spread traffic across them using a load balancer. This is the most common technique for meeting throughput SLAs at scale, and it is the pattern that allows an application to grow from ten users to ten million without a rewrite.
8.2 Caching Strategies
Caching is one of the single most powerful tools for meeting latency SLAs, because reading from memory (like Redis) is typically 10-100x faster than querying a disk-based database.
@Service
public class ProductService {

    private final RedisTemplate<String, Product> redisTemplate;
    private final ProductRepository productRepository;

    public ProductService(RedisTemplate<String, Product> redisTemplate,
                           ProductRepository productRepository) {
        this.redisTemplate = redisTemplate;
        this.productRepository = productRepository;
    }

    public Product getProduct(String productId) {
        String cacheKey = "product:" + productId;

        // 1. Try the cache first
        Product cached = redisTemplate.opsForValue().get(cacheKey);
        if (cached != null) {
            return cached; // Cache hit - very fast, protects latency SLA
        }

        // 2. Cache miss - fall back to the database
        Product fromDb = productRepository.findById(productId)
                .orElseThrow(() -> new ProductNotFoundException(productId));

        // 3. Populate the cache for next time, with an expiry
        redisTemplate.opsForValue().set(cacheKey, fromDb,
                Duration.ofMinutes(10));

        return fromDb;
    }
}
8.3 Asynchronous Processing
Not every task needs to happen before responding to the user. Sending a confirmation email, for example, can happen in the background. Moving non-critical work off the “critical path” of a request directly reduces the latency the user experiences, helping meet the SLA.
8.4 Connection Pooling
Opening a new database connection for every request is expensive. Connection pools keep a set of ready-to-use connections open, drastically cutting latency for database-heavy operations — a small change with an outsized impact on tail latency.
Horizontal Scaling
Add more instances behind the load balancer instead of buying a bigger box. Cheap capacity, no single hot node.
Cache-Aside
Hit Redis first; on miss, read the DB and populate the cache. Trades a small staleness window for 10–100x speed-up.
Async Off-Path Work
Push emails, indexing, analytics onto a queue so the user’s p95 latency doesn’t pay for background jobs.
Connection Pooling
Reuse DB / HTTP connections; eliminate the TCP+TLS handshake tax on every request.
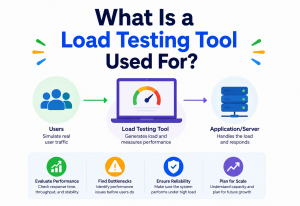
Never publish a performance SLA without load testing your system under realistic (and peak) traffic first. Tools like Apache JMeter, Gatling, or k6 simulate thousands of concurrent users so you can discover your system’s true breaking point before your customers do.
High Availability & Reliability
Availability SLAs (like “99.95% uptime”) require architecture specifically designed so that no single failure takes the whole system down.
9.1 Redundancy
Running multiple instances of every critical component — servers, databases, even entire data centers — so that if one fails, others continue serving traffic without user-visible interruption.
9.2 Failover
The automatic process of switching traffic from a failed component to a healthy backup, ideally without the user noticing anything at all.
9.3 Circuit Breakers
A circuit breaker is a pattern that stops calling a failing downstream service, instead “failing fast” and returning a fallback response. This prevents one broken dependency from cascading into a system-wide outage — directly protecting the availability SLA.
@Service
public class PaymentGatewayClient {

    private final CircuitBreaker circuitBreaker;
    private final RestTemplate restTemplate;

    public PaymentGatewayClient(CircuitBreakerRegistry registry,
                                 RestTemplate restTemplate) {
        this.circuitBreaker = registry.circuitBreaker("paymentGateway");
        this.restTemplate = restTemplate;
    }

    public PaymentResult chargeCard(PaymentRequest request) {
        Supplier<PaymentResult> decoratedCall = CircuitBreaker
                .decorateSupplier(circuitBreaker, () ->
                        restTemplate.postForObject(
                                "/charge", request, PaymentResult.class));

        try {
            return decoratedCall.get();
        } catch (CallNotPermittedException ex) {
            // Circuit is OPEN - fail fast instead of waiting on a dead service
            return PaymentResult.fallback("Payment service temporarily unavailable");
        }
    }
}
9.4 Disaster Recovery
Beyond day-to-day failures, teams plan for major disasters (data center fires, regional outages) using two key metrics:
- RTO (Recovery Time Objective): How quickly must the system be restored after a disaster?
- RPO (Recovery Point Objective): How much data can we afford to lose (measured in time)?
Availability is calculated as: (Total time − Downtime) / Total time × 100. For 99.9% uptime over a year (525,600 minutes), you’re allowed only about 525.6 minutes (~8.76 hours) of downtime for the whole year.
Security & Its Impact on SLAs
Security and performance SLAs are deeply connected — a security incident (like a DDoS attack) is often the biggest threat to an availability SLA.
10.1 Rate Limiting
Protects the system from being overwhelmed — whether by malicious attackers or by a single misbehaving client — helping preserve latency and availability for everyone else.
@Component
public class TokenBucketRateLimiter {

    private final int capacity;
    private final int refillTokensPerSecond;
    private final Map<String, Bucket> buckets = new ConcurrentHashMap<>();

    public TokenBucketRateLimiter(int capacity, int refillTokensPerSecond) {
        this.capacity = capacity;
        this.refillTokensPerSecond = refillTokensPerSecond;
    }

    public boolean allowRequest(String clientId) {
        Bucket bucket = buckets.computeIfAbsent(clientId,
                id -> new Bucket(capacity));
        return bucket.tryConsume(refillTokensPerSecond);
    }

    static class Bucket {
        private double tokens;
        private long lastRefillTimestamp;
        private final int capacity;

        Bucket(int capacity) {
            this.capacity = capacity;
            this.tokens = capacity;
            this.lastRefillTimestamp = System.nanoTime();
        }

        synchronized boolean tryConsume(int refillRate) {
            refill(refillRate);
            if (tokens >= 1) {
                tokens -= 1;
                return true;
            }
            return false; // Request rejected - protects the system's SLA
        }

        private void refill(int refillRate) {
            long now = System.nanoTime();
            double secondsElapsed = (now - lastRefillTimestamp) / 1_000_000_000.0;
            tokens = Math.min(capacity, tokens + secondsElapsed * refillRate);
            lastRefillTimestamp = now;
        }
    }
}
10.2 DDoS Protection
Large-scale traffic floods can single-handedly destroy an availability SLA. Cloud providers offer dedicated DDoS protection services (like AWS Shield or Cloudflare) that absorb malicious traffic before it reaches your servers, keeping your legitimate users’ latency and error-rate SLIs intact even under attack.
10.3 TLS / Encryption Overhead
Encrypting traffic (HTTPS/TLS) adds a small amount of latency due to the cryptographic handshake and processing. Modern techniques like TLS session resumption, TLS 1.3 zero-round-trip resumption, and hardware acceleration minimize this cost, so security doesn’t have to come at the expense of your SLA.
Every security check — token validation, permission lookups — adds milliseconds. When your SLA budget is tight (like 100ms total), even authentication logic must be optimized and, where possible, cached.
Monitoring, Logging & Metrics
You cannot meet an SLA you cannot measure. Monitoring is the nervous system of SLA compliance.
11.1 The Three Pillars of Observability
| Pillar | What It Tells You | Common Tools |
|---|---|---|
| Metrics | Aggregated numbers over time (latency, error rate, throughput) | Prometheus, Grafana, Datadog |
| Logs | Detailed records of individual events | ELK Stack (Elasticsearch, Logstash, Kibana), Splunk |
| Traces | The full journey of a single request across many services | Jaeger, Zipkin, OpenTelemetry |
11.2 Distributed Tracing and Correlation IDs
In a microservices system, a single user request might pass through 10 different services. A correlation ID (a unique identifier attached to the request at the very start) lets engineers trace exactly where time was spent across all 10 services — essential for diagnosing SLA violations.
11.3 Dashboards and SLA Reporting
Teams build real-time dashboards showing p50/p95/p99 latency, error rate, and availability, usually compared directly against the SLO/SLA thresholds with visual “red/yellow/green” indicators. A well-designed dashboard lets a new on-call engineer glance at it and instantly know whether the system is healthy, degraded, or on fire.
11.4 Alerting on Symptoms, Not Just Causes
Modern SRE practice recommends alerting on user-facing symptoms (e.g., “latency SLO is at risk”) rather than every low-level cause (e.g., “CPU is at 80%”), because high CPU doesn’t always mean users are affected — but breached latency always does.
Google’s SRE book recommends monitoring four golden signals for any service: Latency, Traffic, Errors, and Saturation (how “full” your system is). These four signals map almost directly onto the components of a performance SLA.
Deployment & Cloud
How and where you deploy your system has a huge impact on your ability to meet SLAs. Multi-region deployment, autoscaling, and safer release patterns all directly buy back headroom against your promise.
12.1 Multi-Region Deployment
Deploying your application across multiple geographic regions (e.g., US, Europe, Asia) reduces latency for users worldwide and provides resilience if an entire region fails. It is the single biggest lever a global product has for improving both latency SLAs and availability SLAs at the same time.
12.2 Auto-Scaling
Cloud platforms (AWS, Azure, GCP) let you automatically add more server instances when traffic increases, and remove them when traffic drops — helping maintain latency and throughput SLAs during traffic spikes without wasting money during quiet periods.
12.3 Kubernetes and Container Orchestration
Kubernetes automatically restarts crashed containers, redistributes load, and can scale application pods up or down based on real-time demand — all of which directly support availability SLAs.
apiVersion: autoscaling/v2
kind: HorizontalPodAutoscaler
metadata:
  name: order-service-hpa
spec:
  scaleTargetRef:
    apiVersion: apps/v1
    kind: Deployment
    name: order-service
  minReplicas: 3
  maxReplicas: 20
  metrics:
  - type: Resource
    resource:
      name: cpu
      target:
        type: Utilization
        averageUtilization: 65
12.4 Blue-Green and Canary Deployments
Deploying new code gradually (canary) or by switching entire environments (blue-green) reduces the risk that a bad deployment breaches your SLA, because problems can be caught and rolled back before they affect all users.
AWS publishes specific SLAs for services like Amazon EC2 (compute) and Amazon S3 (storage), guaranteeing specific monthly uptime percentages, with service credits if they’re not met. These are a great real example to study when learning how SLAs are documented and enforced.
Databases, Caching & Load Balancing
These three components are often where SLA violations begin, since data access is frequently the slowest part of any request.
13.1 Database Optimization
- Indexing: Proper indexes turn slow full-table scans into fast lookups.
- Read Replicas: Copies of the database dedicated to handling read queries, freeing the primary database for writes.
- Sharding: Splitting a huge database into smaller pieces (shards) spread across multiple servers, improving both performance and capacity.
- Connection Pooling: Reusing database connections instead of creating new ones for every request.
13.2 Caching Layers
Caching can happen at multiple levels: browser cache, CDN cache, application-level cache (like Redis), and even database query caches. Each layer removes work from the layers below it, and the compound effect of good caching is often the single biggest lever a team has for meeting a strict latency SLA.
13.3 Load Balancing Algorithms
| Algorithm | How It Works | Best For |
|---|---|---|
| Round Robin | Sends requests to servers in rotation | Servers with similar capacity |
| Least Connections | Sends requests to the server with fewest active connections | Uneven request durations |
| Weighted Round Robin | Gives more traffic to more powerful servers | Mixed server capacities |
| Latency-Based | Routes to the server currently responding fastest | Global, geographically distributed systems |
A very common SLA-breaking bug is the “N+1 query problem” — where code accidentally runs one database query per item in a list, instead of a single batched query. Fetching 100 orders might silently trigger 101 separate database queries, quietly destroying your latency SLA under load.
APIs & Microservices
In a microservices architecture, a single user-facing request can trigger a chain of internal API calls. This makes SLA management significantly more complex than in a single, monolithic application.
14.1 The Multiplication Problem
If Service A calls Service B, and Service B calls Service C, then Service A’s total latency is at least the sum of B’s and C’s latencies, plus A’s own processing time. If each service individually meets a “99% under 200ms” SLA, the combined chain’s reliability and latency can be noticeably worse than any single service.
Think of a relay race. Each runner might be individually fast, but the team’s total time is the sum of all four runners — plus any fumbled handoffs (network calls) in between. A performance SLA for the whole team must account for every runner and every handoff, not just the fastest one.
14.2 API Gateway Responsibilities
- Enforcing per-client rate limits to protect overall system SLAs
- Aggregating multiple backend calls into a single client-facing response
- Adding timeouts, so one slow service can’t hang the entire request forever
14.3 Timeouts and Fallbacks
@Service
public class InventoryClient {

    private final WebClient webClient;

    public InventoryClient(WebClient.Builder builder) {
        this.webClient = builder.baseUrl("http://inventory-service").build();
    }

    public Mono<StockLevel> getStockLevel(String sku) {
        return webClient.get()
                .uri("/stock/{sku}", sku)
                .retrieve()
                .bodyToMono(StockLevel.class)
                .timeout(Duration.ofMillis(150)) // hard SLA-driven timeout
                .onErrorReturn(StockLevel.unknown()); // graceful fallback
    }
}
14.4 Idempotency in Retries
When a call times out, systems often retry automatically. But retrying a non-idempotent operation (like “charge $10”) could accidentally charge the customer twice. SLA-aware systems use idempotency keys to make retries safe.
When your system depends on multiple third-party APIs, your overall availability is roughly the product of each dependency’s availability. Two services each at 99.9% availability, used together in sequence, produce a combined availability closer to 99.8% — always slightly worse than either alone.
Design Patterns & Anti-patterns
Patterns codify the moves that repeatedly protect an SLA in production; anti-patterns catalog the ones that repeatedly break one. Learning both together is much faster than learning either alone.
15.1 Helpful Design Patterns
Circuit Breaker Pattern
Already covered above — stops repeated calls to a failing service, protecting overall system latency and availability by refusing to wait on something that is clearly broken.
Bulkhead Pattern
Named after ship compartments that prevent one flooded section from sinking the whole ship. In software, this means isolating resources (like thread pools) per dependency, so one slow dependency can’t exhaust resources needed by others.
Retry with Exponential Backoff
When a call fails, instead of retrying immediately (which can overload an already-struggling service), wait progressively longer between each retry attempt.
public <T> T retryWithBackoff(Supplier<T> operation, int maxRetries) {
    int attempt = 0;
    long delayMs = 100; // start with 100ms

    while (true) {
        try {
            return operation.get();
        } catch (TransientException ex) {
            attempt++;
            if (attempt >= maxRetries) {
                throw ex; // give up after max attempts
            }
            try {
                Thread.sleep(delayMs);
            } catch (InterruptedException ie) {
                Thread.currentThread().interrupt();
            }
            delayMs *= 2; // exponential growth: 100ms, 200ms, 400ms...
        }
    }
}
Graceful Degradation
When part of a system is under stress, deliberately turn off non-essential features (like personalized recommendations) to keep the core functionality (like checkout) fast and available.
15.2 Common Anti-patterns
Monitoring only average latency, never percentiles, is one of the most common SLA-related mistakes. It hides the exact problems your SLA cares about most: the worst-case experiences.
Calling downstream services synchronously without any timeout means one slow dependency can hang your entire request indefinitely, consuming threads and eventually crashing your service.
Publishing an aggressive SLA (like 99.999%) purely for marketing purposes, without the actual architecture or budget to support it, sets the team up for constant breaches, financial penalties, and burnout.
Patterns Worth Copying
- Circuit breakers around every non-trivial downstream call
- Bulkheads / isolated pools per dependency
- Retry with exponential backoff and jitter
- Graceful degradation on non-critical features first
- Idempotency keys so retries are safe
Anti-patterns to Avoid
- Average-only dashboards that hide the tail
- Synchronous chains with no timeouts
- Vanity SLAs unsupported by the architecture
- Ignoring third-party dependency SLAs
- Treating monitoring as optional “phase two” work
Best Practices & Common Mistakes
The short version: measure percentiles, keep the SLO stricter than the SLA, load test, alert on symptoms, and review the whole thing periodically.
16.1 Best Practices
- Always use percentiles (p95, p99), never just averages, for latency SLAs.
- Set SLOs stricter than your SLA to leave a safety buffer before contractual penalties kick in.
- Measure from the user’s perspective whenever possible (client-side timing), not just server-side timing, since network latency matters too.
- Use error budgets to balance feature velocity against reliability work.
- Load test regularly, not just before major launches — traffic patterns and code both change over time.
- Design for graceful degradation so partial failures don’t become total outages.
- Automate alerting tied directly to SLO thresholds, not arbitrary technical metrics.
- Review and renegotiate SLAs periodically as your system, traffic, and business needs evolve.
16.2 Common Mistakes
- Setting SLA targets based on hope rather than actual load-tested data.
- Ignoring the “long tail” — the small percentage of very slow requests that damage trust the most.
- Forgetting that third-party dependencies (payment gateways, external APIs) directly affect your own SLA.
- Not accounting for scheduled maintenance windows in availability calculations.
- Treating SLA compliance as a one-time project instead of continuous operational discipline.
Have we load-tested at 2–3x expected peak traffic? Do we measure p95/p99, not just averages? Do we have alerting before the SLA is breached, not just after? Do we have a rollback plan for bad deployments? If any answer is “no,” the SLA number is a guess, not a guarantee.
Real-World & Industry Examples
The concepts above are not abstract — they map directly onto how Netflix, Amazon, Google, Uber, the cloud providers, Stripe, Slack, and regulated banking systems actually structure their production reliability programs.
17.1 Netflix
Netflix is famous for pioneering chaos engineering — deliberately injecting failures into production (using a tool called Chaos Monkey) to continuously prove that their system can maintain its availability SLA even when individual components fail unexpectedly.
17.2 Amazon
Amazon’s internal culture treats latency as a first-class business metric. Teams across the company are famously driven by the principle that even tiny latency increases measurably hurt revenue, which shaped Amazon’s early adoption of microservices and aggressive caching strategies.
17.3 Google
Google’s Site Reliability Engineering (SRE) discipline, detailed in their widely-read SRE book, formalized the SLI/SLO/SLA framework and the concept of error budgets that much of the industry now uses as a standard vocabulary.
17.4 Uber
Uber’s ride-matching system must meet extremely tight latency SLAs (matching riders and drivers in a few hundred milliseconds) across a globally distributed, high-throughput system, driving heavy investment in geo-distributed caching and real-time data pipelines.
17.5 Cloud Providers (AWS, Azure, GCP)
These companies publish detailed, public SLA documents for individual services (compute, storage, databases), each specifying exact uptime percentages and the service credits customers receive if those percentages aren’t met — a useful real-world reference for how formal SLAs are structured and worded.
17.6 Stripe
Stripe, a major payment processing platform, is a good example of an API-first business where a performance SLA is core to the product itself. Because checkout flows are extremely sensitive to delay — shoppers abandon slow checkout pages — Stripe invests heavily in global infrastructure, redundant data centers, and careful API design so that payment confirmation happens in a fraction of a second for the vast majority of transactions.
17.7 Slack
Slack, a workplace messaging platform, publishes a public status history and maintains internal SLOs around message delivery latency and connection uptime. Because Slack is often described by customers as “critical infrastructure” for their own teams, even short outages generate significant customer concern, which is why Slack treats its reliability targets as a central engineering priority, not an afterthought.
17.8 Banking and Financial Systems
Core banking systems and stock exchanges often operate under some of the strictest performance SLAs in the entire software industry, sometimes measured in single-digit milliseconds for trade execution. Regulatory bodies in many countries also mandate minimum reliability standards for systems that handle payments and financial transactions, turning performance SLAs from a competitive advantage into a legal requirement.
Netflix
Chaos engineering — deliberately break things in production to prove the SLA still holds.
Amazon
Latency treated as a revenue lever; every extra 100ms is a business metric, not just an engineering one.
Google SRE
Formalised SLI/SLO/SLA and error budgets — the vocabulary the industry now speaks.
Uber
Sub-second ride matching over a global, high-throughput system.
Cloud Providers
Public, per-service SLAs with real service credits when they miss.
Stripe
API-first business where the SLA is the product; checkout speed drives revenue.
Slack
Public status history and internal SLOs on message-delivery latency for “critical infra” status.
Banking / Exchanges
Single-digit millisecond SLAs with regulatory teeth — reliability as a legal requirement.
Every one of these companies treats reliability and speed not as a “nice to have,” but as a core part of the product itself. Their engineering organizations are structured — with dedicated SRE teams, on-call rotations, and reliability reviews — specifically to protect the promises made in their SLAs.
FAQ, Summary & Key Takeaways
The questions beginners and engineers actually ask — plus a compact list of takeaways to carry with you when the details fade.
Is an SLA the same as an SLO?
No. An SLO is an internal target used by engineering teams to guide their own work. An SLA is a formal, often contractual, agreement made with customers, usually including specific consequences (like refunds) if the target is missed.
Why use percentiles instead of average response time?
Averages can hide bad experiences. If most requests are fast but a small percentage are very slow, the average can still look acceptable while a meaningful number of real users are having a poor experience. Percentiles like p95 and p99 reveal that hidden tail.
What does “99.9% availability” actually mean in practice?
It means the system is allowed to be down for about 8.76 hours across an entire year (or roughly 43 minutes per month), while still meeting the SLA.
What is an error budget?
It’s the total amount of unreliability “allowed” under an SLO before it’s breached — for example, if your SLO is 99.9% over 30 days, your error budget is the remaining 0.1% of that time, which teams can “spend” on acceptable risk while shipping new features.
Can a system have multiple different SLAs?
Yes. It’s common to have separate SLAs for different aspects: one for availability, one for latency, sometimes even different latency SLAs for different types of requests (e.g., read operations vs. write operations).
How do third-party dependencies affect my SLA?
If your system depends on external services, your own overall reliability can never exceed the combined reliability of all your dependencies. This is why teams build fallbacks, timeouts, and circuit breakers around third-party calls.
Should scheduled maintenance count as downtime against the SLA?
Most SLA documents explicitly exclude pre-announced, scheduled maintenance windows from downtime calculations, as long as customers are notified in advance. This is why reading the fine print of a published SLA matters — the definition of “downtime” itself is a negotiated term.
What is the difference between latency and throughput, in one sentence?
Latency measures how long a single request takes, while throughput measures how many requests the system can handle over a period of time; a system can be individually fast (low latency) yet still unable to handle high volume (low throughput), or vice versa.
Who is typically responsible for defining an SLA inside a company?
It’s usually a collaborative effort: engineering teams (especially SREs and architects) propose what is technically achievable, product and business teams define what customers actually need, and legal teams formalize the consequences into contract language.
Do internal microservices need SLAs too, even without external customers?
Yes. Many large companies treat internal teams as “customers” of each other’s services, defining internal SLOs (sometimes even internal SLAs with informal consequences) so that teams can build confidently on top of each other’s systems without constantly checking whether a dependency is trustworthy.
Key Takeaways
- A performance SLA is a measurable, often contractual, promise about how fast, reliable, and available a system will be.
- SLI, SLO, and SLA form a hierarchy: SLI is the raw measurement, SLO is the internal target, SLA is the external, consequence-bearing promise.
- Percentiles (p50, p95, p99) matter far more than averages for understanding real user experience.
- Meeting an SLA is a whole-system effort — involving CDNs, load balancers, caching, databases, monitoring, and resilience patterns working together.
- Error budgets give teams a data-driven way to balance new feature development against reliability investment.
- Resilience patterns like circuit breakers, bulkheads, retries with backoff, and graceful degradation directly protect SLA compliance.
- Observability — metrics, logs, and traces — is non-negotiable; you cannot meet an SLA you cannot measure.
- Real companies like Google, Netflix, Amazon, and Uber have built entire engineering cultures and practices around meeting demanding performance SLAs at massive scale.
18.1 Where to Go From Here
Understanding performance SLAs deeply — not just as a business document but as a set of engineering forces that shape architecture — is one of the most valuable skills for anyone building or operating production software systems. Every caching decision, every retry policy, every choice of database, ultimately traces back to one question: does this help us keep our promise to the user?
As you continue studying system design, you will find that almost every advanced topic — sharding, consensus algorithms, message queues, service meshes — exists, in some way, to help a system meet its performance SLA more reliably and at greater scale. Keeping this single idea in mind — that architecture serves the promise — will help you make better design decisions throughout your career, whether you’re building your first API or operating a system that serves millions of users every day.

